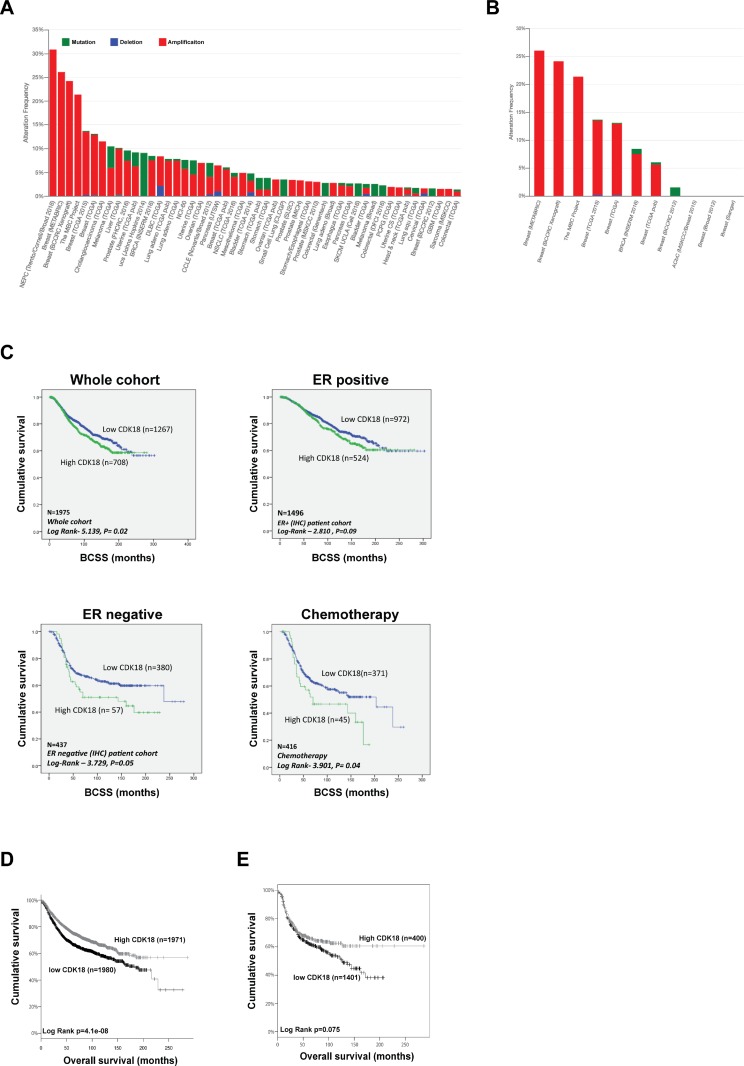
Figure 1. Genetic and transcriptomic analysis of CDK18 in breast cancer cohorts.
(A) Prevalence of CDK18 amplification (red; mainly due to copy number variance gains), deletion (blue) and mutations (green) across human cancers (derived from cBioPortal; http://www.cbioportal.org/). Pink circles under the bar chart represent breast cancer cohorts, which show a high prevalence for CDK18 amplification. (B) CDK18 amplification from the cBioPortal data stratified for breast cancer cohorts, showing high frequency of CDK18 CNV gains across multiple breast cancer cohorts (pink circles). (C) Kaplan–Meier survival curves derived from analysis of the METABRIC dataset of around 1980 breast cancer patients, plotted for CDK18 mRNA expression against breast cancer-specific survival (BCSS) and stratified as indicated above each graph. The chemotherapy data was derived from patients whose tumours were treated with the replication stress-inducing agents 5-FU, methotrexate and/or cyclophosphamide. (D) Kaplan–Meier survival curves of CDK18 mRNA expression (above or below median mRNA expression levels across the cohorts) derived from combined TGCA and EGA breast cancer cohorts (KMplotter; [45]; http://kmplot.com/analysis/index.php?p=service). (E) Same as in (D), but stratified for ER- tumours.

