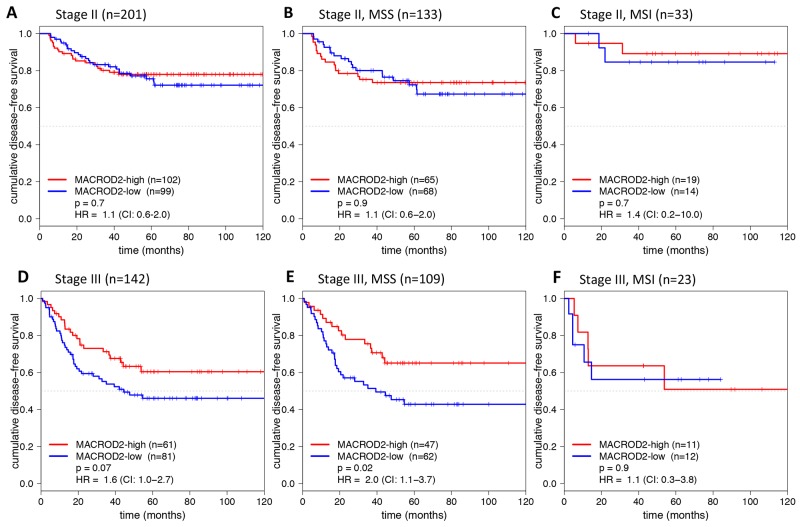
Figure 2.
Kaplan-Meier plots for DFS (in months) stratified for MACROD2-high and MACROD2-low protein expression in stage II (A-C) and stage III (D-F) colon cancer patients including the subset of MSS (B, E) and MSI (C, F) patients. Log-rank p-values and Cox regression hazard ratios (HRs) with 95% confidence intervals (CIs) are reported.

