Abstract
The endogenous metabolite itaconate has recently emerged as a regulator of macrophage function, but its precise mechanism of action remains poorly understood1–3. Here we show that itaconate is required for the activation of the anti-inflammatory transcription factor Nrf2 (also known as NFE2L2) by lipopolysaccharide in mouse and human macrophages. We find that itaconate directly modifies proteins via alkylation of cysteine residues. Itaconate alkylates cysteine residues 151, 257, 288, 273 and 297 on the protein KEAP1, enabling Nrf2 to increase the expression of downstream genes with anti-oxidant and anti-inflammatory capacities. The activation of Nrf2 is required for the anti-inflammatory action of itaconate. We describe the use of a new cell-permeable itaconate derivative, 4-octyl itaconate, which is protective against lipopolysaccharide-induced lethality in vivo and decreases cytokine production. We show that type I interferons boost the expression of Irg1 (also known as Acod1) and itaconate production. Furthermore, we find that itaconate production limits the type I interferon response, indicating a negative feedback loop that involves interferons and itaconate. Our findings demonstrate that itaconate is a crucial anti-inflammatory metabolite that acts via Nrf2 to limit inflammation and modulate type I interferons.
Macrophages have a key role in innate immunity. They respond rapidly to pathogens and subsequently promote an anti-inflammatory phenotype to limit damage and promote tissue repair. The factors driving these changes are incompletely understood. Itaconate, a metabolite synthesized by the enzyme encoded by Irg11, is increased in lipopoly-saccharide (LPS)-activated macrophages2 and has been suggested to limit inflammation by inhibiting succinate dehydrogenase (SDH), a crucial pro-inflammatory regulator4; however, the details remain unclear.
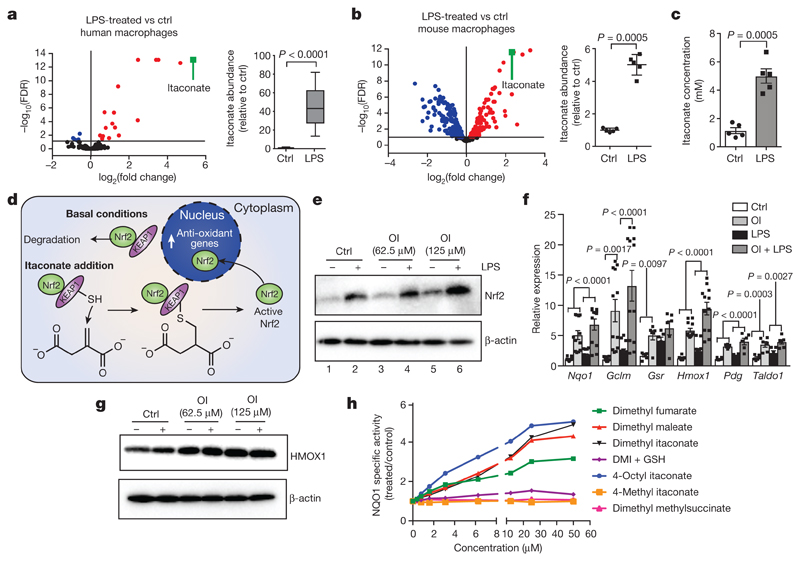
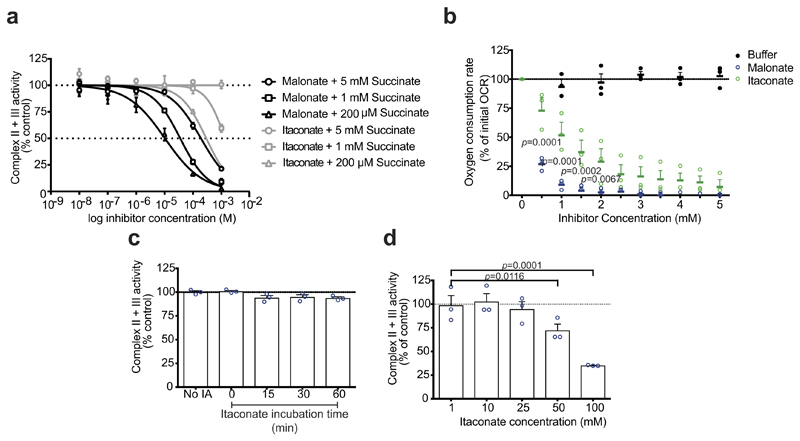
Itaconate was the most abundant metabolite in LPS-treated human macrophages (Fig. 1a) and reached 5 mM in mouse bone marrow-derived macrophages (BMDMs) after LPS stimulation (Fig. 1b, c). Itaconate can disrupt SDH activity, but is less potent than the classic SDH inhibitor malonate (Extended Data Fig. 1), suggesting that it may exert its anti-inflammatory effects via additional mechanisms.
Figure 1. Itaconate activates Nrf2.
a–c, Metabolite levels and itaconate abundance in control (ctrl) versus LPS-induced (a, n = 12, 4 h; b, c, n = 5, 24 h) human (a) and mouse (b, c) macrophages. Red and blue dots represent metabolites significantly up- and downregulated by LPS, respectively. FDR, false discovery rate. d, Reactivity of itaconate with KEAP1 thiol group. e, g, LPS-induced Nrf2 (e, 24 h) and HMOX1 (g, 6 h) after treatment with OI as indicated. f, Nrf2 target gene expression in mouse macrophages with or without LPS (6 h) and OI (Nqo1, Gclm, Hmox1, n = 12; Gsr, Pgd, Taldo1, n = 6). h, NQO1 activity in mouse Hepa1c1c7 cells treated as indicated (48 h, n = 8). Data are mean ± s.e.m. P values calculated using one-way or two-way analysis of variance (ANOVA) for multiple comparisons or two-tailed Student’s t-test for paired comparisons. Blots are representative of three independent experiments. In the box plots, line shows mean. For gel source data, see Supplementary Fig. 1.
Itaconate contains an electrophilic α,β-unsaturated carboxylic acid that could potentially alkylate protein cysteine residues by a Michael addition to form a 2,3-dicarboxypropyl adduct. An attractive candidate protein that undergoes cysteine alkylation is KEAP1, a central player in the anti-oxidant response (Fig. 1d). KEAP1 normally associates with and promotes the degradation of Nrf2, but alkylation of crucial KEAP1 cysteine residues allows newly synthesized Nrf2 to accumulate, migrate to the nucleus and activate a transcriptional anti-oxidant and antiinflammatory program5. We therefore examined KEAP1 and Nrf2 as targets of itaconate.
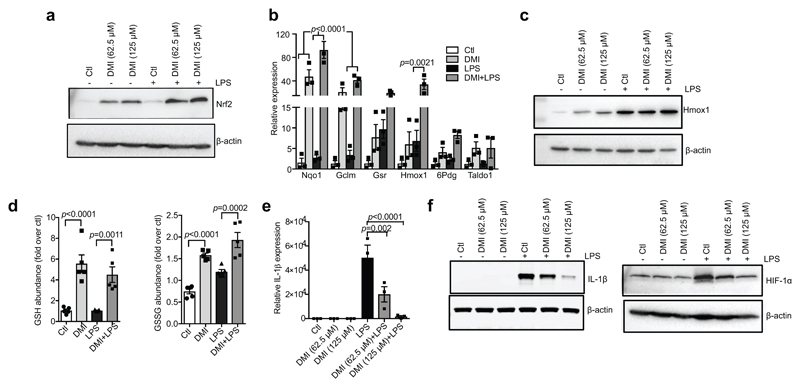
The cell-permeable itaconate derivative dimethyl itaconate (DMI)3 boosted levels of Nrf2 protein, expression of downstream target genes, including Hmox1, and glutathione (GSH) (Extended Data Fig. 2a–d). However, the lack of a negative charge on the conjugated ester group in DMI increases its reactivity towards Michael addition, making it a far superior Nrf2 activator than itaconate akin to the potent Nrf2 activator dimethylfumarate (DMF)6. DMI is rapidly degraded within cells without releasing itaconate7, hence is unlikely to mimic endogenous itaconate. Even so, these data indicate that Nrf2 activation is antiinflammatory8 (Extended Data Fig. 2e, f).
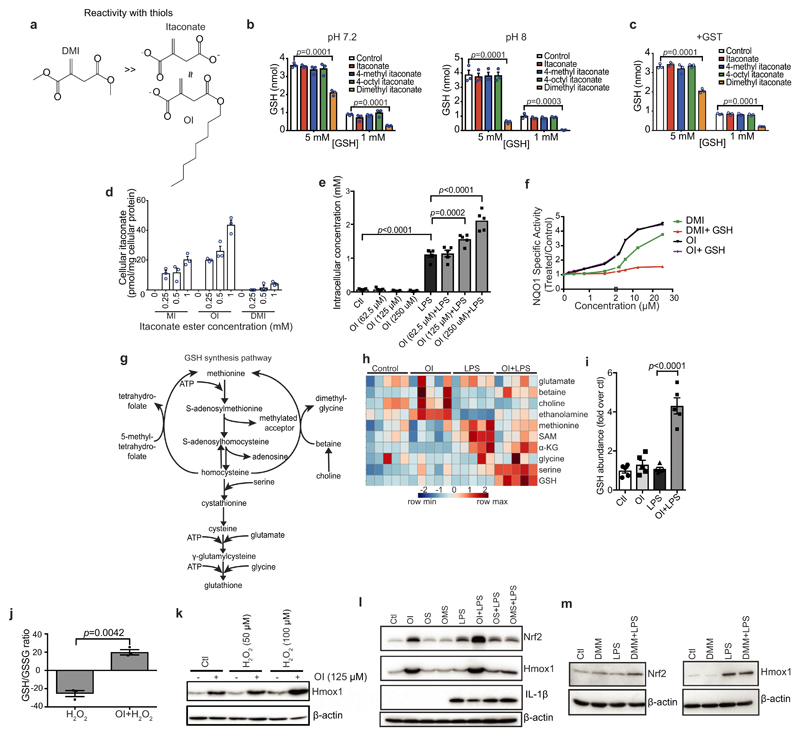
To overcome the limitations of DMI, we synthesized 4-octyl itaconate (OI), a cell-permeable itaconate derivative (Extended Data Fig. 3a). Itaconate and OI had similar thiol reactivity that was far lower than that of DMI (Extended Data Fig. 3b, c, f), making it a suitable cell-permeable itaconate surrogate. Furthermore, OI was hydrolysed to itaconate by esterases in mouse myoblast C2C12 cells (Extended Data Fig. 3d) and LPS-activated mouse macrophages (Extended Data Fig. 3e). OI boosted Nrf2 levels (Fig. 1e, compare lane 5 to lane 1) and enhanced LPS-induced Nrf2 stabilization (Fig. 1e, compare lane 6 to lane 2), and increased the expression of downstream target genes9, including the anti-inflammatory protein HMOX110 (Fig. 1f, g). We used a quantitative NAD(P)H:quinone oxidoreductase-1 (NQO1) inducer bioassay11,12, to assess the potency of Nrf2 activation by the CD value (concentration required to double the specific enzyme activity) for NQO1, the prototypical Nrf2 target gene. OI (CD value of 2 μM), was more potent than the clinically used Nrf2 activator DMF (CD value of 6.5 μM) (Fig. 1h, Extended Data Fig. 3f). OI stimulated synthesis of the key anti-oxidant GSH (Extended Data Fig. 3g–i). OI also boosted canonical activation of Nrf2 by the pro-oxidant hydrogen peroxide (H2O2) (Extended Data Fig. 3j, k). Importantly, the related octyl esters 4-octyl 2-methylsuccinate and octyl succinate, which are not Michael acceptors, had no effect on Nrf2 activity, confirming the requirement for the itaconate moiety (Extended Data Fig. 3l). Dimethyl malonate, a potent SDH inhibitor4, did not activate Nrf2 (Extended Data Fig. 3m), confirming that Nrf2 activation by OI is independent of SDH inhibition.
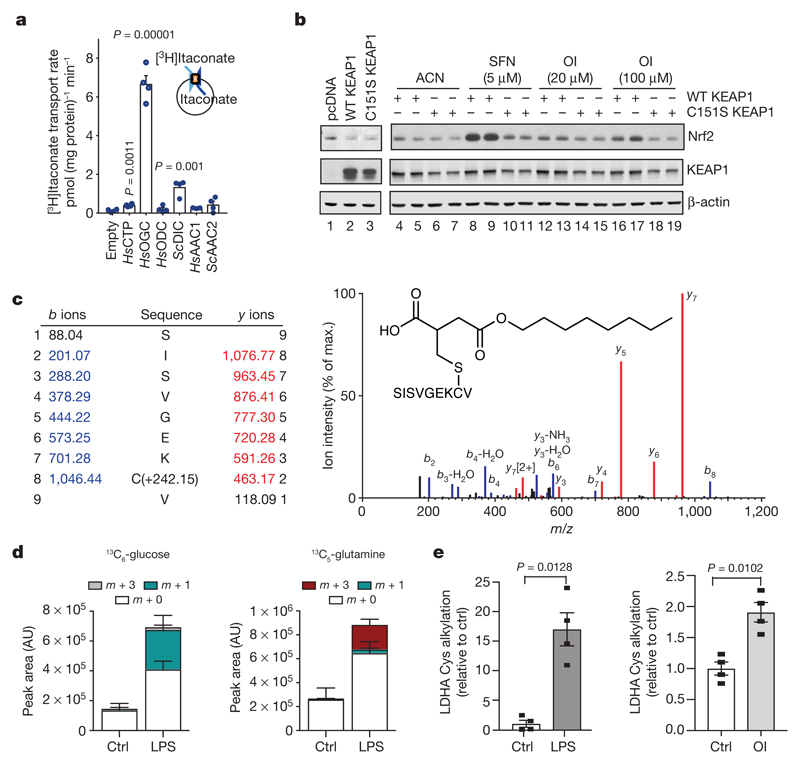
Itaconate is generated by IRG1 in the mitochondrial matrix and must cross the mitochondrial inner membrane to act on Nrf2 in the cytosol. Itaconate is structurally similar to malate, which is transported across the mitochondrial inner membrane by the dicarboxylate, citrate and oxoglutarate carriers. All three carriers transported itaconate, whereas other tested carriers could not (Fig. 2a and Extended Data Fig. 4), suggesting that LPS-induced itaconate is generated in the mitochondrial matrix and is then exported to the cytosol to activate Nrf2.
Figure 2. Itaconate alkylates cysteines.
a, Itaconate transport by the indicated carriers(n = 4). HsAAC1, Homo sapiens ADP/ATP carrier; HsCTP, H. sapiens citrate carrier; HsODC, H. sapiens oxodicarboxylate carrier; HsOGC, H. sapiens 2-oxoglutarate carrier; ScAAC2, Saccharomyces cerevisiae ADP/ATP carrier; ScDIC, S. cerevisiae dicarboxylate carrier. b, Nrf2 and KEAP1 protein after co-transfection with Nrf2–V5, and the wild-type (WT) or Cys151Ser mutant KEAP1. c, Tandem mass spectrometry spectrum of Cys151-containing KEAP1 peptide after OI treatment. d, Metabolite (13C6-glucose (left), 13C5-glutamine (right)) tracing to itaconate-cysteine adduct with or without LPS (24 h, n = 5). AU, arbitrary units. e, LDHA Cys84 alkylation plus LPS (24 h) or OI (250 μM, 4 h) (n = 4). Data are mean ± s.e.m. (in d, e) or s.d. (in a). P values calculated using one-way ANOVA for multiple comparisons or two-tailed Student’s t-test for paired comparisons. Blots are representative of three independent experiments. For gel source data, see Supplementary Fig. 1.
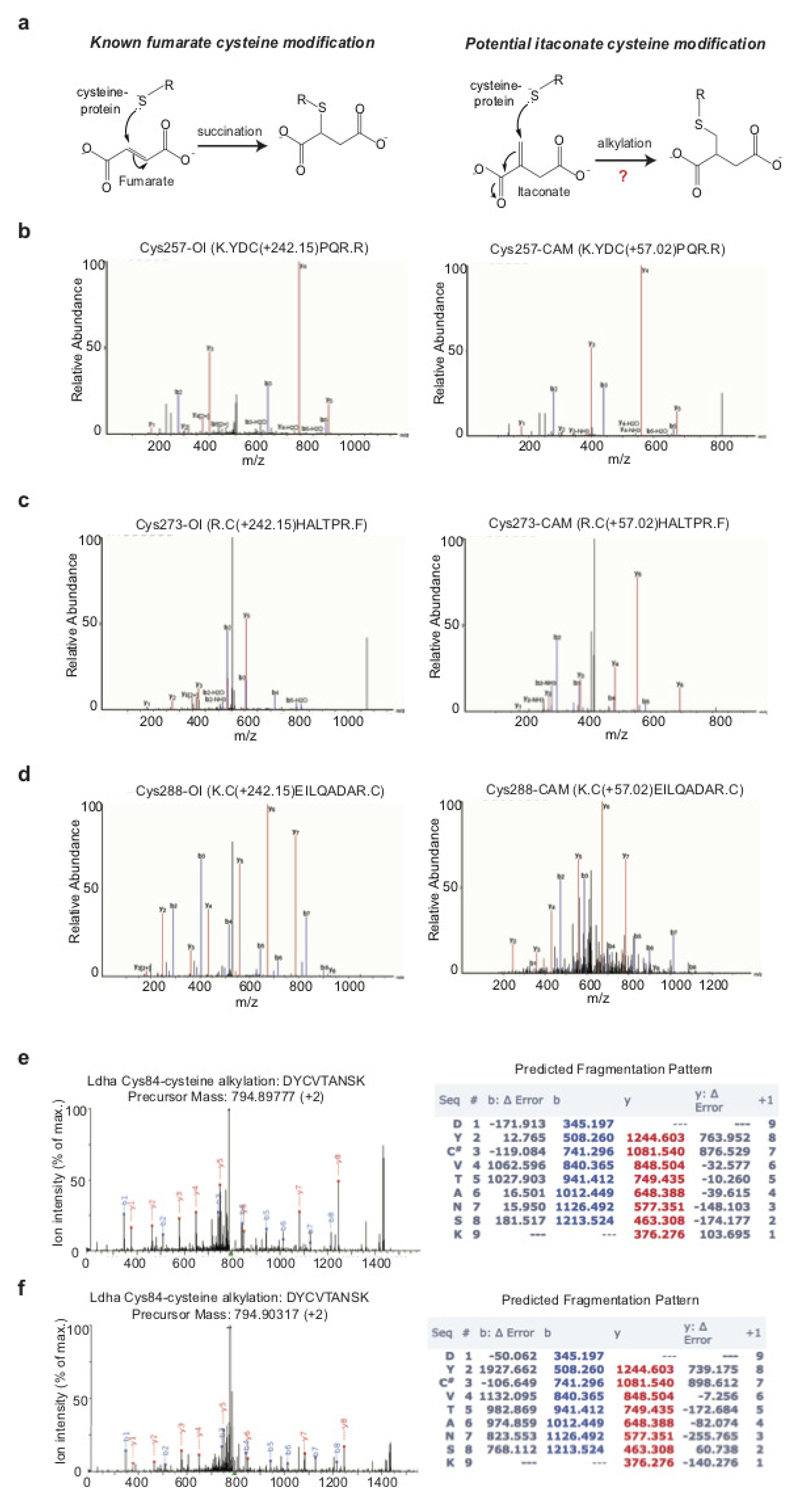
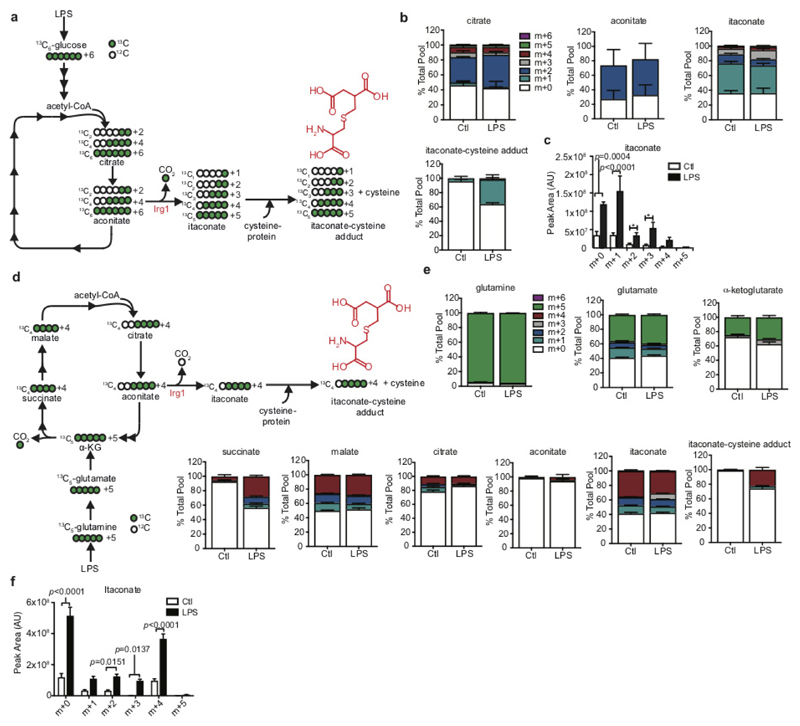
Our hypothesis is that itaconate activates Nrf2 by alkylation of KEAP1 cysteine residue(s)13–15, similar to the modification of cysteines by fumarate (Extended Data Fig. 5a). Cysteine 151 (Cys151) is a principal sensor on KEAP1 for sulforaphane16 and DMF17. OI stabilized V5-tagged Nrf2 (Nrf2–V5) in COS1 cells co-expressing wild-type KEAP1 but not a Cys151Ser mutant, similarly to sulforaphane (Fig. 2b, compare lanes 16 and 17 to lanes 18 and 19). To analyse KEAP1 alkylation directly, we overexpressed Myc-DDK-tagged KEAP1 in human HEK293T cells and treated the cells with OI. Tandem mass spectrometry of immunoprecipitated KEAP1 revealed that for the KEAP1 peptide (144–152), which contains Cys 151, OI treatment increased its mass by 242.15 Da, consistent with alkylation by OI (Fig. 2c). OI also modified other known KEAP1 regulatory cysteine residues (Cys257, Cys288 and Cys273) (Extended Data Fig. 5b–d, Extended Data Table 1a). Furthermore, itaconate-cysteine adducts, derived in part from glucose and glutamine (Fig. 2d and Extended Data Fig. 6), were detected in LPS-treated macrophages. These data suggest that itaconate activates Nrf2 by alkylating KEAP1 cysteine residues. We further explored cysteine alkylation induced by itaconate using an untargeted mass spectrometry approach in macrophages treated with OI, or with LPS, which increases itaconate levels. We identified several proteins that contain alkylated cysteine residues (Extended Data Table 1b, c). Notably LDHA, which has a crucial role in the regulation of glycolysis, was alkylated in OI- and LPS-treated macrophages (Fig. 2e and Extended Data Fig. 5e, f). This modification, here defined as 2,3-dicarboxypropylation, generates a stable thioether. As there are no known pathways for the removal of such post-translational modifications, modified proteins are probably degraded, suggesting that this modification will have profound effects on macrophage function.
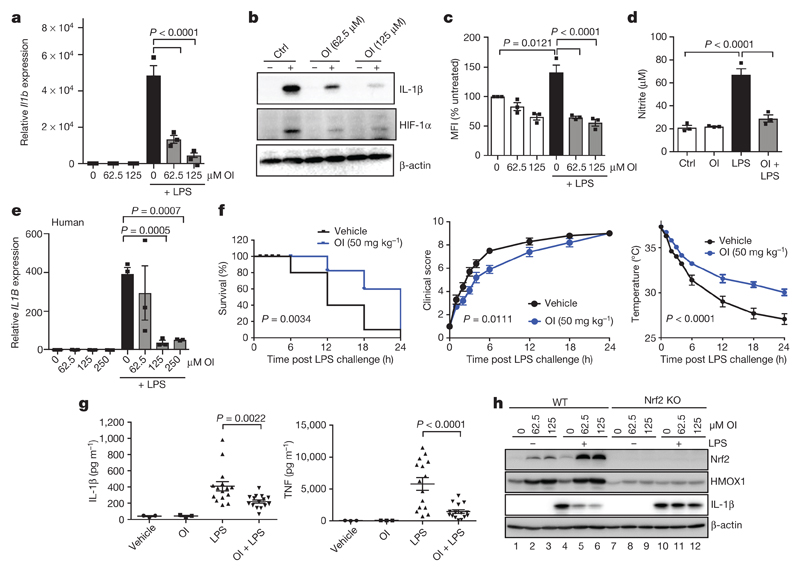
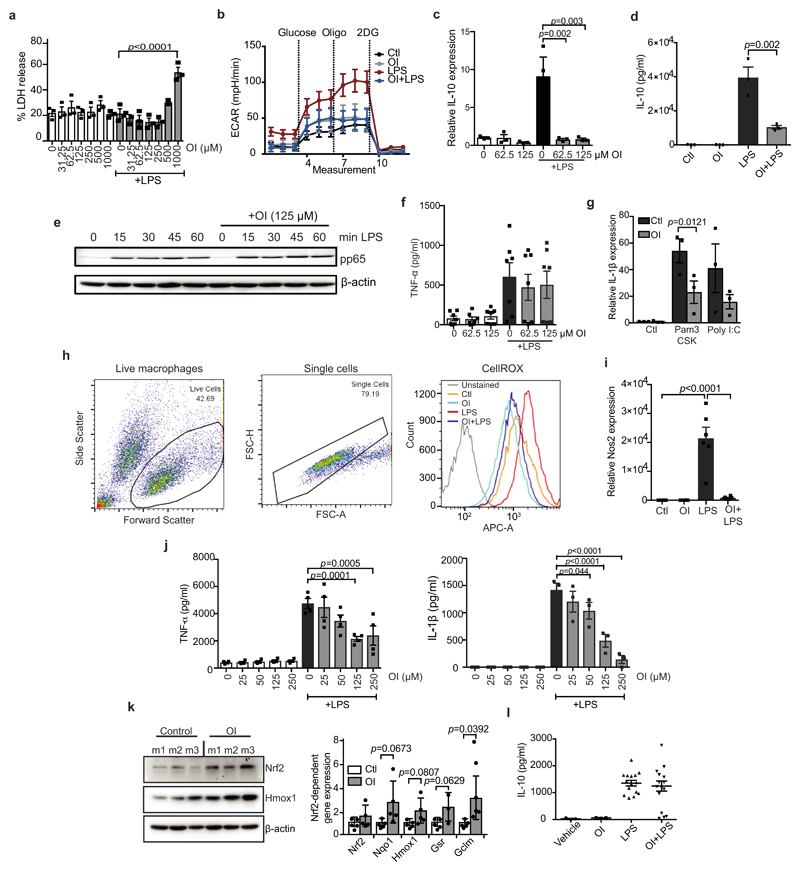
We next assessed whether itaconate activation of Nrf2 could be anti-inflammatory. OI, used at concentrations that did not affect cellular viability, decreased LPS-induced Il1b mRNA, pro-IL-1β, HIF-1α and IL-10 protein levels, and decreased the extracellular acidification rate, yet had no effect on NF-κB activity or TNF (also known as TNFα) levels (Fig. 3a, b and Extended Data Fig. 7a–f). OI also decreased Il1b mRNA in BMDMs treated with the TLR2 and TLR3 ligands, Pam3CSK and polyinosinic:polycytidylic acid (poly(I:C)), respectively (Extended Data Fig. 7g). Levels of LPS-induced reactive oxygen species (ROS), nitrite and inducible nitric oxide synthase (iNOS) were limited by OI (Fig. 3c, d and Extended Data Fig. 7h, i). These effects are likely to be a consequence of ROS detoxification after Nrf2 induction by OI. IL-1β and TNF were decreased by OI in human peripheral blood mononuclear cell (PBMCs) (Fig. 3e, Extended Data Fig. 7j). OI also counteracted the pro-inflammatory response to LPS in vivo. OI, which activated Nrf2 (Extended Data Fig. 7k), prolonged survival, decreased clinical score and improved body temperature regulation, and decreased IL-1β and TNF levels but not IL-10 in an LPS model of sepsis (Fig. 3f, g and Extended Data Fig. 7l).
Figure 3. OI limits IL-1β in an Nrf2-dependent manner and protects against LPS lethality.
a–d, LPS (24 h) induced Il1b mRNA (a, n = 3), IL-1β and HIF-1α protein (b), ROS production (c, n = 3; measured as the percentage change in mean fluorescent intensity (MFI) relative to untreated control) and nitrite production (d, n = 3) ± OI. e, IL1B mRNA in human PBMCs treated as in a–d (n = 3). f, Survival (left), clinical score (middle) and body temperature (right) measurements in mice (n = 10) injected intraperitoneally with OI (50 mg kg−1, 2 h) and LPS (15 mg kg−1). g, Serum IL-1β and TNF levels from mice injected intraperitoneally with OI (50 mg kg−1, 2 h) and/or LPS (2.5 mg kg−1, 2 h, n = 3 vehicle, OI; n = 15 LPS, OI plus LPS). h, Nrf2, HMOX1 and IL-1β protein in wild-type and Nrf2 knockout (KO) mouse BMDMs treated with LPS (6 h) and OI as indicated. Data are mean ± s.e.m. P values calculated using one-way ANOVA. Blots are representative of three independent experiments. For gel source data, see Supplementary Fig. 1.
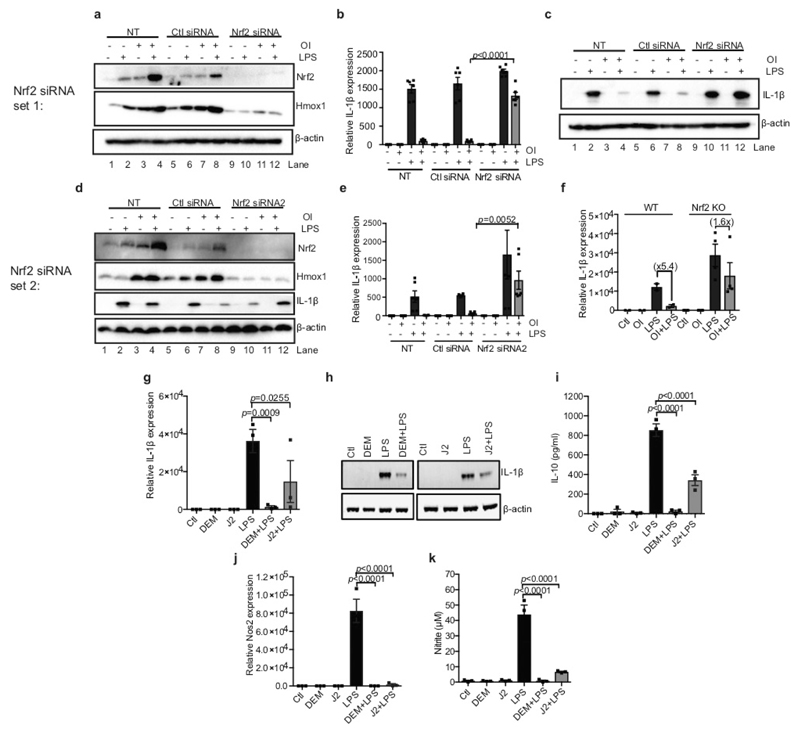
OI induction of HMOX1 was blocked in Nrf2-deficient macrophages (Fig. 3h (compare lanes 2 and 3 to lanes 8 and 9) and Extended Data Fig. 8a, d) or when Nrf2 was silenced (Extended Data Fig. 8a, d (compare lanes 7 and 8 to lanes 11 and 12)). Without Nrf2, the decrease in LPS-induced IL-1β with OI was significantly impaired (Fig. 3h (compare lane 6 to lane 12), Extended Data Fig. 8b–f (compare lanes 6 and 8 to 10 and 12 in c, d)). Furthermore, two Nrf2 activators, diethyl maleate and 15-deoxy-Δ12,14-prostaglandin J2 decreased LPS-induced IL-1β, IL-10, nitric oxide synthase (NOS2) and nitrite (Extended Data Fig. 8g–k). Thus, itaconate activates an anti-inflammatory program through Nrf2.
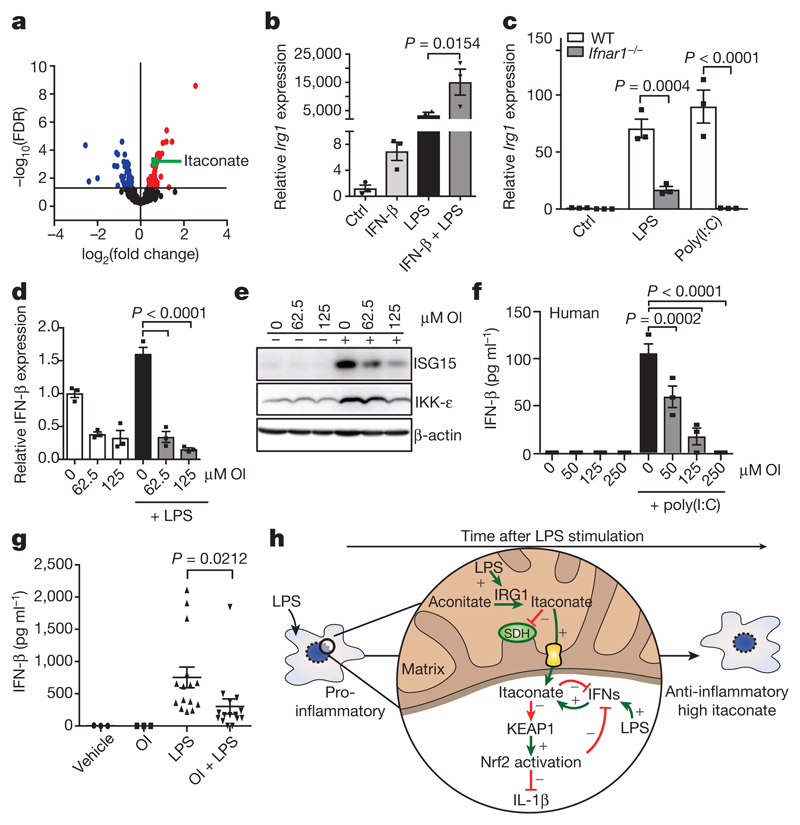
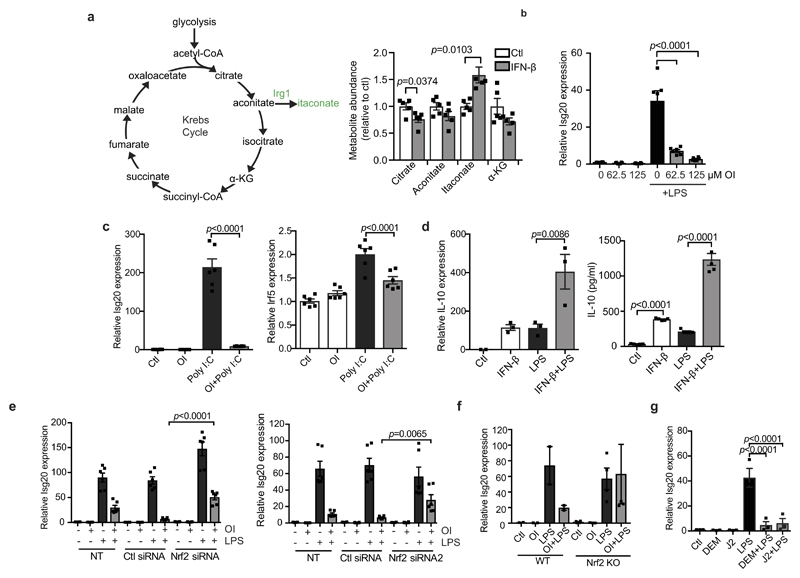
We next investigated how switching from a pro- to an anti-inflammatory state might affect itaconate production from aconitate by IRG1. By modelling gene networks that control Irg1 expression, the IFN response factor IRF1 was identified as a regulator18. We show here that itaconate levels are increased after IFN-β treatment (Fig. 4a), in agreement with others19. Levels of citrate and aconitate, the substrate for Irg1, were reduced by IFN-β as was the downstream metabolite α-ketoglutarate (Extended Data Fig. 9a). These data are consistent with an increase in aconitate conversion to itaconate rather than α-ketoglutarate. IFN-β enhanced basal and LPS-induced Irg1 expression (Fig. 4b). LPS- and poly(I:C)-induced Irg1 expression in BMDMs lacking type I IFN receptor was decreased (Fig. 4c), indicating that autocrine IFN facilitates IRG1 induction. OI limited the IFN response, decreasing the expression of IFN-β, IKK-ε, ISG20 and ISG15 protein, IFN-β production in poly(I:C)-treated PBMCs and LPS-induced IFN-β production in vivo (Fig. 4d–g and Extended Data Fig. 9b, c). IFN-β enhanced both the mRNA and protein expression of IL-10, with or without the addition LPS (Extended Data Fig. 9d), suggesting that the decrease in IL-10 after OI treatment is due to reduced type I IFN production20. Nrf2 knockout or knockdown attenuated the reduction of ISG20 expression by OI, whereas the Nrf2 activators diethyl maleate and 15-deoxy-Δ12,14-prostaglandin J2 reduced ISG20 expression (Extended Data Fig. 9e–g). This agrees with increased expression of IRF3-regulated genes in LPS-treated Nrf2-deficient mice21.
Figure 4. A feedback loop exists between itaconate and IFN-β.
a, Metabolite levels in control versus IFN-β-treated (1,000 U ml−1; 27 h; n = 5) mouse macrophages. b, LPS-induced (24 h) Irg1 expression ± IFN-β (1,000 U ml−1; n = 3). c, Irg1 expression in wild-type and IFN receptor-deficient (Ifnar1−/−) BMDMs plus LPS or poly(I:C) (40 μg ml−1) for 24 h (n = 3). d, IFN-β (n = 3) expression plus LPS (24 h) and OI as indicated. e, ISG15 and IKK-ε expression after treatment with LPS (24 h) and OI. f, IFN-β protein expression in PBMCs treated with poly(I:C) (20 μg ml−1; 24 h) and OI (n = 3) as indicated. g, Serum IFN-β levels from mice injected intraperitoneally with OI (50 mg kg−1, 2 h) with or without LPS (2.5 mg kg−1; 2 h) (n = 3 vehicle, OI; n = 15 LPS, OI and LPS). h, The anti-inflammatory role of itaconate. Data are mean ± s.e.m. P values calculated using one-way ANOVA. Blots are representative of three independent experiments. Data in f are representative from one of two human donors. For gel source data, see Supplementary Fig. 1.
These data suggest the operation of a negative-feedback loop: itaconate is generated in response to LPS, in part through type I IFNs, and promotes an anti-inflammatory program by Nrf2 activation (Fig. 4h), as well as SDH inhibition3,22. This limits further inflammatory gene expression and its own production by downregulating the IFN response. This helps to explain why Nrf2-deficient mice are more sensitive to septic shock21, even though under certain circumstances these mice are protected from inflammation23. Our identification of itaconate as an inflammatory regulator, that directly modifies proteins through a newly identified post-translational modification, unveils therapeutic opportunities to use itaconate or OI to treat inflammatory diseases24. Furthermore, an intriguing link was recently made25 from itaconate to vitamin B12, and this warrants further investigation in the context of inflammation and immunity. Further understanding the role of itaconate as an anti-inflammatory metabolite and regulator of type I IFNs is likely to yield new insights into the pathogenesis of inflammatory diseases.
Methods
Isolation of human PBMCs
Human PBMCs were isolated from human blood using Lymphoprep (Axis-Shield). Whole blood (30 ml) was layered on 20 ml lymphoprep and spun for 20 min at 2,000 r.p.m. with no brake on. The PBMCs were isolated from the middle layer. PBMCs were maintained in RPMI supplemented with 10% (v/v) FCS, 2 mM l-glutamine, and 1% penicillin/streptomycin solution.
Generation of human macrophages
Blood was layered on Histopaque and centrifuged at 800g for 20 min, acceleration 9, and deceleration at 4. The PBMC layer was isolated and the macrophages were sorted using magnetic-activated cell sorting (MACS) CD14 beads. Cells were plated at 0.5 × 10⁶ cells ml−1 in media containing M-CSF (100 ng ml−1) and maintained at 37 °C, 5% CO2 for 5 days, to allow differentiation into macrophages. For further details, see Supplementary Methods.
Generation and treatment of BMDMs
Mice were euthanized in a CO2 chamber and death was confirmed by cervical dislocation. Bone marrow cells were extracted from the leg bones and differentiated in DMEM (containing 10% fetal calf serum, 1% penicillin/streptomycin and 20% L929 supernatant) for 6 days, at which time they were counted and replated for experiments. Unless stated, 5 × 10⁶ BMDMs per millilitre were used in in vitro experiments. Unless stated, the LPS concentration used was 100 ng ml−1, the DMI and OI concentration was 125 μM, and in experiments where pre-treatments occurred before LPS stimulation this was for 3 h.
Synthesis of itaconate compounds
For details on synthesis and characterization of chemical compounds, see Supplementary Methods.
Metabolomic analysis with Metabolon
Macrophages were plated at 2 × 10⁶ per well in 6-well plates and treated as required. BMDMs n = 5, human macrophages n = 12. Analysis was performed by Metabolon. For further details, see Supplementary Methods.
Metabolite measurements for absolute succinate and itaconate quantification and metabolite tracing
Cells were treated as desired. For tracing studies, immediately before LPS stimulation, the media was removed and replaced with DMEM media (1 ml) containing U-13C-glucose (4.5 g l−1) or U-13C-glutamine (584 mg ml−1) deplete of 12C-glucose or 12C-glutamine. Samples were extracted in methanol/acetonitrile/water, 50:30:20 (v/v/v) (1 ml per 1 × 10⁶ cells) and agitated for 15 min at 4 °C in a Thermomixer and then incubated at −20 °C for 1 h. Samples were centrifuged at maximum speed for 10 min at 4 °C. The supernatant was transferred into a new tube and centrifuged again at maximum speed for 10 min at 4 °C. The supernatant was transferred autosampler vials. Liquid chromatograph–mass spectrometry (LC–MS) analysis was performed using a Q Exactive mass spectrometer coupled to a Dionex U3000 UHPLC system (Thermo). For further details, see Supplementary Methods.
Western blotting
Protein samples from cultured cells were prepared by direct lysis of cells in 5× Laemmli sample buffer, followed by heating at 95 °C for 5 min. For spleen samples, 30 mg of spleen was homogenized in RIPA buffer using the Qiagen TissueLyserII system. The resulting homogenate was centrifuged at 14,000 r.p.m. for 10 min at 4 °C, and supernatants were used for SDS–PAGE. Protein samples were resolved on 8% or 12% SDS–PAGE gels and were then transferred onto polyvinylidene difluoride (PVDF) membrane using either a wet or semi-dry transfer system. Membranes were blocked in 5% (w/v) dried milk in TBS-Tween (TBST) for at least 1 h at room temperature. Membranes were incubated with primary antibody, followed by the appropriate horseradish peroxidase-conjugated secondary antibody. They were developed using LumiGLO enhanced chemiluminescent (ECL) substrate (Cell Signalling). Bands were visualized using the GelDoc system (Biorad).
Quantitative PCR
Total RNA was isolated using the RNeasy Plus Mini kit (Qiagen) and quantified using a Nanodrop 2000 UV-visible spectrophotometer. cDNA was prepared using 20–100 ng μl−1 total RNA by a reverse transcription PCR (RT–PCR) using a high capacity cDNA reverse transcription kit (Applied Biosystems), according to the manufacturer’s instructions. Quantitative PCR (qPCR) was performed on cDNA using SYBR Green probes. qPCR was performed on a 7900 HT Fast Real-Time PCR System (Applied Biosystems) using Kapa fast master mix high ROX (Kapa Biosystems, for SYBR probes) or 2× PCR fast master mix (Applied Biosystems, for Taqman probes). For SYBR primer pair sequences, see Supplementary Methods. Fold changes in expression were calculated by the ΔΔCt method using mouse Rps18 as an endogenous control for mRNA expression. All fold changes are expressed normalized to the untreated control.
NQO1 bioassay
Inducer potency was quantified by use of the NQO1 bioassay in Hepa1c1c7 mouse hepatoma cells11,12. Cells (104 per well of a 96-well plate) were grown for 24 h and exposed (n = 8) to serial dilutions of compounds for 48 h before lysis. NQO1 enzyme activity was quantified in cell lysates using menadione as a substrate. Protein concentrations were determined in aliquots from the same cell lysates by the bicinchoninic acid (BCA) assay (Thermo Scientific). The CD value was used as a measure of inducer potency. For assays examining the effect of GSH on inducer potency, 50 μM of each compound was incubated with 1 mM GSH in the cell culture medium at 37 °C for 30 min before treatment.
Preparation of rat liver mitochondria
Female Wistar rats aged between 10 and 12 weeks (Charles River) were culled by stunning and cervical dislocation before the liver being excised and stored in ice-cold buffer (STE buffer; 250 mM sucrose, 5 mM Tris-Cl, 1 mM EGTA (pH 7.4 at 4 °C)). Rat liver mitochondria were isolated by homogenization and differential centrifugation at 4 °C in STE buffer26. In brief, minced tissue was homogenized in STE buffer before centrifugation (1,000g, 3 min, 4 °C) and centrifuging the resulting supernatant (10,000g, 10 min, 4 °C). The mitochondrial pellet was resuspended in fresh STE before centrifuging (10,000g, 10 min, 4 °C). The resulting pellet was resuspended in STE and assayed for protein concentration via BCA assay (Thermo Scientific) against a BSA standard curve.
Preparation of bovine heart mitochondrial membranes
Bovine heart mitochondria were isolated by differential centrifugation in 250 mM sucrose, 10 mM Tris-Cl, 0.2 mM EDTA (pH 7.8 at 4 °C). To prepare membranes, bovine heart mitochondria were blended with MilliQ water at 4 °C before adding KCl to a final concentration of 150 mM and blending until homogenous. The suspension was centrifuged (13,500g, 40 min, 4 °C) and the pellet was resuspended in re-suspension buffer (20 mM Tris-Cl, 1 mM EDTA, 10% glycerol, pH 7.55 at 4 °C) before homogenization and assaying for protein by BCA assay (Thermo Scientific)27.
Measuring complex II and III activity
Bovine heart mitochondrial membranes (80 μg protein per ml) were incubated in 50 mM potassium phosphate buffer (50 mM potassium phosphate, 1 mM EDTA, pH 7.4, 4 °C) supplemented with 3 mM KCN, 4 μM rotenone and succinate. In a 96-well microplate, inhibitor or vehicle control and membrane incubation were plated and incubated for 10 min at 30 °C. Alternatively, where indicated, itaconate was incubated with membranes and removed by twice centrifuging membranes and resuspending in non-itaconate containing buffer, before plating with 1 mM succinate. Oxidized cytochrome-c was added before measuring the respiratory chain activity by assessing the reduction of cytochrome-c spectrophotometrically at 550 nm at 20 s intervals for 5 min at 30 °C. Final concentrations were 10 μg protein per well bovine heart membranes and 30 μM ferricytochrome c.
Measuring rat liver mitochondrial respiration
Respiration of rat liver mitochondria was assessed with an Oxygraph-2K (OROBOROS instruments high resolution respirometry). Rat liver mitochondria (0.5 mg mitochondrial protein per ml) were added to KCl buffer (pH 7.2, 37 °C) and respiration assessed in the presence of 4 μg ml−1 rotenone, 1 mM succinate, 1 μM FCCP and inhibitors or buffer control.
Assessing itaconate ester reactivity with glutathione
GSH (1 or 5 mM) and 5 mM itaconate esters or vehicle control were incubated in KCl buffer (pH 7.2 or 8) at 37 °C for 2 h, where indicated, 10 μg recombinant GST was added to the incubation. The reaction was stopped by acidification with 5% sulfosalicylic acid before assessing glutathione content by the GSH recycling assay as described previously28.
Itaconate transport assays
Itaconate transport by mitochondrial carriers was assessed as described previously29. For further details see Supplementary Methods.
Cell uptake of itaconate
C2C12 mouse myoblasts were plated at 300,000 cells per well in a 6-well plate in complete growth medium and adhered overnight in a humidified 5% CO2, 37 °C incubator. The following day, media was replaced with serum-free DMEM containing itaconate esters and cells were treated for 30 min at 37 °C. Cells were extracted as described above (method for succinate quantification), with MS internal standard (100 pmol) added and stored at −80 °C before LC–MS/MS analysis. For further details, see Supplementary Methods.
LC–MS/MS analysis was performed using an LCMS-8060 mass spectrometer (Shimadzu) with a Nexera X2 UHPLC system (Shimadzu). For further details, see Supplementary Methods.
KEAP1 cysteine target validation
COS1 cells (2.5 × 10⁵ per well) in 6-well plates were co-transfected (Lipofectamine 2000) with 0.8 μg of Nrf2-V5 and 1.6 μg of wild-type or Cys151S mutant KEAP114, or 1.6 μg of pcDNA. Cells were grown for 21 h then treated with 20 or 100 μM OI, 5 μM sulforaphane or 0.1% acetonitrile (vehicle) for 3 h. Cell were washed in PBS and lysed in 200 μl of SDS-lysis buffer (50 mM Tris-HCl, pH 6.8, 2% (w/v) sodium dodecyl sulfate (SDS) and 10% (v/v) glycerol). Lysates were sonicated (20 s at 30% amplitude using Vibra-Cell ultrasonic processor, Sonic) and boiled (3 min), and dithiothreitol (DTT) and Bromophenol blue were added up to 0.1 M and 0.02% (w/v) final concentrations, respectively. Proteins (10 μg) were resolved on a gradient (4–12%) NuPAGE SDS gel, transferred onto nitrocellulose membranes, and immunoblotted with anti-KEAP1 (rat monoclonal, Merk Millipore, clone 144), anti-Nrf2 (rabbit monoclonal, CST), and anti-β-actin (mouse monoclonal, Sigma) antibodies. Horseradish peroxidase (HRP)- or IRDye-labelled secondary antibodies were used interchangeably, followed by either ECL detection or scanning using Odyssey imager (Li-COR).
ELISA
Cytokine concentrations in cell supernatants were measured using ELISA Duoset kits for mouse IL-10 and TNF and human IFN-β and IL-1β, according to the manufacturer’s instructions. Cytokine concentrations in serum samples isolated from whole blood were measured using Quantikine ELISA kits for mouse or human IL-1β, IFN-β, IL-10 and TNF. Duoset and Quantikine kits were from R&D Systems. Optical density values were measured at a wavelength of 450 nm, using a FLUOstar Optima plate reader (BMG Labtech). Concentrations were calculated using a four-parameter fit curve.
FACS analysis of ROS
BMDMs were seeded at 0.5 × 10⁶ cells per ml and treated as normal. Then 2 h before staining, 100% ethanol was added to the dead cell control well. Thirty minutes before the end of the stimulation, CellROX (5 μM) was added directly into the cell culture medium. Supernatants of cells that were to be stained with Aqua Live/Dead were removed, and an Aqua Live/Dead dilution (1 ml; 1:1,000 in PBS) was added to each well. Cells were incubated in tinfoil at 37 °C for 30 min. Cells were washed with PSB, scraped in PBS (0.5 ml), and transferred to polypropylene FACS tubes. Samples were analysed using a DAKO CyAn flow cytometer, and data was analysed using FlowJo software. MFI was quantified as a measure of cellular ROS production.
Nitric oxide assay
Nitric oxide concentrations in cell supernatants were measured using Greiss reagent assay kit from Thermo Fischer Scientific according to the manufacturer’s instructions. Optical density values were measured at a wavelength of 548 nm, using a SoftMax Pro plate reader. Concentrations were calculated using a linear standard curve.
GSH/GSSG measurements
BMDMs were plated at 0.1 × 10⁶ cells per ml in opaque 96-well plates. Cells were pre-treated with OI (125 μM) for 2 h and then stimulated with hydrogen peroxide (100 μM) for 24 h. After 24 h, cell media was removed and the reduced glutathione to oxidized glutathione (GSH/GSSG) ratio was quantified using MyBio GSH/GSSG-Glo Assay (V6611) as per manufacturer’s instructions. Luminescence was quantified using a FLUOstar Optima plate reader.
LDH assay
Cells were plated at 0.5 × 10⁶ cells per ml in white 24-well plates (500 μl per well) and treated as required. Cytotoxicity, as determined by LDH release, was assayed using CytoTox96 Non-radioactive Cytotoxicity Assay kit (Promega) according to the manufacturer’s instructions.
Seahorse analysis of lactate production
Cells were plated at 0.2 × 10⁶ cells per well of a 24-well Seahorse plate. Cells were treated and stimulated as normal. A utility plate containing calibrant solution (1 ml per well) was placed in a CO2-free incubator at 37 °C overnight. The next day, media was removed from cells and replaced with glucose-supplemented XF assay buffer (500 μl per well) was placed in a CO2-free incubator for at least 0.5 h. Compounds (glucose, oligomycin and 2-deoxy-d-glucose (2DG); 70 μl) were added to the appropriate port of the injector plate. This plate together with the utility plate was run on the Seahorse for calibration. Once complete, the utility plate was replaced with the cell culture plate and run on the Seahorse XF-24.
Endotoxin-induced model of sepsis
For cytokine measurements, mice were treated intraperitoneally with OI (50 mg kg−1) in 40% cyclodextrin in PBS or vehicle control for 2 h before stimulation with LPS (Sigma; 2.5 mg kg−1) intraperitoneally for 2 h. Mice were euthanized in a CO2 chamber, blood samples were collected and serum was isolated. Cytokines were measured using R&D ELISA kits according to manufacturer’s protocol. For temperature recording, mice (n = 10 per group) were treated intraperitoneally with OI (50 mg kg−1) in 40% cyclodextrin in PBS or vehicle control for 2 h before stimulation with LPS (5 mg kg−1) and monitored for temperature at 1, 2, 3, 4, 6, 12, 18 and 24 h after LPS treatment. Temperature was monitored using subcutaneously implanted temperature transponder chips (Bio Medic Data Systems; IPTT 300) which were injected between the shoulder blades 48 h before experiment. At defined times, body temperature was measured by scanning the transponder with a corresponding BMDS Smart Probe. Animals were additionally monitored for clinical signs of endotoxic shock, based on temperature change, body condition, physical condition and unprovoked behaviour, with a combined score of 9 indicating the humane end point for the experiment.
siRNA transfection of BMDMs
Cells were plated at 1 × 10⁶ cells per ml in 12-well plates overnight. On the day of transfection, the media was replaced with 500 μl DMEM without penicillin/streptomycin or FBS. For each target gene, two Eppendorfs were prepared. Optimem (250 μl per well) was added to each tube. RNAimax (add 5 μl per well) was added to one set of tubes and short interfering siRNA (siRNA; 50 nM per well) was added to the second set of tubes. The tube containing the siRNA was added to the tube with RNAimax, mixed well by pipetting and incubated for 15 min. The mix (500 μl) was added to each well. Twenty-four hours after transfection, cells were treated as required.
Analysis of KEAP1 modification by OI
Human embryonic kidney cells (HEK293T cells) were transfected with a pCMV6-KEAP1 vector (Myc-DDK-tagged mouse KEAP1) (OriGene). C2C12, Hepa1c1c7 cells and COS1 cells were from American Type Culture Collection (ATCC). The L929 cells are from Sigma (85011425). HEK293T cells were obtained from the Centre for Applied Microbiology and Research. Cell lines have not been tested for mycoplasma contamination. Twenty-four hours after transfection, cells were treated with OI (500 μM) or vehicle control (PBS) for 4 h. Tagged KEAP1 was immunoprecipitated using an anti-Flag antibody (Sigma) and protein A/G beads (Santa Cruz). After immunoprecipitation, bound KEAP1 was eluted off the beads using Flag peptide (500 μl; 200 μg ml−1) (Sigma) diluted in 1× TBS pH 7.4. The samples were then concentrated and the Flag peptide was removed using 10K centrifugation filter columns (Merck). The concentrated samples were then divided in half for downstream processing. One-half of each sample was diluted 1:2 with 5× SDS sample buffer and separated using SDS–PAGE (Bio-Rad). Overexpressed KEAP1 was detected using Coomassie blue staining and the corresponding bands were excised from the gel and subjected to in-gel digest as described. In brief, the gel slices were cut into smaller pieces (1–2 mm3) before reduction with DTT (10 mM) and alkylation with iodoacetamide (50 mM). Half of the gel slices from each sample were then subjected to a trypsin (2 μg) digest, the other half were digested with elastase (1 μg) overnight at 37 °C. Similarly, the remaining sample concentrates (in solution) were reduced with DTT and alkylated with iodoacetamide, before precipitation of the protein via the methanol–chloroform extraction method. The protein pellet was re-suspended in urea (6 M), which was then diluted to <1 M urea with ultrapure H2O. The samples were then digested with trypsin (2 μg) overnight at 37 °C. Digested protein samples were analysed in an Orbitrap Fusion Lumos coupled to a UPLC ultimate 3000 RSLCnano System (both Thermo Fisher). For further details, see Supplementary Methods.
Assessment of cysteine alkylation by itaconate using Iodo-TMT
After treatment, cells were lysed in HEPES pH 7.5, EDTA, glycerol and NP40. 2 mM TCEP and 50 mM NEM were added in a buffer containing 50 mM HEPES, 2% SDS, 125 mM NaCl, pH 7.2, and samples were incubated for 60 min at 37 °C in the dark to reduce and alkylate all unmodified protein cysteine residues. 20% (v/v) TCA was added to stabilize thiols and incubated overnight at 4 °C and then pelleted for 10 min at 4,000g at 4 °C. The pellet was washed three times with cold methanol (2 ml) and then resuspended in 2 ml 8 M urea containing 50 mM HEPES, pH 8.5. Protein concentrations were measured by BCA assay (Thermo Scientific) before protease digestion. Protein lysates were diluted to 4 M urea and digested with LysC (Wako) in a 1:100 enzyme:protein ratio and trypsin (Promega) at a final 1:200 enzyme:protein ratio for 4 h at 37 °C. Protein extracts were diluted further to a 2.0 M urea and LysC (Wako) at 1:100 enzyme:protein ratio and trypsin (Promega) at a final 1:200 enzyme:protein ratio were added again and incubated overnight at 37 °C. Protein extracts were diluted further to a 1.0 M urea concentration, and trypsin (Promega) was added to a final 1:200 enzyme:protein ratio for 6 h at 37 °C. Digests were acidified with 250 μl of 25% acetic acid to a pH value of ~2, and subjected to C18 solid-phase extraction (50 mg Sep-Pak, Waters). Excess TMT label (6–7 M) was added to each digest for 30 min at room temperature (repeated twice). The reaction was quenched using 4 μl 5% hydroxylamine. Samples were subjected to an additional C18 solid-phase extraction (50 mg Sep-Pak). For LC–MS/MS parameters, data processing and MS2 spectra assignment, TMT reporter ion intensities and quantitative data analysis, see Supplementary Methods.
Reagents
For a complete list of reagents, see Supplementary Methods.
Mouse strains
Wild-type C57BL/6 mice were from Harlan UK and Harlan Netherlands. Animals were maintained under specific pathogen-free conditions in line with Irish and European Union regulations. Experiments were approved by local ethical review and were carried out under the authority of Ireland’s project license. All animal studies performed in GSK were ethically reviewed and carried out in accordance with Animals (Scientific Procedures) Act 1986 and the GSK Policy on the Care, Welfare and Treatment of Animals. Nrf2-deficient mice and their wild-type counterparts, both on the C57BL/6 genetic background (used for isolation of BMDM cells), were bred and maintained in the Medical School Resource Unit of the University of Dundee.
Statistical analysis
Data were expressed as mean ± s.e.m. and P values were calculated using two-tailed Student’s t-test for pairwise comparison of variables, one-way ANOVA for multiple comparison of variables, and two-way ANOVA involving two independent variables. A Sidak’s multiple comparisons test was used. A confidence interval of 95% was used for all statistical tests. Sample sizes were determined on the basis of previous experiments using similar methodologies. For all experiments, all stated replicates are biological replicates. For in vivo studies, mice were randomly assigned to treatment groups. For mass spectrometry analyses, samples were processed in random order and experimenters were blinded to experimental conditions.
Extended Data
Extended Data Figure 1. The effect of itaconate on complex II activity.
a, Complex II and III activity in bovine heart mitochondrial membranes incubated with succinate plus malonate or itaconate (n = 3 independent experiments). b, Effect of malonate or itaconate on the oxygen consumption rate (OCR) of rat liver mitochondria in the presence of succinate (1 mM) and FCCP (1 μM; n = 3 independent experiments). c, d, Complex II and III activity in bovine heart mitochondrial membranes incubated with itaconate (IA; 1 mM unless indicated), with subsequent removal and addition of succinate (1 mM; n = 3 independent experiments) (see Methods for further details). Data are mean ± s.e.m. P values calculated using one or two-way ANOVA.
Extended Data Figure 2. DMI activates Nrf2 and limits cytokine production.
a, c, LPS (100 ng ml−1)-induced Nrf2 (a, 24 h) and HMOX1 (c, 6 h) protein expression with or without the itaconate derivative DMI. b, Nrf2-dependent mRNA expression after treatment with LPS (6 h) and DMI where indicated (n = 3). d, Reduced glutathione (GSH) and oxidized glutathione (GSSG) levels after treatment with LPS and DMI (n = 5). e, f, LPS (24 h)-induced Il1b mRNA (e), IL-1β and HIF-1α protein (f) expression in mouse macrophages with or without DMI (n = 3). Data are mean ± s.e.m. P values calculated using one-way ANOVA. Blots are representative of three independent experiments. For gel source data, see Supplementary Fig. 1.
Extended Data Figure 3. OI is the best tool to assess itaconate-dependent Nrf2 activity.
a, Reactivity of DMI, itaconate and OI with thiols. b, c, Itaconate ester reactivity with GSH and glutathione-S-transferase (GST) as detailed in the Methods (n = 3). d, Itaconate levels in mouse C2C12 cells plus itaconate esters (n = 3). MI, 4-methyl itaconate. e, i, Itaconate (e) or GSH (i) levels plus LPS (6 h) and OI as indicated (n = 5). f, NQO1 activity in mouse Hepa1c1c7 cells treated with DMI or OI (48 h) and GSH (n = 8). g, h, Metabolic intermediates in GSH synthesis (h, average of five biological replicates). i, GSH levels after treatment with LPS (6 h) and/or OI (n = 5). j, GSH/GSSG ratio after treatment with OI (2 h) and H2O2 (100 μM, 24 h; n = 3) as indicated. k, HMOX1 protein levels after treatment with OI and/or H2O2 (24 h). l, Nrf2, HMOX1 and IL-1β protein levels in BMDMs pre-treated with OI, 4-octyl 2-methylsuccinate (OMS) or octyl succinate (OS), all 125 μM for 3 h with or without LPS (6 h). m, LPS-induced Nrf2 (24 h) and HMOX1 (6 h) protein expression with or without dimethyl malonate (DMM). Data are mean ± s.e.m. P values calculated using one- or two-way ANOVA. Blots are representative of three independent experiments. For gel source data, see Supplementary Fig. 1.
Extended Data Figure 4. Itaconate is transported by the mitochondrial oxoglutarate, dicarboxylate and citrate carriers.
a, Itaconate uptake into vesicles of Lactococcus lactis membranes expressing the indicated carriers loaded with itaconate (1 mM), and transport initiated by the addition of [3H]itaconate (1 μM). b, Initial transport rates of each carrier with either canonical substrate (homo-exchange) or canonical substrate/itaconate (hetero-exchange). n = 4 independent experiments; data are mean ± s.d. P values calculated using two-tailed Student’s t-test.
Extended Data Figure 5. KEAP1 is alkylated by OI on major redox sensing cysteine residues.
a, Modification of cysteine by fumarate or itaconate. Tandem mass spectrometry spectrum of KEAP1 Cys257 (b), Cys257 (c) and Cys288 (d) peptides, indicating alkylation of these sites after OI treatment (left) but not in the corresponding carbamidomethylated (CAM) peptides (right). e, f, LDHA Cys84 alkylation after treatment with LPS (e, 24 h) or OI (f, 250 μM, 4 h) (n = 4). Detected N- and C-terminal fragment ions of both peptides are assigned in the spectrum and depicted as follows: b: N-terminal fragment ion; y: C-terminal fragment ion; asterisk: fragment ion minus NH3; 0 or asterisk: fragment ion minus H2O; and 2+: doubly charged fragment ion. Representative of one independent experiment.
Extended Data Figure 6. Identification of an itaconate-cysteine adduct.
a–e, 13C6-glucose (a–c) or 13C5-glutamine (d, e) labelling experiment tracking itaconate-cysteine adduct formation in BMDMs treated with LPS (n = 5; 24 h). Data in b and e are expressed as the percentage isotopologue of the total pool. Data in c and f represent changes in the total pool after LPS treatment. Data are mean ± s.e.m., for five replicates. P values calculated using two-way ANOVA.
Extended Data Figure 7. OI decreases LPS-induced cytokine production, extracellular acidification rate, ROS and nitric oxide.
a, Percentage cytotoxicity (LDH release) in BMDMs after treatment with LPS and OI as indicated (n = 3). b, LPS-induced extracellular acidification rate (ECAR) after treatment with OI and/or LPS as indicated, analysed on the Seahorse XF-24 in BMDMs (trace representative of three independent experiments). c, d, LPS-induced Il10 mRNA (c, 4 h) and protein (d, 24 h) and TNF protein (f; n = 7) after OI treatment as indicated (n = 3). e, Phosphorylated p65 (pp65) protein levels (a measure of NF-κB activity) after treatment with LPS and OI as indicated. h, Representative gating strategy for FACS analysis of ROS production in cells as treated in d (image representative of three independent experiments). i, LPS-induced NOS2 expression (n = 6), with or without OI treatment. j, LPS-induced TNF (n = 4) and IL-1β (n = 3) protein levels after OI treatment in PBMCs. k, Nrf2 and HMOX1 protein levels or Nrf2-dependent gene expression (n = 5) in peritoneal macrophages from mice (m) injected intraperitoneally with OI (50 mg kg−1, 6 h) or vehicle control. l, Serum IL-10 from mice injected intraperitoneally with vehicle control or OI (50 mg kg−1, 2 h) and LPS (2.5 mg kg−1, 2 h, n = 3 vehicle, OI; n = 15 LPS, OI plus LPS). Data are mean ± s.e.m. P values calculated using one-way ANOVA. Blots are representative of three independent experiments. For gel source data, see Supplementary Fig. 1.
Extended Data Figure 8. The effects of OI on cytokine production are Nrf2-dependent.
a–e, Nrf2, HMOX1 and IL-1β protein levels (a, c, d) and Il1b mRNA expression (b, e) in mouse BMDMs transfected with two different Nrf2 siRNAs (50 nM) compared with a non-silencing scrambled control siRNA plus LPS (6 h; a–c, e; 24 h; d) and/or OI (n = 6). NT, non-transfected. f, Il1b mRNA expression in wild-type and Nrf2-knockout BMDMs treated with LPS (24 h; WT n = 2, Nrf2 KO n = 4) and/or OI. g–k, Il1b (g) and Nos2 (j) mRNA, and IL-1β (h), IL-10 (i), TNF and nitrite (k) production with or without LPS (24 h), diethyl maleate (DEM; 100 μM) or 15-deoxy-Δ12,14-prostaglandin J2 (J2; 5 μM) pre-treatment for 3 h (n = 3). Data are mean ± s.e.m. P values calculated using one-way ANOVA. Blots are representative of three independent experiments. For gel source data, see Supplementary Fig. 1.
Extended Data Figure 9. An Nrf2-dependent feedback loop exists between itaconate and IFN-β.
a, Metabolite levels after treatment with IFN-β (1,000 U ml−1; 27 h; n = 5). b, c, Isg20 and Irf5 mRNA expression in BMDMs treated with LPS (b) or poly(I:C) (c, 40 μg ml−1; 24 h) and/or OI (n = 6). d, Il10 mRNA (n = 3) and IL-10 protein (n = 5) expression after treatment with LPS for 4 h (left) or 24 h (right) and/or IFN-β treatment (1,000 U ml−1) for 3 h. e, Isg20 expression in BMDMs transfected with two different Nrf2 siRNAs (50 nM) compared with non-silencing control plus LPS (6 h) and/or OI (n = 6). f, Isg20 mRNA expression in wild-type (n = 2) and Nrf2-knockout (n = 4) BMDMs plus LPS (6 h) and/or OI. g, Isg20 mRNA expression after pre-treatment with LPS (24 h) and/or diethyl maleate (100 μM) or 15-deoxy-Δ12,14-prostaglandin J2 (5 μM) for 3 h (n = 3). Data are mean ± s.e.m. P values calculated using one-way ANOVA.
Extended Data Table 1. Mass spectrometry analysis of itaconate-induced cysteine alkylation.
a, Cysteine/lysine residue(s) in KEAP1 modified by OI as determined by tandem mass spectrometry. b, Cysteine residues modified by itaconate in BMDMs treated with LPS identified using tandem mass spectrometry. c, Cysteine residues modified by itaconate in BMDMs treated with OI identified using tandem mass spectrometry.
| a | |||||
|---|---|---|---|---|---|
| 4-OI Residue | Peptide Amino Acid Position | Peptide Sequence | -10logP | Enzyme | Digest Type |
| Cys23 | 22-31 | S.KC(+242.15)PEGAGDAV.M | 31.47 | Elastase | In Gel |
| Cys151 | 144-152 | A.SISVGEKC(+242.15)V.L | 44.11 | Elastase | In Gel |
| 146-152 | I.SVGEKC(+242.15)V.L | 30.95 | |||
| 144-153 | A.SISVGEKC(+242.15)VL.H | 30.25 | |||
| 145-152 | S.ISVGEKC(+242.15)V.L | 29.32 | |||
| Cys257 | 254-260 | V.KYDC(+242.15)PQR.R | 35.44 | Elastase | In Gel |
| 255-260 | K.YDC(+242.15)PQR.R | 40.13 | Trypsin | In Gel | |
| 255-260 | K.YDC(+242.15)PQR.R | 41.08 | Trypsin | In Solution | |
| Cys273 | 273-279 | R.C(+242.15)HALTPR.F | 35.93 | Trypsin | In Gel |
| 273-279 | R.C(+242.15)HALTPR.F | 38.65 | Trypsin | In Solution | |
| Cys288 | 282-293 | L.QTQLQKC(+242.15)EILQA.D | 41.70 | Elastase | In Gel |
| 282-290 | L.QTQLQKC(+242.15)EI.L | 36.70 | |||
| 284-293 | T.QLQKC(+242.15)EILQA.D | 33.47 | |||
| 280-296 | R.FLQTQLQKC(+242.15)EILQADAR.C | 55.81 | Trypsin | In Gel | |
| 288-296 | K.C(+242.15)EILQADAR.C | 50.84 | |||
| 288-296 | K.C(+242.15)EILQADAR.C | 48.80 | Trypsin | In Solution | |
| Cys297 | 294-304 | A.DARC(+242.15)KDYLVQI.F | 37.15 | Elastase | In Gel |
| K615 | 602-615 | R.SGVGVAVTMEPCRK(+242.15).Q | 37.59 | Trypsin | In Gel |
| 602-615 | R.SGVGVAVTM(+15.99)EPCRK(+242.15).Q | 36.40 | |||
| b | |||||
|---|---|---|---|---|---|
| Protein | Alkylated residue | Peptide amino acid position | Peptide sequence | X score | Ppm |
| Plsl | Cys111 | 97-123 | KEGIC(+4.98)AIGGTSEQSSVGTQHSYSEEEK | 5.998 | -2.22 |
| Acon | Cys385 | 378-395 | VGLIGSC(+4.98)TNSSYEDMGR | 4.212 | 4.17 |
| Ldha | Cys84 | 82-90 | DYC(4.98)VTANSK | 3.474 | -2.91 |
| Anxa1 | Cys189 | 186-204 | GDRC(4.98)QDLSVNQDLADTDAR | 3.514 | -0.48 |
| Ifi5b | Cys317 | 310-320 | QMIEVPNC(+4.98)ITR | 2.412 | -4.16 |
| Ipyr2 | Cys156, 157 | 153-171 | STDC(4.98)C(+4.98)GDNDPIDVCEIGSK | 4.664 | 22.60 |
| Ef2 | Cys41 | 33-42 | STLTDSLVC(+4.98)K | 3.677 | -1.41 |
| Thio | Cys73 | 73-81 | C(+4.98)MPTFQFYK | 2.422 | -2.22 |
| c | |||||
|---|---|---|---|---|---|
| Protein | Alkylated residue | Peptide amino acid position | Peptide sequence | X score | Ppm |
| Gilt | Cys69 | 61-73 | VSLYYESLC(+4.98)GACR | 4.677 | 3.40 |
| Fgd6 | Cys1004 | 9996-1005 | NVALLDEQC(+4.98)K | 3.759 | -7.98 |
| Olfr644 | Cys306 | 305-313 | FC(+4.98)KILLGNK | 3.155 | -2.10 |
| Ldha | Cys84 | 82-90 | DYC(+4.98)VTANSK | 2.832 | 3.88 |
| Padi6 | Cys553 | 553-558 | C(+4.98)ISLNR | 2.446 | -18.58 |
| Ubr4 | Cys4241 | 4237-4244 | LIASC(+4.98)HWK | 2.421 | -7.45 |
| Hmox2 | Cys314 | 314-323 | C(+4.98)PFYAAQPDK | 2.279 | 2.89 |
| Lhpp | Cys113 | 112-118 | FC(+4.98)TNESQK | 2.169 | -11.64 |
Supplementary Material
Supplementary Information is available in the online version of the paper.
Acknowledgements
We thank M. McMahon and J. D. Hayes for plasmids, and Cancer Research UK (C20953/A18644) and the BBSRC (BB/L01923X/1) for financial support for ATDK. This work was supported by a Wellcome Trust Investigator award to R.C.H. (110158/Z/15/Z), a grant to M.P.M. from the Medical Research Council UK (MC_U105663142), a Wellcome Trust Investigator award to MPM (110159/Z/15/Z), and a grant to E.R.S.K. and M.S.K. from the Medical Research Council UK (MC_U105663139). B.M.K. and R.F. are supported by the Kennedy Trust Fund. We acknowledge Metabolon for their assistance with the metabolic work and analysis. The O’Neill laboratory acknowledges the following grant support: European Research Council (ECFP7-ERC-MICROINNATE), Science Foundation Ireland Investigator Award (SFI 12/IA/1531), GlaxoSmithKline Visiting Scientist Programme and The Wellcome Trust (oneill-wellcometrust-metabolic, grant number 205455). E.T.C. is supported by the Claudia Adams Barr Program.
Footnotes
Data availability. Full scans for all western blots are provided in Supplementary Fig 1. Source Data for all mouse experiments have been provided. All other data are available from the corresponding author on reasonable request.
Author Contributions E.L.M. and D.G.R. designed and performed experiments and analysed the data. E.L.M. wrote the manuscript with assistance from all other authors. D.M., M.M.H., M.C.R. and A.F.M. performed in vitro experiments using OI. R.G.C., D.C.S., A.S.H.C. and C.F. assisted with the metabolomics analysis. Z.Z., P.G.F. and E.H. assisted with the in vivo mouse LPS trials. S.T.C. and R.C.H. were responsible for the design and synthesis of octyl esters. H.A.P., E.R.S.K., M.S.K. and L.M.B. assessed the effect of OI and itaconate on mitochondrial parameters and itaconate transport. D.D., M.H. and A.T.D.-K. performed the NQO1 assay and KEAP1 wild-type and Cys151Ser mutant experiments. J.F.M., R.F., B.M.K., E.T.C., M.P.J. and J.S. assisted with mass spectrometry experiments. L.K.M. and G.B. provided guidance and advice. E.V.K., P.J.M. and M.L.J.A. assisted with experiments in Nrf2-deficient mice. L.A.O’N. conceived ideas and oversaw the research programme. M.P.M. provided advice, reagents and oversaw a portion of the work.
Author Information Reprints and permissions information is available at www.nature.com/reprints. Readers are welcome to comment on the online version of the paper. Publisher’s note: Springer Nature remains neutral with regard to jurisdictional claims in published maps and institutional affiliations.
The authors declare no competing interests.
Rreviewer Information Nature thanks N. S. Chandel, R. Rossignol, S. Werner and the other anonymous reviewer(s) for their contribution to the peer review of this work.
References
- 1.Michelucci A, et al. Immune-responsive gene 1 protein links metabolism to immunity by catalyzing itaconic acid production. Proc Natl Acad Sci USA. 2013;110:7820–7825. doi: 10.1073/pnas.1218599110. [DOI] [PMC free article] [PubMed] [Google Scholar]
- 2.Strelko CL, et al. Itaconic acid is a mammalian metabolite induced during macrophage activation. J Am Chem Soc. 2011;133:16386–16389. doi: 10.1021/ja2070889. [DOI] [PMC free article] [PubMed] [Google Scholar]
- 3.Lampropoulou V, et al. Itaconate links inhibition of succinate dehydrogenase with macrophage metabolic remodeling and regulation of inflammation. Cell Metab. 2016;24:158–166. doi: 10.1016/j.cmet.2016.06.004. [DOI] [PMC free article] [PubMed] [Google Scholar]
- 4.Mills EL, et al. Succinate dehydrogenase supports metabolic repurposing of mitochondria to drive inflammatory macrophages. Cell. 2016;167:457–470. doi: 10.1016/j.cell.2016.08.064. [DOI] [PMC free article] [PubMed] [Google Scholar]
- 5.Hayes JD, Dinkova-Kostova AT. The Nrf2 regulatory network provides an interface between redox and intermediary metabolism. Trends Biochem Sci. 2014;39:199–218. doi: 10.1016/j.tibs.2014.02.002. [DOI] [PubMed] [Google Scholar]
- 6.Brennan MS, et al. Dimethyl fumarate and monoethyl fumarate exhibit differential effects on KEAP1, NRF2 activation, and glutathione depletion in vitro. PLoS One. 2015;10:e0120254. doi: 10.1371/journal.pone.0120254. [DOI] [PMC free article] [PubMed] [Google Scholar]
- 7.ElAzzouny M, et al. Dimethyl itaconate is not metabolized into itaconate intracellularly. J Biol Chem. 2017;292:4766–4769. doi: 10.1074/jbc.C117.775270. [DOI] [PMC free article] [PubMed] [Google Scholar]
- 8.Kobayashi EH, et al. Nrf2 suppresses macrophage inflammatory response by blocking proinflammatory cytokine transcription. Nat Commun. 2016;7:11624. doi: 10.1038/ncomms11624. [DOI] [PMC free article] [PubMed] [Google Scholar]
- 9.Lee JM, Calkins MJ, Chan K, Kan YW, Johnson JA. Identification of the NF-E2-related factor-2-dependent genes conferring protection against oxidative stress in primary cortical astrocytes using oligonucleotide microarray analysis. J Biol Chem. 2003;278:12029–12038. doi: 10.1074/jbc.M211558200. [DOI] [PubMed] [Google Scholar]
- 10.Piantadosi CA, et al. Heme oxygenase-1 couples activation of mitochondrial biogenesis to anti-inflammatory cytokine expression. J Biol Chem. 2011;286:16374–16385. doi: 10.1074/jbc.M110.207738. [DOI] [PMC free article] [PubMed] [Google Scholar]
- 11.Prochaska HJ, Santamaria AB. Direct measurement of NAD(P)H:quinone reductase from cells cultured in microtiter wells: a screening assay for anticarcinogenic enzyme inducers. Anal Biochem. 1988;169:328–336. doi: 10.1016/0003-2697(88)90292-8. [DOI] [PubMed] [Google Scholar]
- 12.Fahey JW, Dinkova-Kostova AT, Stephenson KK, Talalay P. The “Prochaska” microtiter plate bioassay for inducers of NQO1. Methods Enzymol. 2004;382:243–258. doi: 10.1016/S0076-6879(04)82014-7. [DOI] [PubMed] [Google Scholar]
- 13.Dinkova-Kostova AT, et al. Direct evidence that sulfhydryl groups of Keap1 are the sensors regulating induction of phase 2 enzymes that protect against carcinogens and oxidants. Proc Natl Acad Sci USA. 2002;99:11908–11913. doi: 10.1073/pnas.172398899. [DOI] [PMC free article] [PubMed] [Google Scholar]
- 14.McMahon M, Lamont DJ, Beattie KA, Hayes JD. Keap1 perceives stress via three sensors for the endogenous signaling molecules nitric oxide, zinc, and alkenals. Proc Natl Acad Sci USA. 2010;107:18838–18843. doi: 10.1073/pnas.1007387107. [DOI] [PMC free article] [PubMed] [Google Scholar]
- 15.Dinkova-Kostova AT, Kostov RV, Canning P. Keap1, the cysteine-based mammalian intracellular sensor for electrophiles and oxidants. Arch Biochem Biophys. 2017;617:84–93. doi: 10.1016/j.abb.2016.08.005. [DOI] [PMC free article] [PubMed] [Google Scholar]
- 16.Zhang DD, Hannink M. Distinct cysteine residues in Keap1 are required for Keap1-dependent ubiquitination of Nrf2 and for stabilization of Nrf2 by chemopreventive agents and oxidative stress. Mol Cell Biol. 2003;23:8137–8151. doi: 10.1128/MCB.23.22.8137-8151.2003. [DOI] [PMC free article] [PubMed] [Google Scholar]
- 17.Linker RA, et al. Fumaric acid esters exert neuroprotective effects in neuroinflammation via activation of the Nrf2 antioxidant pathway. Brain. 2011;134:678–692. doi: 10.1093/brain/awq386. [DOI] [PubMed] [Google Scholar]
- 18.Tallam A, et al. Gene regulatory network inference of immunoresponsive gene 1 (IRG1) identifies interferon regulatory factor 1 (IRF1) as its transcriptional regulator in mammalian macrophages. PLoS One. 2016;11:e0149050. doi: 10.1371/journal.pone.0149050. [DOI] [PMC free article] [PubMed] [Google Scholar]
- 19.Naujoks J, et al. IFNs modify the proteome of legionella-containing vacuoles and restrict infection via IRG1-derived itaconic acid. PLoS Pathog. 2016;12:e1005408. doi: 10.1371/journal.ppat.1005408. [DOI] [PMC free article] [PubMed] [Google Scholar]
- 20.Guarda G, et al. Type I interferon inhibits interleukin-1 production and inflammasome activation. Immunity. 2011;34:213–223. doi: 10.1016/j.immuni.2011.02.006. [DOI] [PubMed] [Google Scholar]
- 21.Thimmulappa RK, et al. Nrf2 is a critical regulator of the innate immune response and survival during experimental sepsis. J Clin Invest. 2006;116:984–995. doi: 10.1172/JCI25790. [DOI] [PMC free article] [PubMed] [Google Scholar]
- 22.Cordes T, et al. Immunoresponsive gene 1 and itaconate inhibit succinate dehydrogenase to modulate intracellular succinate levels. J Biol Chem. 2016;291:14274–14284. doi: 10.1074/jbc.M115.685792. [DOI] [PMC free article] [PubMed] [Google Scholar]
- 23.Freigang S, et al. Nrf2 is essential for cholesterol crystal-induced inflammatory activation and exacerbation of atherosclerosis. Eur J Immunol. 2011;41:2040–2051. doi: 10.1002/eji.201041316. [DOI] [PubMed] [Google Scholar]
- 24.Dinarello CA. Interleukin-1 in the pathogenesis and treatment of inflammatory diseases. Blood. 2011;117:3720–3732. doi: 10.1182/blood-2010-07-273417. [DOI] [PMC free article] [PubMed] [Google Scholar]
- 25.Shen H, et al. The human knockout gene CLYBL connects itaconate to vitamin B12. Cell. 2017;171:771–782. doi: 10.1016/j.cell.2017.09.051. [DOI] [PMC free article] [PubMed] [Google Scholar]
- 26.Chappell JB, Hansford RVA. Subcellular Components: Preparation and Fractionation. 2nd edn. Butterworth; 1972. [Google Scholar]
- 27.Bridges HR, Mohammed K, Harbour ME, Hirst J. Subunit NDUFV3 is present in two distinct isoforms in mammalian complex I. Biochim Biophys Acta. 2017;1858:197–207. doi: 10.1016/j.bbabio.2016.12.001. [DOI] [PMC free article] [PubMed] [Google Scholar]
- 28.Akerboom TP, Sies H. Assay of glutathione, glutathione disulfide, and glutathione mixed disulfides in biological samples. Methods Enzymol. 1981;77:373–382. doi: 10.1016/s0076-6879(81)77050-2. [DOI] [PubMed] [Google Scholar]
- 29.Booty LM, et al. The mitochondrial dicarboxylate and 2-oxoglutarate carriers do not transport glutathione. FEBS Lett. 2015;589:621–628. doi: 10.1016/j.febslet.2015.01.027. [DOI] [PMC free article] [PubMed] [Google Scholar]
Associated Data
This section collects any data citations, data availability statements, or supplementary materials included in this article.


