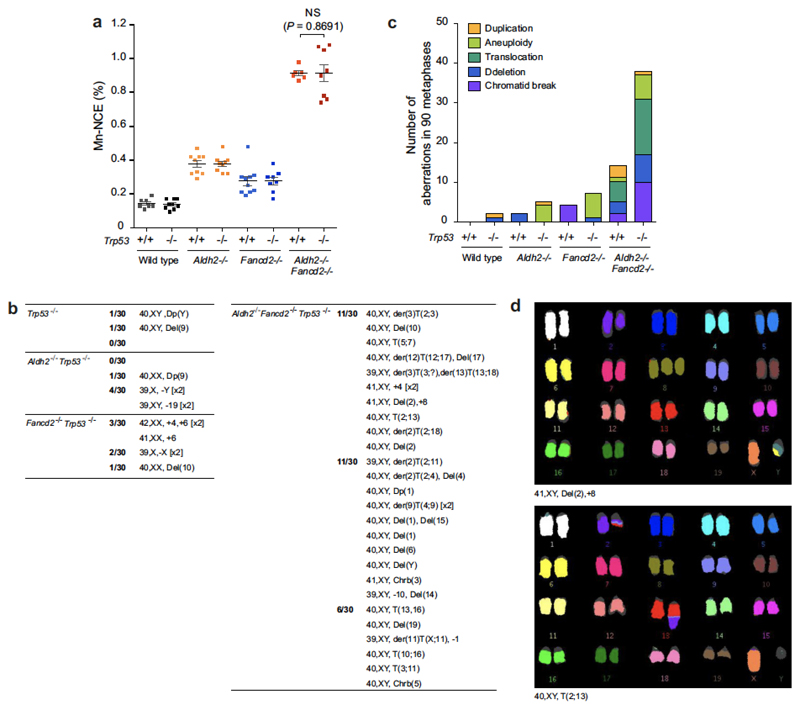
Extended Data Figure 8. Genomic instability in Aldh2−/−Fancd2−/−Trp53−/− mice.
a, Quantification of micronucleated NCEs in the blood of Aldh2−/−Fancd2−/−Trp53−/− and control mice (P calculated by two-sided Mann–Whitney test; data shown as mean and s.e.m.; n = 8 mice). b, List of chromosomal aberrations observed in the bone marrow of 8-to-12 week-old untreated Aldh2−/−Fancd2−/−Trp53−/− and control mice. Three mice and 30 metaphases per mouse were analysed per genotype; the numbers represent the fraction of abnormal metaphases per mouse. c, Bar chart classifying the types of aberrations for each genotype (90 metaphases per condition). d, Examples of two metaphases from an Aldh2−/−Fancd2−/−Trp53−/− mouse.

