

Summary
Background
The diagnosis of either Alzheimer's disease (AD) or vascular dementia (VaD) is still largely based on clinical guidelines and exclusion of other diseases that may lead to dementia.
Aims
In this study, we assessed whether the use of sensitive and specific biomarkers such as phosphorylated tau proteins could contribute to an earlier and more accurate diagnosis of AD and VaD, as well as to their differentiation.
Material and methods
A total of 198 patients, of which 152 had AD, 28 VaD, and 18 were healthy controls (HC), were included in the analyses. We analyzed cerebrospinal fluid (CSF) levels of total tau protein (t‐tau), tau protein phosphorylated at threonine 231 (p‐tau231), and factor score (FS) determined by combination of p‐tau231 and Mini‐Mental State Examination (MMSE) in patients with AD and VaD, as well as in HC. We tested the diagnostic accuracy of these biomarkers in the CSF and FS (p‐tau231, MMSE) in differentiating AD from VaD and HC.
Results
Total tau levels were significantly elevated in subjects with AD compared to HC, as well as in VaD subjects compared to HC.
Discussion
p‐tau231 levels were significantly higher in patients with AD vs HC as well in patients with VaD vs HC. p‐tau231 levels did not distinguish AD from VaD patients. Importantly, FS(p‐tau231 and MMSE) showed statistically significant differences in the distribution of subjects with AD and VaD.
Conclusion
These results indicate that FS (p‐tau231 and MMSE) has a strong potential to provide an early distinction between AD and VaD.
Keywords: Alzheimer's disease, biomarkers, cerebrospinal fluid, tau proteins, vascular dementia
1. INTRODUCTION
Dementia is a major public health problem worldwide, partly due to the increasing life expectancy of the population. Epidemiological data for developed countries show that the prevalence of Alzheimer’s disease (AD) in adults at age 60‐64 is less than 1% in Europe, but after age 65, the incidence doubles every 5 years of life.1, 2 Overall, neurological diseases that cause dementia are the third leading cause of life with disabilities globally.3 The most common primary cause of dementia is AD,4 which represents over 65% of all dementia cases, followed by vascular dementia (VaD), which is responsible for most of the remainder.4 AD is characterized by an insidious onset with a slow progressive course with impairment of memory, language, and visuospatial functions ultimately resulting in global cognitive impairment.5 VaD represents a large group of clinical entities associated with vascular changes6 and heterogeneous clinical presentation described as less insidious in onset compared to AD, which shows a stepwise decline in cognitive abilities.7 The most important feature of VaD is that it can be prevented by acting on risk factors, stressing the need for an early diagnosis of VaD.6
Diagnosis of either AD or VaD is still largely based on clinical guidelines and exclusion of other diseases that may lead to dementia. For AD, we used diagnostic criteria of McKhann and collaborators from 2011.7 Compared to the older AD criteria from 1984,8 which addressed only one final stage of the disease and memory loss as the first and only major symptom, these new criteria recognize preclinical stage, middle stage of mild cognitive impairment (MCI), and final stage of AD marked by symptoms of dementia, and also take into account that other aspects of cognition may become impaired first. They also recognize the potential use of both imaging and biochemical biomarkers to help diagnose AD. For VaD, we used the National Institute for Neurological Disorders and Stroke‐Association Internationale pour la Recherche et l'Enseignement en Neurosciences (NINCDS‐AIREN) criteria for probable VaD,9 as well as the Hachinski Ischemic Score (HIS).10 The most important clinical discriminative factors for VaD vs AD are stepwise progression, prominent impairment of the executive functions, HIS > 4, and focal neurological signs implying cortical or subcortical lesions.11
The use of sensitive and specific biomarkers such as tau proteins, especially phosphorylated tau proteins, could contribute to the earlier and more accurate diagnosis of both AD and VaD.12 In this study, we analyzed cerebrospinal fluid (CSF) levels of total tau protein (t‐tau) and tau protein phosphorylated at threonine 231 (p‐tau231) in patients with AD and VaD, as well as in healthy controls (HC), to assess the diagnostic accuracy of these biomarkers in the CSF in differentiation of AD from VaD and HC.
2. PATIENTS AND METHODS
2.1. Patients
Patients who met all inclusion criteria were invited to participate in the study. The patients were examined at two study site, General Hospital Varaždin and Clinical Hospital Center Rebro Zagreb from August 2011 until May 2015.
At the initial visit, the patients signed an informed consent form. Consent form was explained in details to patients and caregiver. Patient and caregiver gave consent to participate in the study as well as to perform lumbar puncture. The possible complications of the procedure were explained in detail. All procedures involving human subjects were performed with the approval of the Central Ethical Committee of the University of Zagreb Medical School, case no. 380‐59/11‐500‐77/90, class 641‐01/11‐02. This research study had exclusively a diagnostic purpose and was not evaluating any health‐related interventions to evaluate possible effects on health outcomes. As such, it has not been registered as a clinical trial. Two hundred patients were assessed. Two patients were not included in the study because of pathological findings on magnetic resonance (MR) scan of the brain. The study included 198 patients, of which 152 patients with AD, 28 patients with VaD, and 18 HC. For AD, we used diagnostic criteria of McKhann and collaborators from 2011.7 For VaD, the patients fulfilled NINCDS‐AIREN9 and HIS criteria.10 The following inclusion criteria were used: age between 50 and 90 years, anamnestic data suspicious of developing dementia, normal neurological status or the presence of focal pyramidal or cerebellar lesion, Mini‐Mental State Examination (MMSE) 27‐15, neuropsychological testing suspected to dementia syndrome (Montreal Cognitive Assessment, MoCA, Alzheimer's Disease Assessment Scale‐cognitive subscale, ADAS‐Cog), complete blood tests including levels of vitamin B12, folic acid (B9) and thyroid function test, a negative serology for syphilis or Lyme's disease, and absence of other pathologies on brain MR imaging. Patients who did not fulfill these criteria were excluded from the study. It should be noted that HIS only suggests the likelihood of VaD, but does not confirm the presence or absence of VaD and that neuroradiologic diagnosis remains unreliable in the early phase of the disease.
2.2. Cerebrospinal fluid (CSF) sampling and analysis
Lumbar puncture was performed between 8 am and 10 am, and CSF was obtained by a routine protocol from the L3/L4 or L4/L5 intervertebral space. After the first few drops were discharged, 2 mL of the CSF was collected in polypropylene tubes. In case of a traumatic puncture with hemorrhagic CSF, these samples were excluded from analysis. CSF samples were stored at 4°C, wrapped in aluminum foil, and transported on ice to the laboratory. All enzyme‐linked immunosorbent assay (ELISA) analyses of CSF samples were performed at the Laboratory for Developmental Neuropathology of the Croatian Institute for Brain Research, University of Zagreb School of Medicine. Each sample was first centrifuged for 10 minutes at 2000 g at 4°C to exclude cells and other insoluble materials. The remaining amount of CSF was stored at −80°C for later analysis of CSF biomarkers. All CSF analyses were performed according to the manufacturers’ detailed instructions, with at least two internal sample controls used to verify the consistency of the results. The total tau protein concentration (all 6 isoforms) was determined using human Tau Ag Fujirebio (Ghent, Belgium) ELISA kit. To determine the concentration of tau protein phosphorylated at threonine 231 (p‐tau231), the Tau [pT231] (Phospho) Human ELISA Kit (Thermo Fisher Scientific, Waltham, MA, USA) was used. Results were read using an ELISA Reader Model Bio‐Rad 680 (Bio‐Labor Laboratories, Hercules, CA, USA). There were no significant differences in the levels of total tau and p‐tau231 between the samples from the two different hospitals (Zagreb and Varaždin).
2.3. Statistical analysis
For comparison of demographic, clinical, and laboratory parameters, the nonparametric Kruskal‐Wallis test was used. Due to the relatively small sample sizes and because it does not require assumption of normal distributions, the nonparametric Mann‐Whitney U test was used for some comparisons between the groups, in addition to the t test. Receiver operating characteristic (ROC) curve analysis was used to evaluate the diagnostic value of the parameters from the variables in the differentiation of the examined groups. Cut‐off levels of both markers used in the study were derived from the ROC curve analysis, with the sum of sensitivity and specificity maximized. In addition, the specificity of both markers in differentiating the groups, with sensitivity set to 85%, was determined. Sensitivity and specificity were visualized with confidence interval (CI) of 95%. In addition, the area under the ROC curve (AUC) was shown as an accuracy indicator. The correlation between CSF biomarkers was tested using the Spearman test (r s) and the Pearson coefficient of correlation (r). The factor score (FS) was used as a multidimensional analysis method that describes relationship of a large number of original variables by means of a smaller number of common factors or by a variable that better describes them, or explain their relationship more clearly. The factor score of p‐tau231 and MMSE was determined using the dimension reduction option in SPSS. With this function, two or more variables (so‐called manifest variables) are unified into one (factor score or so‐called latent variable).
3. RESULTS
The demographic data of the subjects included in the study, their MMSE scores, and CSF levels of t‐tau and p‐tau231 are shown in Table 1. On average, patients with AD (U = 635, Z = −3.437, P = 0.001) and VaD patients (U = 132, Z = −2.484, P = 0.013) were significantly older than HC. However, because there was no significant correlation between age and CSF biomarker levels, the lower mean age of the HC was not considered as a significant factor in the interpretation of the results. Patients with AD (U = 57.5, Z = −6.065, P < 0.001) and VaD patients (U = 41, Z = −4.334, P < 0.001) had significantly lower MMSE scores in comparison to HC. Levels of t‐tau were significantly higher in AD patients in comparison to HC (U = 654, Z = −3.616, P < 0.001) and VaD patients in comparison to HC (U = 124, Z = −2.881, P = 0.004).
Table 1.
CSF levels of t‐tau and p‐tau231, demographic data, and MMSE scores in AD, VaD, and HC
| Group (number of patients) | Age Mean ± SD | Sex F vs M | MMSE Mean ± SD | Total tau (pg/ml) | p‐tau231 (U/ml) | ||
|---|---|---|---|---|---|---|---|
| Mean ± SD | Median (25‐75th percentile) | Mean ± SD | Median (25‐75th percentile) | ||||
| AD (152) | 71 ± 8.0 | 83 vs 69 | 20.4 ± 4.4 | 532 ± 377 | 439 (257‐666.6) | 3.501 ± 5.007 | 1.758 (0.805‐3.493) |
| HC (18) | 59 ± 14.8 | 8 vs 10 | 28.5 ± 1.8 | 271 ± 265.9 | 185 (83.5‐334) | 0.907 ± 1.481 | 0.587 (0.164‐0.803) |
| VaD (28) | 70 ± 9.6 | 15 vs 13 | 22.6 ± 4.5 | 505 ± 314 | 429.8 (237.5‐692) | 1.324 ± 0.704 | 1.098 (0.763‐1.905) |
AD, Alzheimer's disease; F, female; HC, healthy controls; M, male; MMSE, Mini‐Mental State Examination; SD, standard deviation; VaD, vascular dementia.
The levels of p‐tau231 were significantly higher in AD (U = 548, Z = −4.030, P < 0.001) and VaD patients (U = 79.5, Z = −2.940, P = 0.003) in comparison to HC (Figure 1).
Figure 1.
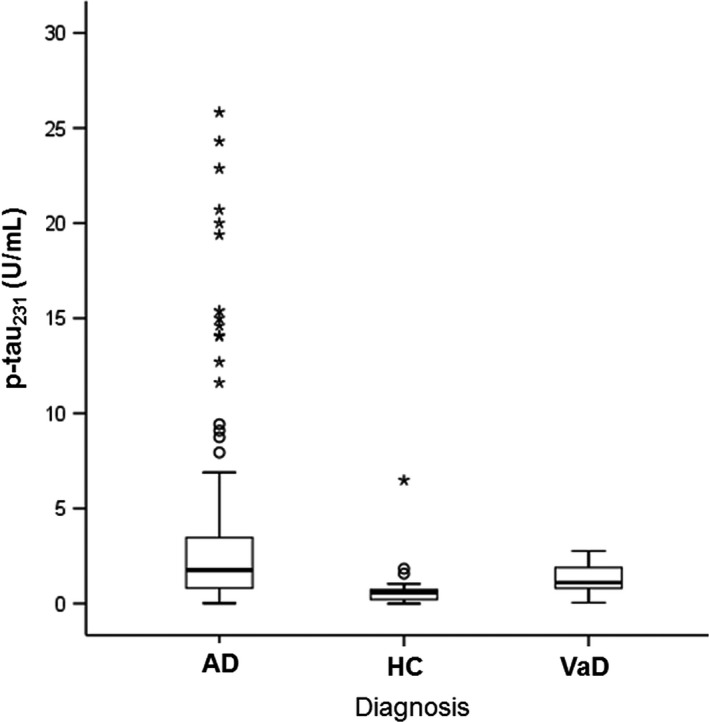
Levels of p‐tau231 in Alzheimer's disease and vascular dementia patients, and healthy controls. Boxes represent the median, the 25th and 75th percentiles, and bars indicate the range of data distribution. Circles represent outliers, asterisks represent extreme data points
The factor score values for p‐tau231 and MMSE, FS (p‐tau231, MMSE), were significantly lower in AD (U = 71, Z = −5.946, P < 0.001) and VaD patients (U = 39, Z = −3.700, P < 0.001) in comparison to HC. The FS (p‐tau231, MMSE) was significantly lower in AD (U = 760, Z = −3.417, P = 0.001) in comparison to VaD patients (Figure 2).
Figure 2.
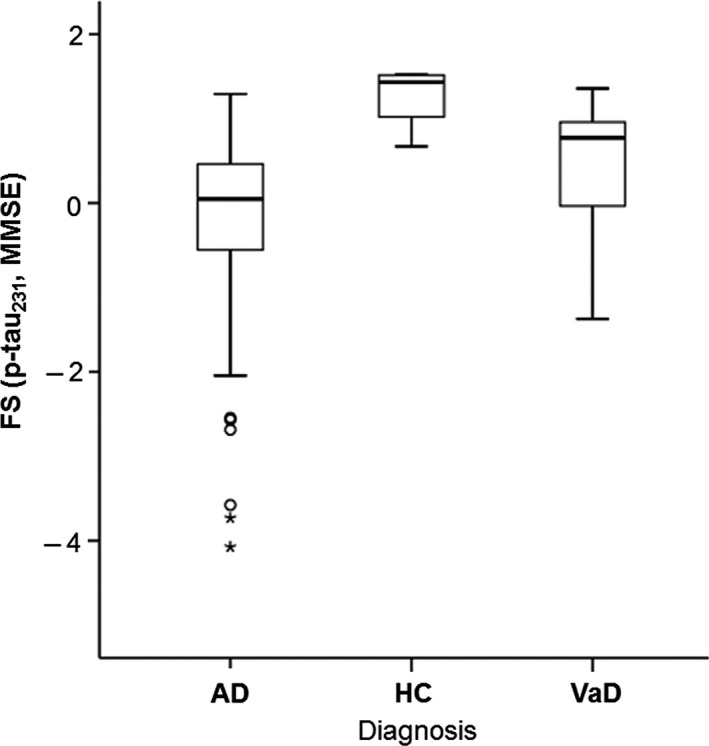
Levels of FS (p‐tau231, MMSE) in Alzheimer's disease and vascular dementia patients, and healthy controls. Boxes represent the median, the 25th, and 75th percentiles, and bars indicate the range of data distribution. Circles represent outliers, asterisks represent extreme data points
Also, p‐tau231 levels positively and significantly correlated with the levels of t‐tau (Table 2, Figure 3). ROC curve analyses of AD vs HC and VaD vs HC were significant for p‐tau231, as well as when comparing FS (p‐tau231, MMSE) in AD vs HC, VaD vs HC, and AD vs VaD (Figure 4). FS(p‐tau231 and MMSE) additionally increased the sensitivity of differentiation between AD vs HC and AD vs VaD, but not between VaD vs HC (Table 3).
Table 2.
Correlation between t‐tau and p‐tau231
| Total tau vs p‐tau231 | ||
|---|---|---|
| Pearson's correlation | Spearman's correlation | |
| All patients | r = 0.251, df = 185, P = 0.001a | r S = 0.609, df = 185, P < 0.001a |
| AD (146) | r = 0.211, df = 144, P = 0.011 | r S = 0.543, df = 144, P < 0.001a |
| HC (18) | r = 0.815, df = 16, P < 0.001a | r S = 0.272, df = 16, P = 0.275 |
| VaD (20) | r = 0.781, df = 18, P < 0.001a | r S = 0.772, df = 18, P < 0.001a |
AD, Alzheimer's disease; HC, healthy controls; MMSE, Mini‐Mental State Examination; VaD, vascular dementia.
P < 0.05.
Figure 3.
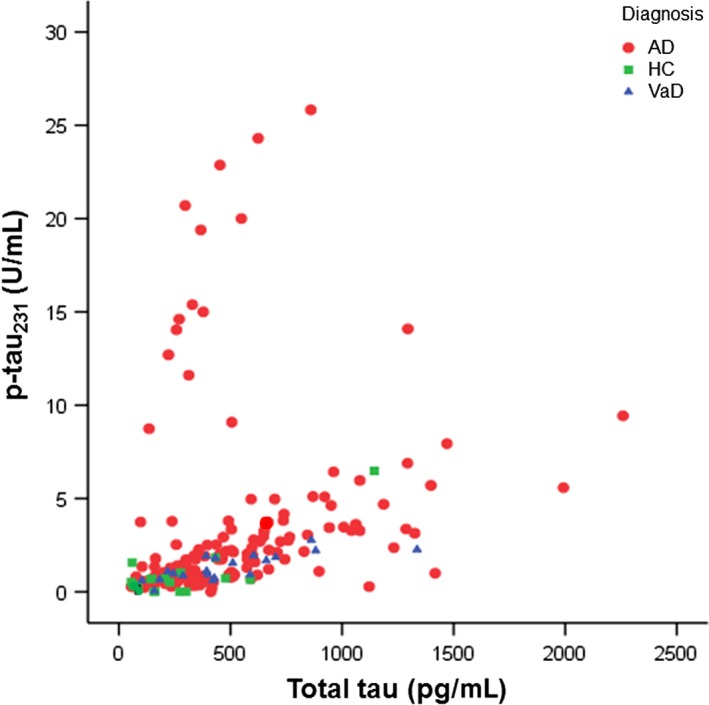
Correlation between t‐tau and p‐tau231 levels
Figure 4.
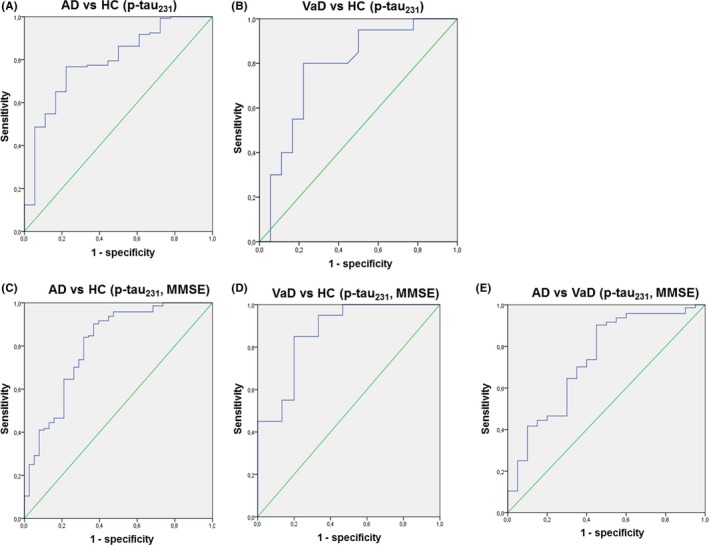
ROC curve analysis for p‐tau231 between A) Alzheimer's disease (AD) and healthy controls (HC), B) vascular dementia (VaD) and HC, and for FS (p‐tau231, MMSE) between C) AD and HC, D) VaD and HC, and E) AD vs VaD
Table 3.
Sensitivity, specificity, cut‐off levels, and P‐values for p‐tau231 and FS (p‐tau231, MMSE) among examined groups
| AD vs HC | VaD vs HC | AD vs VaD | |||
|---|---|---|---|---|---|
| p‐tau231 (U/ml) | FS (p‐tau231, MMSE) | p‐tau231 (U/ml) | FS (p‐tau231, MMSE) | FS (p‐tau231, MMSE) | |
| Sensitivity (%) | 76.7 | 90.3 | 80 | 80 | 90.3 |
| Specificity (%) | 77.8 | 63.2 | 77.8 | 85 | 55 |
| Cut‐off | 0.734 | 0.748 | 0.728 | 0.870 | 0.748 |
| P | <0.001a | <0.001a | <0.001a | <0.001a | 0.001a |
AD, Alzheimer's disease; FS, factor score; HC, healthy controls; MMSE, Mini‐Mental State Examination; VaD, vascular dementia.
P < 0.05.
4. DISCUSSION
We analyzed the diagnostic value of specific biomarkers of the t‐tau protein, p‐tau231, and FS (made from p‐tau231 and MMSE) in the differentiation of patients with AD vs VaD group. The t‐tau levels were significantly elevated in subjects with AD compared to HC. P‐tau231 levels were significantly higher in patients with AD vs HC as well in patients with VaD vs HC. There was no statistical significance of p‐tau231 in distinguishing patients with AD vs VaD. When we examined FS (p‐tau231 and MMSE), we received statistical significance for distinguishing patients with AD vs HC and patients with VaD vs HC. The most significant was the fact that FS (p‐tau231 and MMSE) showed significant differences in the distribution of subjects with AD and VaD. Based on the Recommendations of a Consensus Report for Useful Biomarkers of AD, setting specificity and sensitivity to 85% or higher,13 our results indicate that p‐tau231 shows specificity and sensitivity greater than 75% in distinguishing subjects with AD vs HC (76.7% sensitivity and 77.8% specificity) while FS(p‐tau231 and MMSE) shows 90% sensitivity in differentiating subjects with AD vs HC, but the specificity of this group is less than 75%. Similarly, p‐tau231 differentiates subjects for VaD vs HC with sensitivity 80% and specificity 77.8%, and FS(p‐tau231 and MMSE) shows sensitivity 80% and specificity 85%, which makes it an ideal candidate biomarker.
Vandermeeren and colleagues reported that t‐tau was increased in patients with AD compared to HC, as confirmed by later studies.14, 15 Levels of t‐tau were shown to be a marker of neural damage, increased not only in AD, but also in other primary causes of dementia.16 In addition, subsequent investigations have confirmed that t‐tau levels in CSF reflect the intensity of neuronal damage and degeneration. Therefore, t‐tau levels can also be elevated in patients with vascular damage,17 whereas the highest values of the t‐tau protein have been described in Creutzfeldt‐Jakob's disease due to a very intensive neuronal degeneration.18 In one study, the transient increase in CSF t‐tau concentration in acute stroke positively correlated with the area of brain infarction, measured by computerized tomography.17 Schönknecht et al19 showed that t‐tau levels were significantly higher in patients with AD compared to VaD, as well as HC and patients suffering from major depression. Several other authors confirmed these results,20, 21, 22 although other authors reported divergent data.23, 24 Some factors may explain these differences. First, in acute stroke t‐tau levels are increased in CSF, but the highest values have been observed only 3 weeks after stroke after which they gradually decreased over the next 3‐5 months.17 Second, elevated levels of t‐tau in VaD observed in some studies may mean that some patients may have experienced repeated strokes during the follow‐up period, but without any clinical signs, especially if there had been a preexisting history of neurological signs without significant changes in HIS score. Because neuroimaging is more frequently performed than lumbar puncture for diagnosis of VaD, clinicians should consider repeating neuroimaging before lumbar puncture in VaD patients.
According to several previous investigations, p‐tau231 is a marker highly specific of AD.25, 26, 27 Thus, it can be detected very early in the CSF of patients with AD.25 The p‐tau231 concentration alone has also shown a good correlation with the progression of the disease in a single patient with AD.25, 26 Bürger and colleagues showed that p‐tau231 levels were elevated in subjects with MCI and also inversely correlated with their MMSE score.27 Also, the data from Hampel and collaborators agree with the notion that variations in p‐tau231 levels reflect differences in the degree of neuronal damage across AD patients. Although the strength of the correlations presently suggests no sufficient clinical utility to individual patients, p‐tau231 levels may be used to predict progression of brain atrophy in AD.28 Hampel and collaborators demonstrated the discriminatory power of p‐tau (p‐tau231, p‐tau181, p‐tau199) in differentiating patients with AD from HC as well as other types of dementia including VaD.29 Unfortunately, due to insufficient number of patients with VaD, the discriminatory (cut‐off) levels of p‐tau231 for VaD could not be demonstrated in that study.29 A longitudinal study of CSF tau protein in AD and VaD showed a statistically significant difference in the concentrations of t‐tau and p‐tau in AD (moderate to severe AD) compared to VaD, especially in the case of severe AD, but no significant differences in the levels of t‐tau and p‐tau231 as MMSE scores after 6 months of monitoring compared to initial measurements.30 It should be noted that our study revealed similar results, whereas our patients generally had milder dementia, as measured by MMSE scores, than the study of Wang and collaborators.30
The present study took care to match subject groups as closely as possible for age, sex, and other demographic characteristics, so that confounding biases could be minimized. Nevertheless, HC were on average younger than subjects from the other groups, which could have influenced the outcome to some level. We also had a relatively fewer HC. The possible discrepancies could also result from differences in study design. To verify the reliability of our results, we therefore performed all CSF analyses with at least two internal sample controls.
Previous studies have shown that p‐tau231 CSF levels reliably differentiate patients with AD and HC.31 Our results confirm and extend these observations, as they indicate that p‐tau231 CSF levels can also be used for differentiating subjects with VaD from HC. Additionally, in distinguishing between AD and VaD, we established that FS (p‐tau231 and MMSE) has a strong potential to offer earlier distinction between these conditions. This finding has not only clinical significance, but also potential to prevent development and complications of VaD at an early stage.
ETHICAL APPROVAL
All procedures involving human subjects were in accord with the ethical approval from the Central Ethical Committee of the General Hospital Varaždin and with the approval of the Central Ethical Committee of the University of Zagreb Medical School, case no. 380‐59/11‐500‐77/90.
CONFLICT OF INTERESTS
All authors have completed the Unified Competing Interest form at www.icmje.org/coi_disclosure.pdf (available on request from the corresponding author) and declare no support from any organization for the submitted work; no financial relationships with any organizations that might have an interest in the submitted work in the previous 3 years; and no other relationships or activities that could appear to have influenced the submitted work.
Kiđemet‐Piskač S, Babić Leko M, Blažeković A, et al. Evaluation of cerebrospinal fluid phosphorylated tau231 as a biomarker in the differential diagnosis of Alzheimer's disease and vascular dementia. CNS Neurosci Ther. 2018;24:734–740. 10.1111/cns.12814
Funding information
This work was funded by the Croatian Science Foundation, grants no. IP‐2014‐09‐9730 and DOK‐2015‐10‐7200, for the project “Tau protein hyperphosphorylation, aggregation, and trans‐synaptic transfer in Alzheimer's disease: cerebrospinal fluid analysis and assessment of potential neuroprotective compounds” to GŠ, by the University of Zagreb, grant no. 2017‐BM82, for the project “Determination of the permeability of the blood‐brain barrier in Alzheimer's disease” to GŠ, by the European Union through the European Regional Development Fund, Operational Programme Competitiveness and Cohesion, grant agreement no. KK.01.1.1.01.0007, CoRE – Neuro, and in part by NIH grant P50 AG005138 to PRH.
REFERENCES
- 1. Berr C, Wancata J, Ritchie K. Prevalence of dementia in the elderly in Europe. Eur Neuropsychopharmacol. 2005;15:463‐471. [DOI] [PubMed] [Google Scholar]
- 2. Kalaria RN, Maestre GE, Arizagaetal R. Alzheimer's disease and vascular dementia in developing countries: prevalence, management, and risk factors. Lancet Neurol. 2008;7:812‐826. [DOI] [PMC free article] [PubMed] [Google Scholar]
- 3. Ferri CP, Prince M, Brayne C, et al. Global prevalence of dementia: a Delphi consensus study. Lancet. 2005;366:2112‐2117. [DOI] [PMC free article] [PubMed] [Google Scholar]
- 4. Rizzi L, Rosset I, Roriz‐Cruz M. Global epidemiology of dementia: Alzheimer's and vascular types. Biomed Res Int. 2014;2014:908915. [DOI] [PMC free article] [PubMed] [Google Scholar]
- 5. Cummings JL. Alzheimer's disease. N Engl J Med. 2004;351:56‐67. [DOI] [PubMed] [Google Scholar]
- 6. Jellinger KA. The enigma od vascular cognitive disorder and vascular dementia. Acta Neuropathol. 2007;113:349‐388. [DOI] [PubMed] [Google Scholar]
- 7. McKhann GM, Knopman DS, Chertkow H, et al. The diagnosis of dementia due to Alzheimer's disease: recommendations from the National Institute on Aging – Alzheimer's Association workgroups on diagnostic guidelines for Alzheimer's disease. Alzheimers Dement. 2011;7:263‐269. [DOI] [PMC free article] [PubMed] [Google Scholar]
- 8. McKhann G, Drachman D, Folstein M, Katzman R, Price D, Stadlan EM. Clinical diagnosis of Alzheimer's disease: report of the NINCDS‐ADRDA work group under the auspices of department of health and human services task force on Alzheimer's Disease. Neurology. 1984;34:939‐994. [DOI] [PubMed] [Google Scholar]
- 9. Román GC, Tatemichi TK, Erkinjuntti T, et al. Vascular dementia: diagnostic criteria for research studies. Report of the NINDS‐AIREN International Workshop. Neurology. 1993;43:250‐260. [DOI] [PubMed] [Google Scholar]
- 10. Hachinski VC, Zilhka E, DuBoulay GH, et al. Cerebral blood flow in dementia. Arch Neurol. 1975;32:623‐627. [DOI] [PubMed] [Google Scholar]
- 11. Desmond DW, Erkinjuntti T, Sano M, et al. The cognitive syndrome of vascular dementia: implications for clinical trials. Alzheimer Dis Assoc Disord. 1999;13:21‐29. [PubMed] [Google Scholar]
- 12. Boban M, Grbić K, Mladinov M, et al. Cerebrospinal fluid makers in differential diagnosis of Alzheimer disease and vascular dementia. Coll Antropol. 2008;32(suppl 1):33‐36. [PubMed] [Google Scholar]
- 13. The Ronald and Nancy Reagan Research Institute of the Alzheimer's Association and the National Institute on Aging Working Group . Consensus report of the working group on: “Molecular and biochemical markers of Alzheimer's Disease”. Neurobiol Aging. 1998;19:109‐116. [PubMed] [Google Scholar]
- 14. Vandermeeren M, Mercke M, Vanmechelen E, et al. Detection of tau protein in normal and Alzheimer's disease cerebrospinal fluid with a sensitive sandwich enzyme‐linked immunosorbent assay. J Neurochem. 1993;61:1828‐1834. [DOI] [PubMed] [Google Scholar]
- 15. Olsson B, Lautner R, Anreasson U, et al. CSF and blood biomarkers for the diagnosis of Alzheimer's disease: a systematic review and metaanalysis. Lancet Neurol. 2016;15:673‐678. [DOI] [PubMed] [Google Scholar]
- 16. Blennow K. Cerebrospinal fluid protein biomarkers for Alzheimer's disease. NeuroRx. 2004;1:213‐225. [DOI] [PMC free article] [PubMed] [Google Scholar]
- 17. Hesse C, Rosengren L, Andreasen N, et al. Transient increase in total tau but not phospho‐tau in human cerebrospinal fluid after acute stroke. Neurosci Lett. 2001;297:187‐190. [DOI] [PubMed] [Google Scholar]
- 18. Otto M, Wiltfang J, Tumani H, et al. Elevated levels of tau‐protein in cerebrospinal fluid of patients with Creutzfeldt‐Jakob disease. Neurosci Lett. 1997;225:210‐212. [DOI] [PubMed] [Google Scholar]
- 19. Schönknecht P, Pantel J, Hartmann T, et al. Cerebrospinal fluid tau levels in Alzheimer's disease are elevated when compared with vascular dementia but do not correlate with measures of cerebral atrophy. Psychiatry Res. 2003;120:231‐238. [DOI] [PubMed] [Google Scholar]
- 20. Jensen M, Basun H, Lannfelt L. Increased cerebrospinal fluid tau in patients with Alzheimer's disease. Neurosci Lett. 1995;186:189‐191. [DOI] [PubMed] [Google Scholar]
- 21. Mori H, Hosoda K, Matsubara E, et al. Tau in cerebrospinal fluids: establishment of the sandwich ELISA with antibody specific to the repeat sequences in tau. Neurosci Lett. 1995;186:181‐183. [DOI] [PubMed] [Google Scholar]
- 22. Arai H, Terajima M, Miura M, et al. Tau in cerebrospinal fluid: a potential diagnostic marker in Alzheimer's disease. Ann Neurol. 1995;38:649‐652. [DOI] [PubMed] [Google Scholar]
- 23. Andreasen N, Vanmechelen E, Van de Voorde A, et al. Cerebrospinal fluid tau protein as a biochemical marker for Alzheimer's disease: a community follow up study. J Neurol Neurosurg Psychiatry. 1998;64:298‐305. [DOI] [PMC free article] [PubMed] [Google Scholar]
- 24. Tapiola T, Pirttilä T, Mikkonen M, et al. Three‐year follow‐up of cerebrospinal fluid tau, β‐amyloid 42 and 40 concentrations in Alzheimer's disease. Neurosci Lett. 2000;280:119‐122. [DOI] [PubMed] [Google Scholar]
- 25. Hampel H, Buerger K, Kohnken R, et al. Tracking of Alzheimer's disease progression with cerebrospinal fluid tau protein phosphorylated on threonine 231. Ann Neurol. 2001;49:545‐546. [PubMed] [Google Scholar]
- 26. Buerger K, Zinkowski R, Teipel SJ, et al. Differential diagnosis of Alzheimer disease with cerebrospinal fluid levels of tau protein phosphorylated at threonine 231. Arch Neurol. 2002;59:1267‐1272. [DOI] [PubMed] [Google Scholar]
- 27. Buerger K, Teipel SJ, Zinkowski R, et al. CSF tau protein phosphorylated at threonine 231 correlates with cognitive decline in MCI subjects. Neurology. 2002;59:627‐629. [DOI] [PubMed] [Google Scholar]
- 28. Hampel H, Bürger K, Pruessner JC, et al. Correlation of cerebrospinal fluid levels of tau protein phosphorylated at threonine 231 with rates of hippocampal atrophy in Alzheimer disease. Arch Neurol. 2005;62:770‐773. [DOI] [PubMed] [Google Scholar]
- 29. Hampel H, Buerger K, Zinkowski R, et al. Measurement of phosphorylated tau epitopes in the differential diagnosis of Alzheimer disease: a comparative cerebrospinal fluid study. Arch Gen Psychiatry. 2004;61:95‐102. [DOI] [PubMed] [Google Scholar]
- 30. Wang H, Wang T, Qian S, Ba L, Lin Z, Xiao S. A pilot longitudinal study on cerebrospinal fluid (CSF) tau protein in Alzheimer's disease and vascular dementia. Shanghai Arch Psychiatry. 2016;28:271‐279. [DOI] [PMC free article] [PubMed] [Google Scholar]
- 31. Babić M, Švob Štrac D, Mück‐Šeler D, et al. Update on the core and developing biomarkers for Alzheimer's disease. Croat Med J. 2014;55:347‐365. [DOI] [PMC free article] [PubMed] [Google Scholar]