Abstract
Objective
To determine the incidence and recent trends in serious pediatric emergency conditions.
Methods
We conducted a cross-sectional study of the Nationwide Emergency Department Sample from 2008 through 2014, and included patients with age < 18 with a serious condition, defined as each diagnosis group in the Diagnosis Grouping System (DGS) with a Severity Classification System (SCS) score of 5. We calculated national incidences for each serious condition using annualized weighted condition counts divided by annual US census child population counts. We determined the highest-incidence serious conditions over the study period, and calculated percentage changes between 2008 and 2014 for each serious condition using a Poisson model.
Results
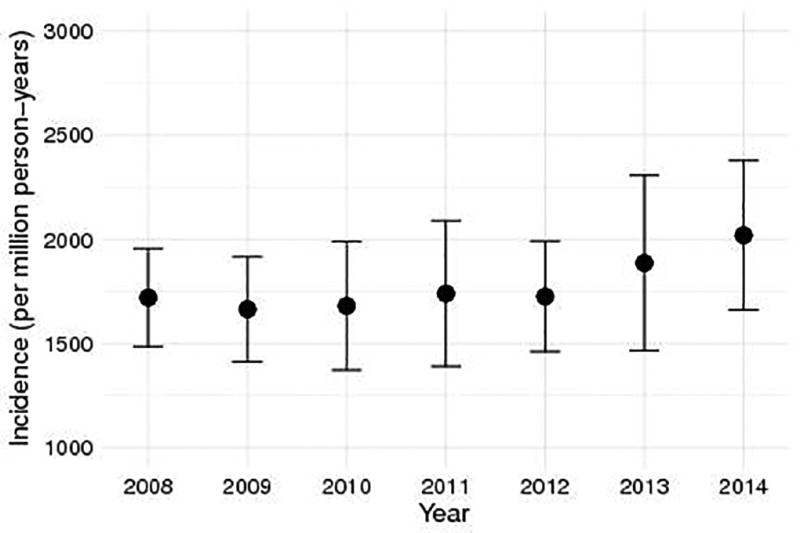
The 2008 incidence of serious conditions across the national child population was 1721 visits per million person-years [95% confidence interval (CI) 1485–1957). This incidence increased to 2020 visits per million person-years (95% CI 1661–2379) in 2014. The most common serious conditions were serious respiratory diseases, septicemia, and serious neurologic diseases. Anaphylaxis was the condition with the largest change, increasing by 147%, from 101 to 249 visits per million person-years.
Conclusions
The most common serious condition in children presenting to US EDs is serious respiratory disease. Anaphylaxis is the fastest-increasing serious condition. Additional research attention to these diagnoses is warranted.
Keywords: epidemiology, pediatrics, emergency trends
Introduction
Ensuring the pediatric emergency care system adapts to changes in epidemiology requires knowledge of the most frequent serious conditions and changes over time. Emergency department (ED) visits are common, with 34 visits per 100 children aged 1–17 years, and most families visiting because of perceived severity.1–3 Since children with serious conditions are most at risk for morbidity and complications, describing the highest-frequency conditions would inform where to target research efforts to improve ED outcomes for children.
Materials and Methods
Study design
We conducted a retrospective cohort study of children visiting an ED for a serious condition. The Institutional Review Board declared this study exempt from review. The data source was the 2008–2014 Nationwide Emergency Department Sample (NEDS), which is capable of producing national population estimates and standard errors.4 We included children under 18 years presenting to an ED in the United States between 2008 and 2014 with any serious diagnosis, defined as a diagnosis with a Pediatric Emergency Care Applied Research Network (PECARN) Severity Classification Score of 5.5
Analysis
The primary outcome was serious condition incidence. Serious conditions were grouped using the PECARN Diagnosis Grouping System, with groups relabeled to be more descriptive.6 A single ED visit could count toward multiple serious conditions, as when a patient has both anaphylaxis and shock. Incidences were calculated by dividing annual weighted condition counts by annual US census child population counts. We determined overall incidence for each serious condition over the study year and changes in incidence from 2008 to 2014 using Poisson regression. NEDS estimates were survey-weighted to report national population estimates. In addition, we determined condition-specific 2014 ED charges, hospitalization rates, mortality rates, and hospital length of stay and charges (for those hospitalized). Data were analyzed using R version 3.4.2 (R Foundation, Vienna, Austria) and the R survey package.
Results
There were 42.1 million raw pediatric NEDS observations from 2,369 hospitals during the study period. This extrapolated to 188 million pediatric ED visits nationally, of which 918,940 (0.5%) were for serious conditions. The median age was 3 years [interquartile range (IQR) 0–11], 56.6% of the cohort was male, and 84.1% lived in metropolitan areas. The hospitalization rate was 53.9%; 4.6% of children with serious conditions died in the ED and an additional 2.1% died during hospitalization (overall mortality 6.7%). The median ED charge was $1,850 (IQR 1,032–3,424). For those hospitalized, the median hospital length of stay was 4 days (IQR 2–9) and total inpatient charge was $28,911 (IQR 12,530–76,789).
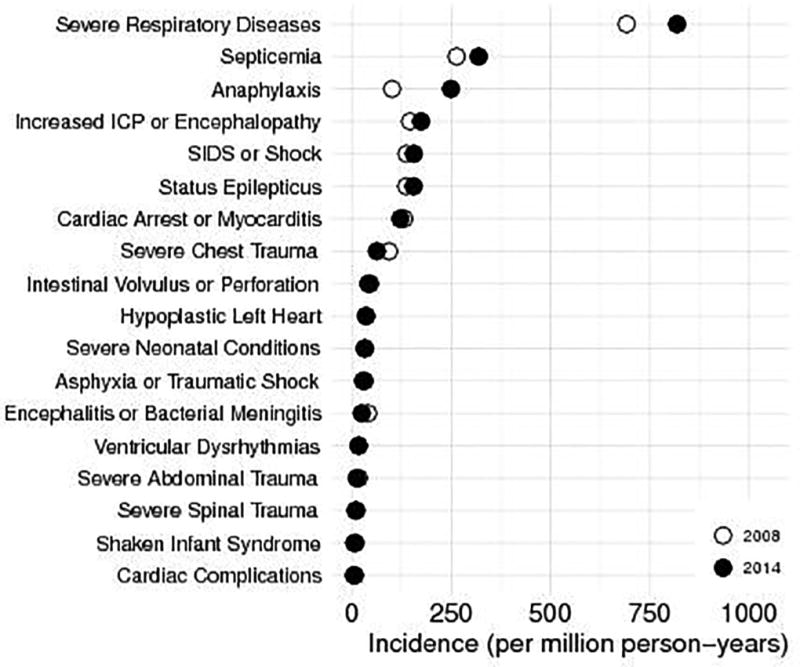
Incident ED visits for children decreased by 0.1% from 2008 (26.4 million, 3.57 visits per 10 person-years) and 2014 (26.3 million, 3.57 visits per 10 person-years). The incidence of serious conditions was 1721 visits per million person-years [95% confidence interval (CI) 1485–1957] in 2008 and 2020 (95% CI 1661–2379) in 2014 (figure 1). Incidences and trends for serious pediatric emergency conditions are shown in figure 2. Serious respiratory conditions accounted for 36.2% of all serious conditions in 2014. The most common types of serious respiratory conditions were acute respiratory failure (39.6% of serious respiratory condition diagnoses), respiratory insufficiency (34.6%), and apnea (18.1%). Among children with serious respiratory conditions, the 2014 hospitalization rate was 66.2%, median ED charge was $1803 (IQR 1052–3218), and hospital length of stay was 4 days (IQR 2–10).
Figure 1.

Total yearly incidence of serious pediatric emergency conditions between 2008 and 2014.
Figure 2.

Annual incidence of individual serious pediatric emergency conditions in 2008 and 2014.
The serious condition with both the greatest relative and absolute incidence increases was anaphylaxis, with incidence increasing 147% (95% CI 141–154), from 101 to 249 ED visits per million person-years. Children with anaphylaxis had a 2014 hospitalization rate of 9.2%, median ED charge of $1299 (IQR 725–2257), and median hospital length of stay of 1 day (IQR 1–2).
Discussion
In a nationally representative cohort, the annual incidence of serious emergency conditions presenting to EDs did not differ significantly between 2008 and 2014. However, increases in some conditions have been counterbalanced by decreases in others including serious trauma. Respiratory conditions, chiefly respiratory failure and insufficiency, represent approximately one third of the most serious childhood ED visits and increased by 18% over six years. Although children develop a wide variety of serious conditions, most are exceedingly rare. Targeting a small subset of these rare conditions would be unlikely to impact overall pediatric morbidity and mortality. However, decreasing the burden of childhood serious respiratory disease would likely have a large impact on pediatric morbidity and mortality in the US.
Anaphylaxis was the fastest-rising serious condition. The rapid rise in anaphylaxis diagnoses cannot be explained by a rise in overall ED visits. The cause is likely multi-factorial, reflecting a rising prevalence of children with allergic disease, improved recognition of anaphylaxis, and changes in diagnosis coding practices.7 Anaphylaxis is the most immediately life-threatening allergic condition, and devoting resources to the treatment and prevention of anaphylaxis will become more pressing as its incidence rises.
Limited resources for emergency care should be allocated to diseases with the highest morbidity and burden. Assessing incidence trends provides a means to identify those diseases to which targeted resources would benefit the most children. Although readiness of US EDs to care for children is improving, there are still gaps in availability of pediatric equipment, training, and ED processes.8,9 Efficient utilization of these resources should be directed toward the care of acute respiratory conditions.
This report is limited by an absence of clinical data to confirm patient diagnoses, which in particular could have led to overestimation of the increase in anaphylaxis cases. In addition, charges are an approximation of actual costs and do not always accurately represent true cost.
Acknowledgments
This project was supported by grant number T32HS000063 from the Agency for Healthcare Research and Quality. The content is solely the responsibility of the authors and does not necessarily represent the official views of the Agency for Healthcare Research and Quality.
Funding
Dr. Michelson was supported by grant number T32HS000063 from the Agency for Healthcare Research and Quality.
Footnotes
This work was presented at the Pediatric Academic Societies Meeting in San Francisco, CA on May 8, 2017.
References
- 1.Tang N, Stein J, Hsia RY, Maselli JH, Gonzales R. Trends and characteristics of US emergency department visits, 1997–2007. JAMA. 2010;304(6):664–70. doi: 10.1001/jama.2010.1112. [DOI] [PMC free article] [PubMed] [Google Scholar]
- 2.National Hospital Ambulatory Medical Care Survey: 2010 Emergency Department Summary Tables [Internet] [cited 2016 Jul 11];2010 Available from: http://www.cdc.gov/nchs/data/ahcd/nhamcs_emergency/2010_ed_web_tables.pdf.
- 3.Gindi RM, Jones LI. Reasons for emergency room use among U.S. children: National Health Interview Survey, 2012. NCHS Data Brief. 2014;(160):1–8. [PubMed] [Google Scholar]
- 4.Healthcare Cost and Utilization Project. NEDS Overview [Internet] [cited 2017 Feb 7];2017 Available from: https://www.hcup-us.ahrq.gov/nedsoverview.jsp.
- 5.Alessandrini EA, Alpern ER, Chamberlain JM, Shea JA, Holubkov R, Gorelick MH. Developing a diagnosis-based severity classification system for use in emergency medical services for children. Acad Emerg Med. 2012;19(1):70–8. doi: 10.1111/j.1553-2712.2011.01250.x. [DOI] [PubMed] [Google Scholar]
- 6.Alessandrini EA, Alpern ER, Chamberlain JM, Shea JA, Gorelick MH. A new diagnosis grouping system for child emergency department visits. Acad Emerg Med. 2010;17(2):204–13. doi: 10.1111/j.1553-2712.2009.00635.x. [DOI] [PubMed] [Google Scholar]
- 7.Jackson KD, Howie LD, Akinbami LJ. Trends in Allergic Conditions Among Children: United States, 1997–2011. NCHS Data Brief. 2013;(121):1–8. [PubMed] [Google Scholar]
- 8.Gausche-Hill M, Ely M, Schmuhl P, et al. A national assessment of pediatric readiness of emergency departments. JAMA Pediatr. 2015;169(6):527–34. doi: 10.1001/jamapediatrics.2015.138. [DOI] [PubMed] [Google Scholar]
- 9.Ginde AA, Sullivan AF, Camargo CA. National Study of the Emergency Physician Workforce, 2008. Ann Emerg Med. 2009;54(3):349–59. doi: 10.1016/j.annemergmed.2009.03.016. [DOI] [PubMed] [Google Scholar]


