

Abstract
Slc39a8 encodes ZIP8, a divalent cation/bicarbonate symporter expressed in pluripotent mouse embryonic stem cells, and therefore ubiquitous in adult tissues; ZIP8 influxes Zn2+, Mn2+ and Fe2+. Slc39a8(neo/neo) knockdown mice exhibit 10–15% of wild-type ZIP8 mRNA and protein levels, and show pleiotropic phenotype of stunted growth, neonatal lethality, multi-organ dysmorphogenesis, and dysregulated hematopoiesis manifested as severe anemia. Herein we performed RNA-seq analysis of gestational day (GD)13.5 yolk sac and placenta, and GD16.5 liver, kidney, lung, heart and cerebellum, comparing Slc39a8(neo/neo) with Slc39a8(+/+) wild-type. Meta-data analysis of differentially-expressed genes revealed 29 unique genes from all tissues — having enriched GO categories associated with hematopoiesis and hypoxia and KEGG categories of complement, response to infection, and coagulation cascade — consistent with dysregulated hematopoietic stem cell fate. Based on transcription factor (TF) profiles in the JASPAR database, and searching for TF-binding sites enriched by Pscan, we identified numerous genes encoding zinc-finger and other TFs associated with hematopoietic stem cell functions. We conclude that, in this mouse model, deficient ZIP8-mediated divalent cation transport affects zinc-finger (e.g. GATA proteins) and other TFs interacting with GATA proteins (e.g. TAL1), predominantly in yolk sac. These data strongly support the phenotype of dysmorphogenesis and anemia seen in Slc39a8(neo/neo) mice in utero.
Introduction
Starting with a Cd2+-induced testicular necrosis phenotype and genetically “sensitive” vs “resistant” inbred mouse strains, this laboratory identified Slc39a8 (encoding the ZIP8 transporter) as the major gene responsible for this trait1–3. ZIP8 functions as a Zn2+/(HCO3−)2, Mn2+/(HCO3−)2 or Cd2+/(HCO3−)2 symporter, in each case moving all three ions of the complex into the cell in an electroneutral manner4. ZIP8 has also been shown to import divalent iron and cobalt5. Moreover, ZIP8 transports selenium in the form of selenite into the cell — presumably as a Zn2+/(HCO3−)(HSeO3−) electroneutral complex6. In mammalian cell and Xenopus oocyte cultures, Mn2+ and Fe2+ are able to substitute for the Zn2+ cation5,7,8. It is possible that metal-ion specificity of ZIP8-mediated uptake in the intact animal might be dependent on organ and/or cell-type.
Developmentally, ZIP8 is expressed in mouse visceral endoderm at gestational day (GD)7.5 [ref.9], in the gastrula stage10, and in pluripotent embryonic stem cells11. These findings are compatible with the observation of early embryolethality, seen in Slc39a8(−/−) knockout mice when the gene is globally 100% ablated12.
During creation of a Slc39a8 conditional knockout construct12, the Frt-flanked neomycin-resistance mini-gene neo (transcribed in reverse orientation) was inserted into intron 3, combined with loxP sites in introns 3 and 6. Fortuitous retention of the neo mini-cassette produced a unique hypomorph displaying 10–15% of wild-type levels of ZIP8 mRNA and protein in all tissues examined1–3. The Slc39a8(neo/neo) mouse has been extensively characterized: pleiotropic effects include stunted growth, neonatal lethality, shortened limbs and deformed skull, severe anemia, dysregulation of hematopoiesis, and multi-organ dysmorphogenesis; consistent with the severe anemia — striking decreases in size of placenta, and size and number of hematopoietic islands are seen in Slc39a8(neo/neo) GD13.5 yolk sac and placenta, as well as in GD16.5 liver13.
A Slc39a8 inducible-global knockout and a Slc39a8 hepatocyte-specific conditional knockout, created independently, exhibited striking decreases in Mn2+ concentrations in multiple organs tested; authors also found lowered levels of two Mn2+-dependent enzymes – arginase and β-1,4-galactosyltransferase activities – and evidence that hepatic ZIP8 rescues Mn2+ from bile and regulates whole-body Mn2+ homeostasis14. The Slc39a8 global knockout shows striking cardiac extracellular matrix accumulation, suggesting that Slc39a8 expression is essential for development of ventricular compaction15.
These mouse data1–16, summarized in Table 1, underscore the likely fundamental importance of ZIP8-mediated physiological functions in a large variety of tissues and cell-types. The gene was originally discovered in human monocytes17. More recently, a growing number of clinical studies of SLC39A8 variants have shown the pleiotropic effect of deficient ZIP8 function: during early development18–20 and in liver14,18,19, kidney21, lung22–25, heart/cardiovascular system21,26–31, whole blood32, immune system17,22–25, brain20,33,34 including cerebellum18,19, eye35, gastrointestinal tract36, and musculoskeletal system18,19,37,38 (Table 1). In the present study, we chose to carry out RNA-seq analysis on seven tissues: GD13.5 yolk sac and placenta, plus GD16.5 fetal liver, kidney, lung, heart and cerebellum.
Table 1.
Properties and phenotypes reported, to date, for mammalian SLC39A8 gene.
| Organ or system | Properties/Phenotypes of mammalian SLC39A8 gene (and its encoded ZIP8 transporter) | References |
|---|---|---|
| Systemic | Mouse ZIP8 transports Zn2+, Mn2+, Cd2+/and probably Fe2+ and Co2+ — each presumanly as a M++/(HCO3−)2 electroneutral complex, moving ions into the cell; Slc39a8(neo/neo) knockdown fetus exhibits stunted growth, and neonatal lethality; Human SLC39A8 regulates manganese homeostasis and manganese-dependent enzyme activities, posttranslational glycosylation, and causes mitochondrial disorders; Mouse ZIP8 is required for Mn2+-dependent enzyme activities; Human SLC39A8 variant associated with increased body mass index | 2, 4, 5, 7, 13, 14, 19, 20, 32, 79 |
| Developmental | Mouse Slc39a8 expressed in visceral endoderm at gestational day (GD)7.5, in the gastrula at earlier development, and expressed in pluripotent embryonic stem cells; Mouse Slc39a8(neo/neo) global knockout is early embryo-lethal; Slc39a8(neo/neo) knockdown fetus exhibits multi-organ dysmorphogenesis and decreases in size of placenta | 9– 13, 18– 20, 80 |
| Liver | Mouse Slc39a8(neo) allele is associated with highly significantly decreased liver size; Mouse ZIP8 transports selenium, presumably as a Zn2+/(HCO3−)(HSeO3−) electroneutral complex; Mouse hepatic ZIP8 rescues Mn2+ from bile, regulates whole-body Mn2+ homeostasis, and modulates activity of Mn2+-dependent enzymes | 6, 13, 14, 18, 19 |
| Kidney | Mouse Slc39a8(neo) allele is associated with highly significantly decreased kidney size; Human SLC39A8 variant associated with blood pressure | 13, 21 |
| Lung | Mouse Slc39a8(neo) allele is associated with highly significantly decreased lung size; Human ZIP8 participates in Zn2+-mediated cytoprotection in lung inflammation | 13, 22, 23 |
| Cardiovascular system | Mouse Slc39a8(neo/neo) knockdown fetus shows trenda toward enlarged heart size; Human SLC39A8 variant associated with increased serum lipid levels, regulation of blood pressure, and risk of coronary artery disease; Human SLC39A8 variant associated with increased risk of acute coronary syndrome; Human SLC39A8 variant associated with increased risk of increased atherosclerosis in smokers; Mouse Slc39a8 is essential for cardiac ventricular compaction | 13, 15, 21, 26– 31 |
| Blood chemistry | Mouse Slc39a8(neo/neo) neonate shows significantly decreased total iron, total iron-binding capacity, serum ALT & AST levels,b and serum triglyceride levels; Human SLC39A8 variant associated with blood levels of toxic metals | 13, 32 |
| Hematological system | Mouse Slc39a8(neo/neo) knockdown fetus exhibits severe anemia and dysregulation of hematopoiesis; Slc39a8(neo/neo) GD13.5 yolk sac and placenta shows smaller size and number of hematopoietic islands; Slc39a8(neo/neo) GD16.5 liver reveals decreased size and number of hematopoietic islands | 13 |
| Immune system | ZIP8 originally discovered in human monocytes; Human ZIP8 participates in Zn2+-mediated immune response to inflammation, participates in innate immune response to endotoxin-induced macrophage inflammation, and host response in macrophages to Mycbacterium tuberculosis | 17, 22– 25 |
| Central nervous system | Mouse Slc39a8(neo/neo) knockdown fetus shows trenda in smaller size of cerebrum and cerebellum; Human SLC39A8 variant associated with increased risk of schizophrenia; Human SLC39A8 variant associated with impaired intellectual ability and cerebellar atrophy | 13, 18– 20, 33, 34 |
| Eye | Human SLC39A8 variant associated with retinal iron accumulation | 35 |
| Spleen | Mouse Slc39a8(neo) allele is associated with highly significantly decreased spleen size | 13 |
| Gastrointestinal tract | Human SLC39A8 variant associated with Crohn disease and human gut microbiome composition | 36 |
| Musculoskeletal system | Mouse Slc39a8(neo/neo) knockdown fetus exhibits shortened limbs, and deformed skull; Human SLC39A8 variant associated with pathogenesis of osteoarthritis; Human SLC39A8 variant associated with severe limb malformations | 13, 18, 19, 37, 38 |
| Reproductive system | Mouse Slc39a8 variant is associated with Cd2+-induced testicular necrosis | 1– 3, 16 |
aThe term “trend’” denotes P-value > 0.05 < 0.10.
bALT, alanine aminotransferase (common measurement used to assess damage largely in liver); AST, aspartate aminotransferase (common measurement used to assess damage in heart, skeletal muscle, kidney and brain, as well as liver.
Results
Phenotype
Compared with Slc39a8(+/+) wild-type, the Slc39a8(neo/neo) fetuses and newborns were remarkably abnormal with dysmorphogenesis and severe anemia (Fig. 1); even placenta and yolk sac showed gross anemia13.
Figure 1.

Phenotype of Slc39a8(+/+), Slc39a8(+/neo), and Slc39a8(neo/neo) littermates. (A) GD16.5 pups with corresponding placentas below. Slc39a8(neo/neo) mice were remarkably abnormal – showing deformed skull and shortened limbs, as well as severe anemia, from the time during development that an embryonal sac can first be observed. (B) Newborns, postnatal day 1 – shortly before death of the Slc39a8(neo/neo) homozygote. Compared with Slc39a8(+/+) wild-type and Slc39a8(+/neo) heterozygotes that are pink in color and normal in size, the Slc39a8(neo/neo) littermates are extremely pale, show stunted growth, and deformed skulls and limbs. Slc39a8(neo/neo) liver, kidney, lung, spleen, cerebrum and cerebellum were all statistically significantly smaller in size than that in Slc39a8(+/+) or Slc39a8(+/neo) littermates13. For the RNA-seq analysis described herein, Slc39a8(+/neo) littermates were not studied.
Analysis of differentially-expressed genes in individual tissues
Differential-expression analysis started with low-expression filtering, following which 6,249 genes were removed and 17,163 genes retained (having CPM >1 in at least three samples). The number of significant differentially-expressed genes (Table 2) included 15 in yolk sac, two in placenta, one in liver, 13 in lung, but none in kidney, heart and cerebellum. Two genes (Adh7 and Zbtb8b) encode Zn2+-containing proteins. A heat map (Supplementary Data Figure S1) shows intensities of each gene expression.
Table 2.
Genes differentially regulated with FDR < 0.1, when comparing Slc39a8(neo/neo) with Slc39a8(+/+) wild-type.
| Gene symbol | Official gene name | Average expression (RPKM)a | Fold-Change | log2 Fold-Change | P val | P adj |
|---|---|---|---|---|---|---|
| GD13.5 YOLK SAC | ||||||
| b Gbp1 | guanylate-binding protein 1 | 15.1 | 19.23456 | +4.265629 | 5.00E-05 | 0.070067 |
| Stc2 | stanniocalcin 2 | 28.3 | 15.36555 | 3.941627 | 1.25E-12 | 8.15E-09 |
| 2610528A11Rik | RIKEN cDNA 2610528A11 gene | 20.3 | 14.19895 | 3.827712 | 7.79E-10 | 3.05E-06 |
| Gm853 | predicted gene 853 | 17.5 | 9.210799 | 3.203326 | 1.74E-07 | 0.000487 |
| Igfbp1 | insulin-like growth factor-binding protein 1 | 248.6 | 7.475471 | 2.902165 | 2.08E-14 | 4.08E-10 |
| c Adh7 | alcohol dehydrogenase 7 (class IV), μ or σ polypeptide | 41.1 | 7.286177 | 2.865162 | 1.67E-10 | 8.20E-07 |
| c Zbtb8b | zinc-finger and BTB domain-containing 8b | 22.7 | 5.996628 | 2.584151 | 2.51E-05 | 0.037875 |
| Pkhd1l1 | polycystic kidney and hepatic disease 1-like 1 | 246.1 | 4.879078 | 2.286609 | 1.09E-12 | 8.15E-09 |
| Lancl3 | LanC lantibiotic synthetase component C-like 3 (bacterial) | 24.0 | 4.443403 | 2.151665 | 2.22E-05 | 0.037875 |
| Reln | Reelin | 63.4 | 4.442197 | 2.151274 | 7.02E-05 | 0.091747 |
| Egln3 | EGL nine homolog 3 (C. elegans) | 97.8 | 4.218064 | 2.076581 | 4.61E-09 | 1.51E-05 |
| b Hemgn | Hemogen | 56.0 | 3.825722 | +1.935732 | 5.02E-07 | 0.001095 |
| Slc30a10 | solute carrier family 30, member 10 | 38.1 | 3.592453 | +1.844969 | 2.38E-05 | 0.037875 |
| Vldlr | very-low-density lipoprotein receptor | 278.3 | 3.005814 | 1.587756 | 2.19E-07 | 0.000538 |
| b Hbb-y | hemoglobin Y, beta-like embryonic chain | 19218.6 | 0.306581 | −1.70566 | 2.09E-06 | 0.0041 |
| GD13.5 PLACENTA | ||||||
| b Hemgn | hemogen | 72.1 | 18.87205 | +4.238179 | 2.15E-06 | 0.045538 |
| b Gbp1 | guanylate-binding protein 1 | 51.3 | 5.689857 | 2.508392 | 6.52E-06 | d 0.069045 |
| GD16.5 LIVER | ||||||
| 6030408B16Rik | RIKEN cDNA 6030408B16 gene | 693.3 | 0.179781 | −2.47569 | 3.07E-06 | d 0.061137 |
| GD16.5 KIDNEY | ||||||
| NO SIGNIFICANT GENES FOUND | ||||||
| GD16.5 LUNG | ||||||
| b Afp | alpha-fetoprotein | 569.1 | 0.256586 | −1.96249 | 5.30E-06 | 0.008782 |
| Ahsg | alpha-2-HS-glycoprotein | 68.3 | 0.241724 | −2.04857 | 6.85E-07 | 0.001512 |
| Pzp | pregnancy-zone protein | 121.7 | 0.234948 | −2.08958 | 2.53E-06 | 0.005029 |
| Serpina1c | serine (or cysteine) peptidase inhibitor, clade A, member 1C | 25.8 | 0.224163 | −2.15738 | 2.67E-05 | 0.040878 |
| b Fgg | fibrinogen γ-chain | 125.3 | 0.210643 | −2.24712 | 1.10E-08 | 5.47E-05 |
| Serpina1b | serine (or cysteine) preptidase inhibitor, clade A, member 1B | 40.9 | 0.210225 | −2.24999 | 4.19E-07 | 0.001042 |
| Ttr | transthyretin | 61.2 | 0.209949 | −2.25189 | 8.56E-08 | 0.000272 |
| b Kng1 | kininogen 1 | 41.5 | 0.196759 | −2.34550 | 9.57E-08 | 0.000272 |
| b Fgb | fibrinogen β-chain | 96.2 | 0.195113 | −2.35762 | 1.06E-10 | 2.11E-06 |
| b Fga | fibrinogen α-chain | 90.3 | 0.191209 | −2.38678 | 3.55E-10 | 3.53E-06 |
| Serpina6 | serine (or cysteine) peptidase inhibitor, clade A, member 6 | 72.8 | 0.170657 | −2.55083 | 4.07E-09 | 2.70E-05 |
| b Ambp | α1-microglobulin/bikunin | 15.3 | 0.088155 | −3.50381 | 3.98E-06 | 0.007188 |
| Itih3 | inter-α trypsin inhibitor, heavy chain 3 | 25.2 | 0.084581 | −3.56353 | 2.61E-08 | 0.000104 |
| GD16.5 HEART | ||||||
| NO SIGNIFICANT GENES FOUND | ||||||
| GD16.5 CEREBELLUM | ||||||
| NO SIGNIFICANT GENES FOUND | ||||||
aRPKM, “number of Reads-Per-Kilobase-of-transcript-per-Million mapped reads”.
bGenes that are erythropoiesis- and hypoxia-related – including those involved in iron transport; these also include all platelet and white-cell types and functions because all are derived from hematopoietic stem cells.
cThese two genes encode Zn2+-containing proteins. ADH7 is an enzyme, and ZBTB8B is a Zn2+-finger TF.
dAlthough 31 genes are listed, these two are not statistically significant (i.e. P > 0.05 when Padj is taken into account).
In order to get sufficient numbers of differentially-expressed genes, a relaxed cut-off was used (significant at P < 0.05 and absolute fold-change >2) for all statistical functional enrichment analyses. KEGG pathways affected by differentially-expressed genes comprised: in yolk sac, two (“malaria” and “African trypanosomiasis”) down-regulated in Slc39a8(neo/neo) compared with wild-type; in kidney one down-regulated (“tight junction”); and in lung two down-regulated (“complement” and “coagulation cascades”) and one up-regulated (“Staphylococcus aureus infection”). Significant KEGG categories included “complement”, “response to infection”, and “coagulation cascade”. All these pathways are consistent with ZIP8 deficiency causing dysregulated hematopoietic stem cell fate in Slc39a8(neo/neo).
Global Transcriptome Analysis
RNA-seq analysis confirmed that expression intensities are distinctly different across the seven tissues examined (Fig. 2). Subsequently, global analysis revealed that the number of significantly differentially-expressed genes totaled 695 for all tissues combined (Supplemental Table S1). There were 646 unique genes. Gbp1 (guanylate-binding protein-1) was found differentially-expressed in five tissues; there were six genes in three tissues (Fig. 3A), and 33 genes in two tissues (Fig. 3B). This resulted in 40 genes (including Slc39a8) differentially-expressed in more than one tissue (Supplemental Table S2). The remaining 606 genes were differentially-expressed in only one tissue. Notable among the 40 genes are four Slc genes (other than Slc39a8) and two hemoglobin genes.
Figure 2.
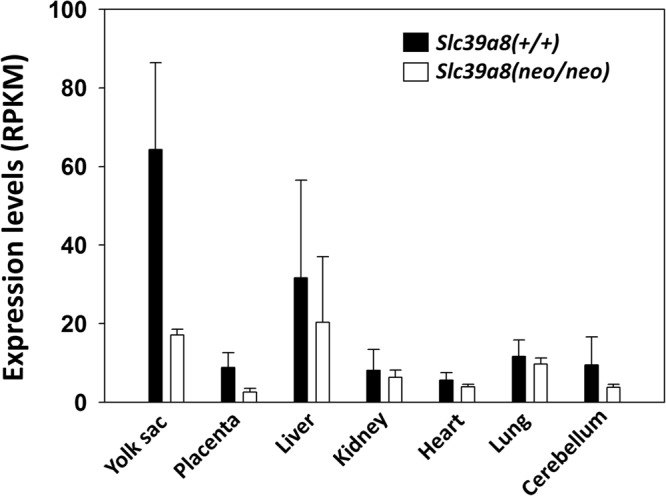
Characterization of Slc39a8(+/+) wild-type vs Slc39a8(neo/neo) mRNA expression levels in the seven tissues studied. Expression levels are indicated by RPKM, or “number of Reads-Per-Kilobase-of-transcript-per-Million mapped reads.” This analysis takes into account the number of reads, normalized to size of the library, and transcriptional length of each gene. In all tissues, expression levels in Slc39a8(neo/neo) samples were lower than those in Slc39a8(+/+) wild-type. Bars represent average mean values of three determinations, and brackets denote S.E.M.
Figure 3.

Heat maps plotting log2 fold-changes (FC) in differential expression. Using a cut-off of P < 0.05, and requiring absolute fold-change of >2.0, the Slc39a8 gene is also included. (A) Differentially-expressed genes in at least three tissues. (B) Differentially-expressed genes in at least two tissues. Two hemoglobin genes were significantly differentially down-regulated in all tissues except liver.
More than 80 differentially-expressed genes (Supplemental Table S1) were associated with hematopoiesis- and hypoxia-related functions (red font); these include all myelogenesis functions (e.g. cytokines, interferons, innate immunity, and inflammatory functions), because all are derived from hematopoietic stem cells. During mouse in utero development, hematopoiesis transitions from the aorta-gonad-mesonephros (AGM) region and yolk sac (between GD8 and GD13), then to liver (GD11 to GD20), and also to spleen (after GD15.5), and finally to bone marrow after GD17.5. Mouse (but not human) placenta is also a hematopoietic organ39.
Many other classes of genes that are seen (Supplemental Table S1) — includes those encoding: Zn2+-finger transcription factors (TFs) and homeobox and other very-early-embryonic functions associated with cell cycle and cell division; other Zn2+-containing proteins; proteins that are posttranslationally glycosylated; enzymes that participate in lipid and glucose homeostasis; growth factors (including several oncogenes and proto-oncogenes); and G-protein-coupled receptors. Nine cytochrome P450 (Cyp) genes, and 27 solute carrier (Slc) genes other than Slc39a8, were observed; explanations and speculations about members of these two gene superfamilies are discussed in Supplemental Table S1.
Systematic meta-analysis
Assuming each tissue is independent from all other tissues, we searched for differentially-expressed genes that tend to change in the same direction in all tissues. A meta-analysis based on Fisher’s combined probability test was applied to integrate empirical P-values across all tissues. Forty-seven genes tended to be consistently up- or down-regulated in all tissues (Supplemental Table S3). Not surprisingly, Slc39a8 was the most consistently down-regulated gene in all seven tissues with a combined P-value of 3.5e–04 after FDR adjustment. Six hemoglobin genes were also significantly down-regulated. Heat maps illustrate the 45 down-regulated genes in all tissues (Fig. 4A), and the two up-regulated in all tissues (Fig. 4B).
Figure 4.

Heat maps, plotting log2 fold-changes (FC). A FDR-adjusted meta-P-value of <0.1 was used. (A) Forty-five differentially-expressed genes that are consistently down-regulated in all tissues. (B) The two differentially-expressed genes that are consistently up-regulated in all tissues.
Among the statistically significant 45 genes being down-regulated, significantly enriched GO categories included: [a] “oxygen carrier activity” (GO:0005344) with Hbb-b1, Hbb-b2, and Hbb-y; [b] “homeostatic processes” (GO:0042592) with Ahsg, Apob, Bpgm, Cps1, Dcn, Gpr65, Hba-a1, Hba-a2, Hbb-b1, Hbb-b2, Otc, Slc25a37, Slc39a8, Slc4a1, Slc8a1, and Snca; and [c] “hemoglobin complexes” (GO:0005833) with Hba-a1, Hba-a2, Hbb-b1, Hbb-b2, Hbb-bs, Hbb-y. The down-regulated genes in GO categories GO:0005344 and GO:0005833— plus the four hemoglobin genes included in GO:0042592 category — provide further evidence indicating that globally diminished ZIP8-mediated function results in dysregulated essential hematopoiesis, leading to hypoxia.
Analysis of transcription factor (TF)-binding sites in genes identified by meta-analysis
Meta-analysis assumes there is a common impact of markedly decreased ZIP8 expression, genome-wide, across all tissues. Transcription is the first step in gene expression, and transcription is modulated by interaction of TFs, having their corresponding binding-sites within specific DNA modules of expressed genes.
After removing Slc39a8 from Pscan and searching for JASPAR TF motifs in promoter regions, and using a Bonferroni-corrected P-value of <0.1, among the “consistently down-regulated genes” discovered by meta-analysis (Supplementary Table S3), we found only two significant motifs — the Tal1::Gata1 heterodimer (JASPAR ID: MA0140.1) and Nfya (JASPAR ID: MA0060.1). TAL1 and GATA are of critical importance (vide infra). NFYA transcription factors participate in open chromatin of many types of stem cells — participating in differentiation, cell-cycle and transcriptional regulators, splicing and signaling factors, fatty acid and glucose homeostasis, and mitochondrial regulators40. Searching for JASPAR TF-binding sites, using the same criterion for the two “consistently up-regulated genes” (Supplemental Table S3), we found no significant motifs.
Analysis of TF-binding sites in individual tissues
Yolk Sac
Based on TF profiles in the JASPAR database, we searched in yolk sac for TF-binding sites enriched by Pscan (Table 3). We found nine up- and down-regulated genes having TF-binding sites significantly enriched in promoters: Plag1, Arnt, Hif1a, Znf423, Klf13, Sp1, Gata1, Gata2, and Gata4. Note that several TF-binding sites are duplicates with different matrix ID numbers. It is noteworthy that – except for Arnt and Hif1a, associated with the downstream hypoxic response [reviewed in41] — the remaining seven are Zn2+-finger TFs.
Table 3.
Significant transcription factor (TF)-binding sites in genes having differential-expression at P < 0.05 and absolute fold-change >2; TF-binding site enrichment by Pscana.
| TF Nameb | Matrix ID | Z Score | P-value | Bonferroni P-value |
|---|---|---|---|---|
| UP-REGULATED IN YOLK SAC | ||||
| Plag1 | MA0163.1 | 5.12465 | 1.42E-07 | 9.00E-05 |
| Arnt::Hif1a | MA0259.1 | 5.09355 | 1.67E-07 | 0.000105754 |
| Znf423 | MA0116.1 | 4.17542 | 1.43E-05 | 0.009050338 |
| Klf13 | MA0657.1 | 4.16993 | 1.45E-05 | 0.009184069 |
| Sp1 | MA0079.3 | 4.04080 | 2.60E-05 | 0.016508603 |
| Glis3 | MA0737.1 | 3.69324 | 0.000107782 | 0.06844157c |
| DOWN-REGULATED IN YOLK SAC | ||||
| Gata4 | MA0482.1 | 4.80921 | 7.39E-07 | 0.000469005 |
| Gata1 | MA0035.3 | 4.57615 | 2.31E-06 | 0.001464596 |
| Gata1 | MA0035.2 | 4.12192 | 1.84E-05 | 0.011684635 |
| Gata2 | MA0036.2 | 3.84142 | 5.99E-05 | 0.03805663 |
| UP-REGULATED IN KIDNEY | ||||
| Prdm1 | MA0508.1 | 3.81093 | 6.77507E-05 | 0.04302169 |
| DOWN-REGULATED IN LUNG | ||||
| Hnf4a | MA0114.2 | 5.94132 | 1.30E-09 | 8.25E-07 |
| Hnf4g | MA0484.1 | 5.47657 | 2.01E-08 | 1.28E-05 |
| Foxa2 | MA0047.1 | 5.37203 | 3.64E-08 | 2.31E-05 |
| Hnf4a | MA0114.3 | 5.29283 | 5.63E-08 | 3.57E-05 |
| Hnf1b | MA0153.1 | 5.20468 | 9.09E-08 | 5.77E-05 |
| Hnf1a | MA0046.1 | 4.93196 | 3.75E-07 | 0.000238357 |
| Foxa1 | MA0148.1 | 4.85155 | 5.82E-07 | 0.000369529 |
| Foxa1 | MA0148.2 | 4.83018 | 6.48E-07 | 0.000411578 |
| Hnf1b | MA0153.2 | 4.7235 | 1.09E-06 | 0.000694766 |
| Hnf4a | MA0114.1 | 4.64095 | 1.64E-06 | 0.001038854 |
| Hnf1a | MA0046.2 | 4.51127 | 3.06E-06 | 0.00194136 |
| Cux1 | MA0754.1 | 4.01251 | 2.88E-05 | 0.018313464 |
| Cux2 | MA0755.1 | 3.9537 | 3.70E-05 | 0.02347703 |
| Foxa2 | MA0047.2 | 3.85396 | 5.64E-05 | 0.035813048 |
| Foxa1 | MA0148.3 | 3.72288 | 9.58E-05 | 0.060801885c |
| Cebpe | MA0837.1 | 3.677 | 0.00011437 | 0.072621775c |
| Bhlha15 | MA0607.1 | 3.60496 | 0.00015141 | 0.09614281c |
| Rxrg | MA0856.1 | 3.60157 | 0.00015358 | 0.097521395c |
| UP-REGULATED IN HEART | ||||
| Ebf1 | MA0154.2 | 3.90828 | 4.56688E-05 | 0.02899969 |
aUsing this rigorous method of analysis, we found no significant TF-binding sites in placenta, liver or cerebellum.
bTF name denotes the TF-binding site(s) enriched by Pscan.
cAlthough 30 enriched TF-binding sites are listed, these five are not statistically significant (i.e. P > 0.05 when the Bonferroni-corrected P-value is taken into account).
Pleomorphic adenoma gene-1 (Plag1) is one of three members in the PLAG family and is best known as an oncogene associated with certain cancers, most notably pleiomorphic tumors of salivary gland; PLAG1 participates in cell proliferation by directly regulating numerous target genes, including growth factors42. With regard to Znf423, Klf13 and Sp1 — there are about 515 Znf genes, 18 Klf genes, and nine Sp genes in mammalian genomes [https://www.genenames.org/]. With regard to Gata1, Gata2 and Gata4 — GATA factors (vide infra) are central to hematopoietic stem cell fate [reviewed in43].
Lung
We found 11 significant TF-binding sites in significantly enriched in promoters of up- and down-regulated genes (Table 3): Hnf4a, Hnf4g, Foxa2, Hnf1b, Hnf1a, Foxa1, Cux1, Cux2, Cebpe, Bhlha15, and Rxrg. Of these 11 genes, the four Hnf genes encode Zn2+-finger TFs. The hepatocyte nuclear factor (Hnf) family comprises four members that contribute to innumerable critical-life processes. Forkhead genes, which previously had been termed Hnf genes, are now officially called Foxa1, Foxa2, Foxa3 and Foxm1 [https://www.genenames.org/]. Cux genes code for evolutionarily highly conserved homeobox-domain proteins44. With regard to Cebpe, Bhlha15 and Rxrg — CEBPE is a leucine-zipper TF associated with several myelogenous leukemias45, BHLHA15 is a member of the basic-helix-loop-helix (bHLH) family of TFs involved in numerous developmental programs46, and RXRG is a member of the nuclear receptor superfamily that also participates in many morphogenesis processes47.
Kidney
Prdm1 was the only TF-binding site significantly enriched in promoters of up- and down-regulated genes (Table 3). Prdm1 acts as a tumor suppressor gene involved in B-cell and T-cell lymphomas48; the PRDM family contains 15 members of epigenetic regulators that participate in autoimmune diseases and infections49.
Heart
Ebf1 was the only TF-binding site significantly enriched in promoters of up- and down-regulated genes (Table 3). EBF1 is regarded as a master regulator during B-cell differentiation and also plays a role in B-cell malignancies50.
Placenta, liver, and cerebellum
We found no statistically significant TF-binding sites as significantly enriched in promoters of up- and down-regulated genes in these tissues.
Discussion
Because ZIP8 is a known uptake transporter of Zn2+, Mn2+ and Fe2+ — functions of these divalent cations are briefly reviewed.
Zinc
Intracellular Zn2+ is critical in homeostasis-related signal transduction51, cell cycle and proliferation52, numerous processes that occur during development and differentiation, and maintenance of many Zn2+-requiring functions. In mammals there are >100 Zn2+-dependent enzymes53 and >2,000 Zn2+-containing TFs54. An independent analysis estimated there are ~2,800 Zn2+-binding proteins, corresponding to ~10% of the human proteome55. Because these enzymes and TFs carry out vital critical-life functions throughout development — often exerting cell-specific effects on morphogenesis, growth, and differentiation — an embryo’s ability to uphold Zn2+ homeostasis is essential from the single-cell-zygote stage onward56. Thus, when Slc39a8(neo/neo) is compared with Slc39a8(+/+), it is likely that many genes listed in Supplemental Table S1 are differentially-expressed as a direct, or indirect, manifestation of deficient ZIP8-mediated Zn2+ transport.
Manganese
Mn2+ is also a potent substrate for ZIP87,16. There are several known defects in ZIP-mediated Mn2+ transport [reviewed in57]. A human SLC39A8 nonsynonymous variant, resulting in decreased ZIP8 transport, impairs the function of Mn2+-dependent enzymes — most notably β1,4-galactosyltransferase, essential for biosynthesis of the carbohydrate moiety of glycoproteins; compromised galactosylation in children causes a disorder with deformed skull, severe seizures, short limbs, profound psychomotor retardation, and hearing loss19. Because numerous proteins are posttranslationally glycosylated, many genes listed in Supplemental Table S1 might be differentially-expressed as a reflection of defective ZIP8-mediated Mn2+ transport. There are no Mn2+-containing TFs.
Iron
ZIP8, along with its closest evolutionarily-related ZIP14 transporter, is a Fe2+-transport protein5,58. These data might be consistent with studies in the intact animal13 — showing that Slc39a8(neo/neo) fetuses exhibit dysregulated hematopoiesis — suggestive of an iron-transport defect. As noted (vide supra), Supplemental Table S1, highlighted in red font, lists >80 differentially-expressed genes associated with dysregulated hematopoietic stem cell fate and subsequent downstream events including hypoxia, when Slc39a8(neo/neo) is compared with wild-type; how many of these genes might reflect the importance of Fe2+ transport more so than Zn2+ transport, will require further studies. Although there are a few Fe2+-containing TFs in prokaryotes59, there are none in eukaryotes.
Emergence of several critical-life genetic networks
By comparing transcriptomes in the present study, specific genetic pathways are noteworthy (vide infra). There are two possibilities to explain emergence of these genetic pathways in response to globally deficient ZIP8-mediated transport. One, perhaps ZIP8-mediated divalent cation transport might be tissue- or cell type-specific — depending upon ZIP8 levels and the abundance of other redundant transport systems in each particular tissue or cell-type. In other words, it is possible that pathways affected by deficient ZIP8-mediated Zn2+ transport might be more significant in lung and kidney, those affected by diminished ZIP8-mediated Mn2+ transport might be more prominent in liver, and those affected by deficient ZIP8-mediated Fe2+ transport might be more important in hematopoietic tissues. Two, it is possible that defective Zn2+ transport, primarily in early-embryo yolk sac, might override (i.e. occur upstream of) Mn2+-dependent and/or Fe2+-dependent gene products and their functions. These two possibilities will require further experiments, but the present study would argue in favor of the latter, i.e. defective Zn2+-finger TFs, primarily in yolk sac, cause irreparable impairment of hematopoietic stem cell fate, which is then manifested — developmentally later — in the five fetal organs studied herein.
Fundamental Importance of TAL1
Tal1 was up-regulated in placenta and down-regulated in kidney (Supplementary Table S2). Differentially-expressed Gata genes were not seen among the 646 unique genes (Supplementary Table S1); this could reflect normal transcription, but then defective function due to its posttranslational Zn2+- and/or Mn2+-binding requirements. After searching JASPAR TF motifs in promoter regions, among “consistently down-regulated genes” by meta-analysis (Supplemental Table S3), we found the Tal1::Gata1 heterodimeric complex (JASPAR ID: MA0140.1) as an important TF-binding motif. This finding is strengthened when we saw that TF-binding sites enriched by Pscan included Gata1, Gata2 and Gata4 in yolk sac (Table 3).
TAL1 is a bHLH TF that plays an important role in hematopoietic stem cell development60. GATA TFs are Zn2+-finger DNA-binding proteins that participate in various biological processes — including hematopoiesis and T-cell development [reviewed in ref.43]. Shifts in TAL1 occupancy of TF-binding sites during erythroid differentiation are associated with gene repression (i.e. dissociation), and activation (i.e. co-occupancy with GATA1); in fact, recruitment by GATA TFs appears to be a stronger determinant of TAL1-binding to chromatin than the canonical E-box binding-site motif 61.
In order to validate the TAL1 result from PScan, we sought to perform an independent statistical test. From a list of manually-curated 80 TAL1-downstream targets62, we intersected the genes in this list with those in Supplemental Table S1 for all tissues (Supplemental Table S4). TAL1 targets were significantly enriched in yolk sac (Fisher’s exact test P = 1.178e–05), placenta (P = 4.982e–06), and marginally enriched in lung (P = 0.01895). Twelve hematopoiesis-related genes were seen, predominantly in yolk sac and placenta. Egln3 was the most strongly up-regulated gene in yolk sac; EGLN3 is a bHLH TF that responds to hypoxia by decreasing the production of HIF-regulated angiogenic factors63. Cbfa2t3 was the most dramatically down-regulated gene in placenta; CBFA2T3 is clinically associated with several types of human leukemia. The only gene seen in heart was Zfpm1; ZFPM1 is a Zn2+-finger TF that (like TAL1) also forms heterodimers with TFs of the GATA family.
Moreover, TAL1 is known to activate Egln3, Hemgn and Ank162, and all were up-regulated in Slc39a8(neo/neo) yolk sac. TAL1 represses Hbb-b262, which was down-regulated in Slc39a8(neo/neo) yolk sac (Supplemental Table S4). These data suggest that TAL1 protein activity might be increased in Slc39a8(neo/neo) yolk sac, whereas Tal1 gene differential expression was not seen. Similarly, in Slc39a8(neo/neo) placenta, Hemgn and Ank1 were up-regulated and Hbb-b2 down-regulated — suggesting that TAL1 protein might also be activated in that tissue.
None of the genes encoding Zn2+-finger TFs listed in Table 3 was differentially expressed to a level seen in Supplemental Table S1, i.e. these genes all appear to be transcribed somewhat normally. Thus, we suggest that, although transcription of these Zn2+-finger genes was within normal limits, only the protein functions of these Zn2+-finger TFs are the result of ZIP8 deficiency; in other words, postttranslational incorporation of Zn2+, and/or deficient posttranslational glycosylation due to diminished Mn2+ levels, did not occur normally.
Fundamental Importance of GATA
The hematopoietically-expressed GATA family members of Zn2+-finger TFs are well known to function as key regulators of blood cell fate; for example, phenotypes of knockout mice — deficient in Gata1, Gata2, or Gata3 — suggest that these factors each play critical, but distinctly different, roles in hematopoiesis64. GATA2 mutations are clinically associated with familial myelodysplastic syndrome65,66, by affecting monocytes and/or B cells.
In order to validate the GATA1 result from Pscan (Table 3), we used a list of 512 GATA1-downstream target genes67; this list includes most of the well-established GATA1-mediated erythroid-specific targets, e.g. the Gata1 gene itself, Gata2, the β-globin locus (specifically the locus-control region), Epor, Nfe2, Slc4a1, Gypa, Tal1, Lrf, Klf1, Nrf2, Runx1 and Alas2. We intersected the genes in this list with those in Supplemental Table S1 for all Slc39a8(neo/neo) tissues (Supplemental Table S5). Yolk sac was the tissue with the most enriched number of GATA1 targets: excluding Slc39a8, there were 13 differentially-expressed GATA1-downstream target genes out of the 512 total (Fisher’s exact test P = 0.001369). These findings provide strong evidence for key involvement of GATA1 in many of the differentially-expressed transcriptomic changes in Slc39a8(neo/neo) yolk sac.
We found no enrichment of GATA1 targets among differentially-expressed genes in liver, kidney, heart or cerebellum. These data convincingly indicate that deficient ZIP8-mediated transport affects hematopoiesis-related processes primarily in yolk sac – as opposed to effects in placenta, or developmentally later, in early fetal liver.
Defective Hematopoiesis Leads to Hypoxia
Throughout our analysis presented herein, dysregulation of hematopoiesis-related stem cell functions is repeatedly described; decreases in hemoglobin content, red blood cell number, and iron uptake would likely elicit a “hypoxia signal” in many cell types – resulting in activation of hypoxic-response downstream-target genes. The striking anemia phenotype, seen in the earliest of visible Slc39a8(neo/neo) yolk sac, placenta, and embryos [Fig. 1 and ref.13], supports these findings.
A list of 87 manually-curated HIF-downstream targets68 has been reported; examples include genes involved in fatty acid and glucose homeostasis, glycolysis pathway, cell proliferation, cell migration, and angiogenesis. We intersected the genes in this list with those in Supplemental Table S1 for all Slc39a8(neo/neo) tissues (Supplemental Table S6). Fifteen differentially-expressed genes were detected in yolk sac (Fisher’s exact test P = 4.206e–15), one in kidney, two in lung, and none in placenta, liver, heart or cerebellum; as expected, all 15 of these were up-regulated (Supplemental Table S6). This independent statistical test confirms our Hif1a result from Pscan (Table 3).
In lung, Abcb1a was up-regulated; Cyp2s1 and Trf down-regulated. ABCB1A (“P-glycoprotein”) is up-regulated in response to many types of stress, including hypoxia69. In the presence of hypoxia, HIF1A/ARNT dimers are known to bind to an aryl hydrocarbon receptor response element (AHRE) upstream of the Cyp2s1 gene70; furthermore, the Arnt::Hif1a heterodimer TF-binding site enriched by Pscan was found to be up-regulated in yolk sac (Table 3). Trf encodes transferrin, which is important in Fe2+ transport71; defective hematopoiesis resulting in anemia and subsequent hypoxia is the likely cause of down-regulation of Trf in lung.
In kidney one HIF-downstream target gene (Met up-regulated) was found. Met, a proto-oncogene, participates in angiogenesis – which would be stimulated by hypoxia72.
Hif1a expression itself was found not to be differentially-expressed in any tissue, whereas Hif3a was up-regulated in yolk sac (Supplementary Table S1). Hif1a and Hif3a in mice encode hypoxia-inducible TF subunits that respond to low oxygen (pO2) levels. Either of these TFs can bind as a heterodimeric complex with constitutively-expressed ARNT (aryl hydrocarbon receptor nuclear translocator), product of the Arnt gene.
Members of the Egl-9 family of HIF-inducible TFs (Egln1, Egln2 and Egln3) were also differentially-expressed (Supplemental Table S1). All six of these above-mentioned genes are members of the bHLH per-Arnt-sim (bHLH/PAS) family of TFs that detect endogenous and exogenous signals; the bHLH/PAS family contains at least 30 members in the human and mouse genomes41. In fact, two other bHLH/PAS differentially-expressed genes (Bhlhe40 & Bhlhe41) were found to be up-regulated in yolk sac (Supplemental Table S1) – again supporting the theme of the Slc39a8(neo/neo) response to hypoxic stress.
Ingenuity Pathway Analysis
An independent Ingenuity Pathway Analysis (IPA) for the 165 differentially-expressed genes in yolk sac (Supplementary Table S7) revealed major pathways that were consistent with the data discussed throughout the text. Specifically, the top candidate from “Upstream Regulators Analysis” was the transcription factor HIF1A, and it is predicted to be activated. The top categories from the “Diseases and Bio Functions Analysis” included “Transport of molecule,” “Morphology of head,” “Glycolysis of cell,” “Morphology of nervous system,” and “Familial hemolytic anemia” — all of which confirms the data presented herein — as well as the associations of human SLC39A8 variants with most if not all of the clinical disorders (vide supra). With a FDR-adjusted P-value < 0.05 from “Canonical Pathway Analysis,” no significant canonical pathways were found.
Conclusions
A summary of many of these differentially-expressed genes, and their resultant effects, elicited by ZIP8 deficiency and described throughout this paper, is offered in Fig. 5.
Figure 5.

Illustration of critically affected genes and their downstream effects that most closely fit the data presented in the present study. ZIP8 deficiency (top), has a major impact on TAL1 and GATA transcription factors (TFs), which appear to function primarily in the hematopoietic stem cells of Slc39a8(neo/neo) GD13.5 yolk sac. This function then causes severe dysregulation of hematopoietic stem cell fate and striking anemia in yolk sac, which is visibly obvious [in Fig. S2 of ref.13]. Moreover, hematopoiesis in yolk sac is well known to precede that in liver and then spleen and marrow [cf. Fig. S4 of ref.13]. Downstream effects, as development proceeds, include severe anemia and defects in coagulation, innate immunity, and response to inflammation. The striking anemia leads to a hypoxia response which is seen in all tissues examined, but largely in yolk sac. TAL1, T-cell acute lymphocytic leukemia protein-1 TF. GATA, family of six zinc-finger TFs that regulate hematopoietic stem cell fate. Interactions between TAL1 and GATA exist61 [see text]. ZIP8-deficiency, plus the result of all these downstream changes, alter the expression of nine Cyp genes and 27 Slc genes (excluding Slc39a8); these changes are mostly unique to one tissue, as detailed in Supplementary Table S1. Δ denotes “changes in”. HIF, hypoxia-inducible factor.
To our knowledge, we know of no studies, reported to date, that dissect the mechanism behind why or how the knockdown of one critically important transporter gene can result in the up- and down-regulation of so many dozens of other transporter genes — and many of the transported moieties are not ions. These intriguing data represent many new avenues of possible experiments for future fascinating studies of whole-genome interactions.
Material and Methods
Animals
Cloning details for generating the viable Slc39a8(+/neo) heterozygous mouse line were described previously12. At 6–10 weeks of age, Slc39a8(+/neo) heterozygous males and females were bred. The morning on which the vaginal plug was found – was considered GD0.5. Individual Slc39a8(+/+), Slc39a8(+/neo) and Slc39a8(neo/neo) yolk sacs and placentas at GD13.5 were collected and genotyped; heterozygotes were discarded. Fetal liver, kidney, lung, heart and cerebellum at GD16.5 were also collected and genotyped.
All mouse experiments were conducted in accordance with the National Institutes of Health standards for the care and use of experimental animals. All experimental protocols were approved by the University of Cincinnati College of Medicine (IACUC) Institutional Animal Care and Use Committee [protocol #11-09-12-01].
Total RNA Extraction
RNeasy Micro kit (Qiagen) was used for total RNA extraction. Each sample, together with Buffer RLT, were added to ceramic-beads (1.4-mm) in tubes and homogenized by using the Precellys homogenizer (Cayman Chemical Company; Ann Arbor, MI). RNA extraction was then performed, following manufacturer’s recommendations.
RNA-Seq for differential gene expression profiling
For each RNA-seq sample, 1 μg RNA was used (which required two or more mice per sample). RNA-seq was performed at the Genomics, Epigenomics and Sequencing Core at the University of Cincinnati. To prepare the RNA library for sequencing, we used TruSeq RNA Library Prep Kit (Illumina; San Diego, CA), according to manufacturer’s instructions. In brief, poly(A+) RNA was purified from total RNA and then fragmented before cDNA synthesis. Double-strand cDNA fragments were then end-repaired and TA-ligated to the sequencing adapter; the specific index was added to the library during the PCR amplification step. After 12 cycles of PCR enrichment, library quality was evaluated by a Bioanalyzer High Sensitivity chip and quantified by Kapa Library Quantification kit (Kapa Biosystem; Wilmington, MA), using the ABI 9700HT real-time PCR system (Thermo Fisher; Waltham, MA). Next, six individually indexed cDNA libraries were pooled in equal amounts for clustering in the cBot system (Illumina). Libraries were clustered onto a flow cell at concentration of 15 pM, using Illumina’s TruSeq SR Cluster Kit v3, and then sequenced for 50 cycles using TruSeq SBS kit on the Illumina HiSeq system. Each sample was expected to generate ~30 million reads.
Bioinformatics analysis
Sequence reads were aligned to the genome by using the standard Illumina sequence analysis pipeline, which was analyzed by the Statistical Genomics and Systems Biology Core at the University of Cincinnati. Analyses included determinations of: [a] RNA-seq data quality control (QC) results; [b] all gene expression levels for the RNA samples; and [c] significantly differentially-expressed genes between the two groups, Slc39a8(neo/neo) vs Slc39a8(+/+). Genes with counts per million (CPM) >1 in at least three samples were used for further analysis. Differential expression analysis was performed using DESeq.73. The Benjamini–Hochberg procedure74 was applied to adjust P-values for False Discovery Rate (FDR). Genes with FDR-adjusted P-values of <0.1 were considered as significantly differentially-expressed.
In addition to differential-expression analysis for individual tissues, meta-analysis was performed to identify genes that tend to change in the same direction across all tissues. The meta-analysis used Fisher’s combined probability test to integrate empirical P-values from all tissues. The empirical P-value for gene i in tissue j is defined as rij = rank(sij)/N, and sij = sign(fij) × [−log10(pij)], where fij is the log2 fold-change of gene i in tissue j, pij the P-value of differential expression of gene i in tissue j, and N the total number of genes. See footnote of Supplemental Table S2 for a detailed description. The empirical P-value, based on gene rank, was less prone to an extreme effect in any individual tissue; thus, it was more robust, when compared with the original P-value from differential analysis. FDR-adjusted P-values of <0.1 were used as the cut-off for genes that tend to be differentially-expressed in all tissues.
Functional analysis of differentially-expressed genes was further performed. Because too few genes were significant at FDR < 0.1, a less-stringent cut-off P-value of <0.05 and absolute fold-change of >2 was used, in order that a sufficient number of differentially-expressed genes could be used for statistical functional enrichment analysis. This would potentially result in a gene list having an increased number of false positives. Therefore, the purpose of the relaxed cut-off was to explore new hypotheses, rather than to derive individual candidate genes for validations. Specifically, MouseMine75 was used to identify significantly enriched gene ontology (GO) categories. Signaling-pathway impact analysis (SPIA) methodology76 – with number of differentially-expressed (NDE) genes >1; and FDR-corrected global P-value for each gene (pGFdr) <0.2 as cutoff] was used to identify significantly impacted Kyoto Encyclopedia of Genes and Genomes (KEGG)-signaling pathways. Ingenuity Pathway Analysis (IPA) was used to create the summary report and network figure.
In order to search for upstream regulators causing the observed changes in transcriptomes, the transcription-factor-binding site (TFBS) enrichment analysis was performed for promoters of differentially-expressed genes, as well as the significant genes from meta-analysis using Pscan77. For each TFBS, Pscan calculates a matching score for each promoter and compares the average matching score in a gene list vs those throughout the rest of the genome. If the average score is significantly higher in that gene list than the rest of the genome, then Pscan flags this TFBS as significant for this gene list. In this analysis, TF binding profiles in the JASPAR 2016 CORE database [http://jaspar.genered.net] was used, and promoter regions from −450 to +50 were considered. Significant TFBS genes were selected by Bonferroni corrected P-values of <0.1, as recommended by PScan.
All bioinformatics analyses, except for the tools mentioned above, were performed using the statistical computing platform R, and heat maps were plotted using the R package ComplexHeatmap78. We have uploaded our Slc39a8 RNA-seq data onto Gene Expression Omnibus (GEO). The link to our dataset is https://www.ncbi.nlm.nih.gov/geo/query/acc.cgi?acc=GSE111080.
Electronic supplementary material
Acknowledgements
We appreciate the technical help of Saikumar Karyala, and the IPA assay account generously provided by Alvaro Puga. We thank our colleagues —especially S. Steven Potter — for valuable discussions during the course of this work and careful reading of this manuscript. This project was funded, in part, by out-of-pocket personal funds during the final 12 months (DWN) and a Center for Environmental Genetics (CEG) Trainee-Mentor award, 2011–12 (MG-P). Generation and characterization of the knockdown mouse line was funded earlier by the National Institute of Environmental Health Sciences of the National Institutes of Health [grant numbers R01 ES010416 (DWN), T32 ES016646 (MG-P), and P30 ES06096 (DWN)].
Author Contributions
D.W.N., M.G.-P. and X.Z. conceived and designed the study. M.G.-P. and J.D. performed most of the experiments. D.W.N. and J.C. analyzed the data and wrote the manuscript, with the help of X.Z., Z.L. and M.G.-P.J.C. and X.Z. provided the data analysis. All authors reviewed the manuscript.
Competing Interests
The authors declare no competing interests.
Footnotes
Electronic supplementary material
Supplementary information accompanies this paper at 10.1038/s41598-018-29109-y.
Publisher's note: Springer Nature remains neutral with regard to jurisdictional claims in published maps and institutional affiliations.
References
- 1.Dalton TP, et al. Refining the mouse chromosomal location of Cdm, the major locus associated with susceptibility to cadmium-induced testicular necrosis. Pharmacogenetics. 2000;10:141–151. doi: 10.1097/00008571-200003000-00006. [DOI] [PubMed] [Google Scholar]
- 2.Dalton TP, et al. Identification of mouse SLC39A8 as the transporter responsible for cadmium-induced toxicity in the testis. Proc. Natl. Acad. Sci. USA. 2005;102:3401–3406. doi: 10.1073/pnas.0406085102. [DOI] [PMC free article] [PubMed] [Google Scholar]
- 3.Wang B, et al. Enhanced cadmium-induced testicular necrosis and renal proximal tubule damage caused by gene-dose increase in a Slc39a8-transgenic mouse line. Am J Physiol Cell Physiol. 2007;292:C1523–C1535. doi: 10.1152/ajpcell.00409.2006. [DOI] [PubMed] [Google Scholar]
- 4.Liu Z, et al. Cd2+ versus Zn2+ uptake by the ZIP8 HCO3−dependent symporter: kinetics, electrogenicity and trafficking. Biochem. Biophys. Res. Commun. 2008;365:814–820. doi: 10.1016/j.bbrc.2007.11.067. [DOI] [PMC free article] [PubMed] [Google Scholar]
- 5.Wang CY, et al. ZIP8 is an iron and zinc transporter whose cell-surface expression is up-regulated by cellular iron loading. J Biol Chem. 2012;287:34032–34043. doi: 10.1074/jbc.M112.367284. [DOI] [PMC free article] [PubMed] [Google Scholar]
- 6.McDermott JR, et al. Zinc- and bicarbonate-dependent ZIP8 transporter mediates selenite uptake. Oncotarget. 2016;7:35327–35340. doi: 10.18632/oncotarget.9205. [DOI] [PMC free article] [PubMed] [Google Scholar]
- 7.He L, et al. ZIP8, member of the solute-carrier-39 (SLC39) metal-transporter family: characterization of transporter properties. Mol Pharmacol. 2006;70:171–180. doi: 10.1124/mol.106.024521. [DOI] [PubMed] [Google Scholar]
- 8.Nebert DW, et al. ZIP14 and ZIP8 zinc/bicarbonate symporters in Xenopus oocytes: characterization of metal uptake and inhibition. Metallomics. 2012;4:1218–1225. doi: 10.1039/c2mt20177a. [DOI] [PMC free article] [PubMed] [Google Scholar]
- 9.Moore-Scott BA, Opoka R, Lin SC, Kordich JJ, Wells JM. Identification of molecular markers that are expressed in discrete anterior-posterior domains of the endoderm from the gastrula stage to mid-gestation. Dev. Dyn. 2007;236:1997–2003. doi: 10.1002/dvdy.21204. [DOI] [PubMed] [Google Scholar]
- 10.Harrison SM, Dunwoodie SL, Arkell RM, Lehrach H, Beddington RS. Isolation of novel tissue-specific genes from cDNA libraries representing the individual tissue constituents of the gastrulating mouse embryo. Development. 1995;121:2479–2489. doi: 10.1242/dev.121.8.2479. [DOI] [PubMed] [Google Scholar]
- 11.Zhu H, Yang H, Owen MR. Combined microarray analysis uncovers self-renewal-related signaling in mouse embryonic stem cells. Syst. Synth. Biol. 2007;1:171–181. doi: 10.1007/s11693-008-9015-2. [DOI] [PMC free article] [PubMed] [Google Scholar]
- 12.Wang B, He L, Dong H, Dalton TP, Nebert DW. Generation of a Slc39a8 hypomorph mouse: markedly decreased ZIP8 Zn2+/(HCO3−)2 transporter expression. Biochem. Biophys. Res. Commun. 2011;410:289–294. doi: 10.1016/j.bbrc.2011.05.134. [DOI] [PMC free article] [PubMed] [Google Scholar]
- 13.Gálvez-Peralta M, et al. ZIP8 zinc transporter: indispensable role for both multiple-organ organogenesis and hematopoiesis in utero. PLoS ONE. 2012;7:e36055. doi: 10.1371/journal.pone.0036055. [DOI] [PMC free article] [PubMed] [Google Scholar]
- 14.Lin W, et al. Hepatic metal ion transporter ZIP8 regulates manganese homeostasis and manganese-dependent enzyme activity. J Clin. Invest. 2017;127:2407–2417. doi: 10.1172/JCI90896. [DOI] [PMC free article] [PubMed] [Google Scholar]
- 15.Lin W, et al. Zinc transporter Slc39a8 is essential for cardiac ventricular compaction. J Clin. Invest. 2018;128:826–833. doi: 10.1172/JCI96993. [DOI] [PMC free article] [PubMed] [Google Scholar]
- 16.He L, Wang B, Hay EB, Nebert DW. Discovery of ZIP transporters that participate in cadmium damage to testis and kidney. Toxicol. Appl. Pharmacol. 2009;238:250–257. doi: 10.1016/j.taap.2009.02.017. [DOI] [PMC free article] [PubMed] [Google Scholar]
- 17.Begum NA, et al. Mycobacterium bovis BCG cell wall and lipopolysaccharide induce a novel gene, BIGM103, encoding a 7-TM protein: identification of a new protein family having Zn-transporter and Zn-metalloprotease signatures. Genomics. 2002;80:630–645. doi: 10.1006/geno.2002.7000. [DOI] [PubMed] [Google Scholar]
- 18.Boycott KM, et al. Autosomal-recessive intellectual disability with cerebellar atrophy syndrome caused by mutation of the manganese- and zinc-transporter gene SLC39A8. Am J Hum Genet. 2015;97:886–893. doi: 10.1016/j.ajhg.2015.11.002. [DOI] [PMC free article] [PubMed] [Google Scholar]
- 19.Park JH, et al. SLC39A8 deficiency: a disorder of manganese transport and glycosylation. Am J Hum Genet. 2015;97:894–903. doi: 10.1016/j.ajhg.2015.11.003. [DOI] [PMC free article] [PubMed] [Google Scholar]
- 20.Riley LG, et al. A SLC39A8 variant causes manganese deficiency, and glycosylation and mitochondrial disorders. J Inherit. Metab Dis. 2017;40:261–269. doi: 10.1007/s10545-016-0010-6. [DOI] [PubMed] [Google Scholar]
- 21.Waterworth DM, et al. Genetic variants influencing circulating lipid levels and risk of coronary artery disease. Arterioscler. Thromb. Vasc. Biol. 2010;30:2264–2276. doi: 10.1161/ATVBAHA.109.201020. [DOI] [PMC free article] [PubMed] [Google Scholar]
- 22.Besecker B, et al. The human zinc transporter SLC39A8 (ZIP8) is critical in zinc-mediated cytoprotection in lung epithelia. Am J Physiol Lung Cell Mol. Physiol. 2008;294:L1127–L1136. doi: 10.1152/ajplung.00057.2008. [DOI] [PubMed] [Google Scholar]
- 23.Liu MJ, et al. ZIP8 regulates host defense through zinc-mediated inhibition of NF-κB. Cell Rep. 2013;3:386–400. doi: 10.1016/j.celrep.2013.01.009. [DOI] [PMC free article] [PubMed] [Google Scholar]
- 24.Pyle CJ, et al. Zinc modulates endotoxin-induced human macrophage inflammation through ZIP8 Induction and C/EBPβ Inhibition. PLoS ONE. 2017;12:e0169531. doi: 10.1371/journal.pone.0169531. [DOI] [PMC free article] [PubMed] [Google Scholar]
- 25.Pyle,C.J. et al. Elemental ingredients in the macrophage cocktail: role of ZIP8 in host response to Mycobacterium tuberculosis. Int J Mol. Sci. 18 (2017). [DOI] [PMC free article] [PubMed]
- 26.Johansson A, et al. Genome-wide association and Mendelian randomization study of NT-proBNP in patients with acute coronary syndrome. Hum Mol. Genet. 2016;25:1447–1456. doi: 10.1093/hmg/ddw012. [DOI] [PubMed] [Google Scholar]
- 27.Verdugo RA, et al. Graphical modeling of gene expression in monocytes suggests molecular mechanisms explaining increased atherosclerosis in smokers. PLoS One. 2013;8:e50888. doi: 10.1371/journal.pone.0050888. [DOI] [PMC free article] [PubMed] [Google Scholar]
- 28.Ehret GB, et al. Genetic variants in novel pathways influence blood pressure and cardiovascular disease risk. Nature. 2011;478:103–109. doi: 10.1038/nature10405. [DOI] [PMC free article] [PubMed] [Google Scholar]
- 29.Ehret GB, et al. The genetics of blood pressure regulation and its target organs from association studies in 342, 415 individuals. Nat. Genet. 2016;48:1171–1184. doi: 10.1038/ng.3667. [DOI] [PMC free article] [PubMed] [Google Scholar]
- 30.Teslovich TM, et al. Biological, clinical and population relevance of 95 loci for blood lipids. Nature. 2010;466:707–713. doi: 10.1038/nature09270. [DOI] [PMC free article] [PubMed] [Google Scholar]
- 31.Willer CJ, et al. Discovery and refinement of loci associated with lipid levels. Nat. Genet. 2013;45:1274–1283. doi: 10.1038/ng.2797. [DOI] [PMC free article] [PubMed] [Google Scholar]
- 32.Ng E, et al. Genome-wide association study of toxic metals and trace elements reveals novel associations. Hum Mol. Genet. 2015;24:4739–4745. doi: 10.1093/hmg/ddv190. [DOI] [PMC free article] [PubMed] [Google Scholar]
- 33.Carrera N, et al. Association study of nonsynonymous single nucleotide polymorphisms in schizophrenia. Biol Psychiatry. 2012;71:169–177. doi: 10.1016/j.biopsych.2011.09.032. [DOI] [PubMed] [Google Scholar]
- 34. Schizophrenia Working Group of the Psychiatric Genomics Consortium Biological insights from 108 schizophrenia-associated genetic loci. Nature511, 421-427 (2014). [DOI] [PMC free article] [PubMed]
- 35.Baumann B, et al. Conditional Müller cell ablation leads to retinal iron accumulation. Invest Ophthalmol. Vis. Sci. 2017;58:4223–4234. doi: 10.1167/iovs.17-21743. [DOI] [PMC free article] [PubMed] [Google Scholar]
- 36.Li D, et al. A pleiotropic missense variant in SLC39A8 is associated with Crohn disease and human gut microbiome composition. Gastroenterology. 2016;151:724–732. doi: 10.1053/j.gastro.2016.06.051. [DOI] [PMC free article] [PubMed] [Google Scholar]
- 37.Song J, et al. MicroRNA-488 regulates zinc transporter SLC39A8/ZIP8 during pathogenesis of osteoarthritis. J Biomed. Sci. 2013;20:31. doi: 10.1186/1423-0127-20-31. [DOI] [PMC free article] [PubMed] [Google Scholar]
- 38.Kim JH, et al. Regulation of the catabolic cascade in osteoarthritis by the zinc-ZIP8-MTF1 axis. Cell. 2014;156:730–743. doi: 10.1016/j.cell.2014.01.007. [DOI] [PubMed] [Google Scholar]
- 39.Alvarez-Silva M, Belo-Diabangouaya P, Salaun J, Dieterlen-Lievre F. Mouse placenta is a major hematopoietic organ. Development. 2003;130:5437–5444. doi: 10.1242/dev.00755. [DOI] [PubMed] [Google Scholar]
- 40.Guo J, et al. Chromatin and single-cell RNA-seq profiling reveal dynamic signaling and metabolic transitions during human spermatogonial stem cell development. Cell Stem Cell. 2017;21:533–546. doi: 10.1016/j.stem.2017.09.003. [DOI] [PMC free article] [PubMed] [Google Scholar]
- 41.Nebert DW. Aryl hydrocarbon receptor (AHR): “pioneer member” of the basic-helix/loop/helix per-Arnt-sim (bHLH/PAS) family of “sensors” of foreign and endogenous signals. Progr. Lipid Res. 2017;67:38–57. doi: 10.1016/j.plipres.2017.06.001. [DOI] [PMC free article] [PubMed] [Google Scholar]
- 42.Juma AR, Damdimopoulou PE, Grommen SV, Van de Ven WJ, De GB. Emerging role of PLAG1 as a regulator of growth and reproduction. J Endocrinol. 2016;228:R45–R56. doi: 10.1530/JOE-15-0449. [DOI] [PubMed] [Google Scholar]
- 43.Fujiwara T. GATA transcription factors: basic principles and related human disorders. Tohoku J Exp. Med. 2017;242:83–91. doi: 10.1620/tjem.242.83. [DOI] [PubMed] [Google Scholar]
- 44.Bürglin TR, Affolter M. Homeodomain proteins: an update. Chromosoma. 2016;125:497–521. doi: 10.1007/s00412-015-0543-8. [DOI] [PMC free article] [PubMed] [Google Scholar]
- 45.Gutierrez-Camino A, Martin-Guerrero I, Garcia-Orad A. Genetic susceptibility in childhood acute lymphoblastic leukemia. Med Oncol. 2017;34:179. doi: 10.1007/s12032-017-1038-7. [DOI] [PubMed] [Google Scholar]
- 46.Gyoja, F. Basic helix-loop-helix transcription factors in evolution: roles in development of mesoderm and neural tissues. Genesis. 55 10.1002/dvg.23051 (2017). [DOI] [PubMed]
- 47.Musser JM, Arendt D. Loss and gain of cone types in vertebrate ciliary photoreceptor evolution. Dev. Biol. 2017;431:26–35. doi: 10.1016/j.ydbio.2017.08.038. [DOI] [PubMed] [Google Scholar]
- 48.Boi M, Zucca E, Inghirami G, Bertoni F. PRDM1: a tumor suppressor gene in B-cell and T-cell lymphomas. Leuk. Lymphoma. 2015;56:1223–1228. doi: 10.3109/10428194.2014.953155. [DOI] [PubMed] [Google Scholar]
- 49.Mzoughi S, Tan YX, Low D, Guccione E. The role of PRDMs in cancer: one family, two sides. Curr. Opin. Genet Dev. 2016;36:83–91. doi: 10.1016/j.gde.2016.03.009. [DOI] [PubMed] [Google Scholar]
- 50.Hu Y, Yoshida T, Georgopoulos K. Transcriptional circuits in B-cell transformation. Curr. Opin. Hematol. 2017;24:345–352. doi: 10.1097/MOH.0000000000000352. [DOI] [PMC free article] [PubMed] [Google Scholar]
- 51.Hirano T, et al. Roles of zinc and zinc signaling in immunity: zinc as an intracellular signaling molecule. Advanc. Immunol. 2008;97:149–176. doi: 10.1016/S0065-2776(08)00003-5. [DOI] [PubMed] [Google Scholar]
- 52.Li Y, Maret W. Transient fluctuations of intracellular zinc ions in cell proliferation. Exp. Cell Res. 2009;315:2463–2470. doi: 10.1016/j.yexcr.2009.05.016. [DOI] [PubMed] [Google Scholar]
- 53.Food and Nutrition Board. Zinc: Dietary reference intakes for vitamin A, vitamin K, arsenic, boron, chromium, copper, iodine, iron, manganese, molybdenum, nickel, silicon, vanadium, and zinc. Institute of Medicine 1, 442–501 (2001).
- 54.Prasad AS. Zinc deficiency. BMJ. 2003;326:409–410. doi: 10.1136/bmj.326.7386.409. [DOI] [PMC free article] [PubMed] [Google Scholar]
- 55.Andreini C, Banci L, Bertini I, Rosato A. Counting the zinc-proteins encoded in the human genome. J Proteome. Res. 2006;5:196–201. doi: 10.1021/pr050361j. [DOI] [PubMed] [Google Scholar]
- 56.Kambe T, Weaver BP, Andrews GK. The genetics of essential metal homeostasis during development. Genesis. 2008;46:214–228. doi: 10.1002/dvg.20382. [DOI] [PMC free article] [PubMed] [Google Scholar]
- 57.Zogzas CE, Mukhopadhyay S. Inherited disorders of manganese metabolism. Advanc. Neurobiol. 2017;18:35–49. doi: 10.1007/978-3-319-60189-2_3. [DOI] [PubMed] [Google Scholar]
- 58.Sterling J, et al. Iron importers ZIP8 and ZIP14 are expressed in retina and regulated by retinal iron levels. Exp. Eye Res. 2017;155:15–23. doi: 10.1016/j.exer.2016.12.008. [DOI] [PMC free article] [PubMed] [Google Scholar]
- 59.Fleischhacker AS, Kiley PJ. Iron-containing transcription factors and their roles as sensors. Curr. Opin. Chem Biol. 2011;15:335–341. doi: 10.1016/j.cbpa.2011.01.006. [DOI] [PMC free article] [PubMed] [Google Scholar]
- 60.Tan SH, Bertulfo FC, Sanda T. Leukemia-initiating cells in T-cell acute lymphoblastic leukemia. Front Oncol. 2017;7:218. doi: 10.3389/fonc.2017.00218. [DOI] [PMC free article] [PubMed] [Google Scholar]
- 61.Wu W, et al. Dynamic shifts in occupancy by TAL1 are guided by GATA factors and drive large-scale reprogramming of gene expression during hematopoiesis. Genome Res. 2014;24:1945–1962. doi: 10.1101/gr.164830.113. [DOI] [PMC free article] [PubMed] [Google Scholar]
- 62.Kassouf MT, et al. Genome-wide identification of TAL1’s functional targets: insights into its mechanisms of action in primary erythroid cells. Genome Res. 2010;20:1064–1083. doi: 10.1101/gr.104935.110. [DOI] [PMC free article] [PubMed] [Google Scholar]
- 63.Sciorra VA, Sanchez MA, Kunibe A, Wurmser AE. Suppression of glioma progression by EGLN3. PLoS One. 2012;7:e40053. doi: 10.1371/journal.pone.0040053. [DOI] [PMC free article] [PubMed] [Google Scholar]
- 64.Ferreira R, et al. Dynamic regulation of GATA factor levels is more important than their identity. Blood. 2007;109:5481–5490. doi: 10.1182/blood-2006-11-060491. [DOI] [PubMed] [Google Scholar]
- 65.Wlodarski MW, et al. Prevalence, clinical characteristics, and prognosis of GATA2-related myelodysplastic syndromes in children and adolescents. Blood. 2016;127:1387–1397. doi: 10.1182/blood-2015-09-669937. [DOI] [PubMed] [Google Scholar]
- 66.Hirabayashi S, Wlodarski MW, Kozyra E, Niemeyer CM. Heterogeneity of GATA2-related myeloid neoplasms. Int J Hematol. 2017;106:175–182. doi: 10.1007/s12185-017-2285-2. [DOI] [PubMed] [Google Scholar]
- 67.Papadopoulos GL, et al. GATA1 genome-wide occupancy associates with distinct epigenetic profiles in mouse fetal liver erythropoiesis. Nucleic Acids Res. 2013;41:4938–4948. doi: 10.1093/nar/gkt167. [DOI] [PMC free article] [PubMed] [Google Scholar]
- 68.Benita Y, et al. An integrative genomics approach identifies hypoxia-inducible factor-1 (HIF1)-target genes that form the core response to hypoxia. Nucleic Acids Res. 2009;37:4587–4602. doi: 10.1093/nar/gkp425. [DOI] [PMC free article] [PubMed] [Google Scholar]
- 69.Dopp JM, et al. Influence of intermittent hypoxia on myocardial and hepatic P-glycoprotein (ABCB1A) expression in a rodent model. Pharmacotherapy. 2009;29:365–372. doi: 10.1592/phco.29.4.365. [DOI] [PMC free article] [PubMed] [Google Scholar]
- 70.Rivera SP, et al. A novel promoter element containing multiple overlapping xenobiotic and hypoxia response elements mediates induction of cytochrome P450 2S1 by both dioxin and hypoxia. J Biol Chem. 2007;282:10881–10893. doi: 10.1074/jbc.M609617200. [DOI] [PubMed] [Google Scholar]
- 71.Frazer DM, Anderson GJ. The regulation of iron transport. Biofactors. 2014;40:206–214. doi: 10.1002/biof.1148. [DOI] [PubMed] [Google Scholar]
- 72.Krock BL, Skuli N, Simon MC. Hypoxia-induced angiogenesis: good and evil. Genes Cancer. 2011;2:1117–1133. doi: 10.1177/1947601911423654. [DOI] [PMC free article] [PubMed] [Google Scholar]
- 73.Anders S, Huber W. Differential expression analysis for sequence count data. Genome Biol. 2010;11:R106. doi: 10.1186/gb-2010-11-10-r106. [DOI] [PMC free article] [PubMed] [Google Scholar]
- 74.Benjamini Y, Hochberg Y. Controlling the false discovery rate: a practical and powerful approach to multiple testing. J Royal Statist. Soc. Series B. 1995;57:289–300. [Google Scholar]
- 75.Motenko H, Neuhauser SB, O’Keefe M, Richardson JE. MouseMine: a new data warehouse for MGI. Mamm. Genome. 2015;26:325–330. doi: 10.1007/s00335-015-9573-z. [DOI] [PMC free article] [PubMed] [Google Scholar]
- 76.Tarca AL, et al. A novel signaling-pathway impact analysis. Bioinformatics. 2009;25:75–82. doi: 10.1093/bioinformatics/btn577. [DOI] [PMC free article] [PubMed] [Google Scholar]
- 77.Zambelli F, Pesole G, Pavesi G. Pscan: Finding over-represented transcription-factor binding-site motifs in sequences from co-regulated or co-expressed genes. Nucleic Acids Res. 2009;37:W247–W252. doi: 10.1093/nar/gkp464. [DOI] [PMC free article] [PubMed] [Google Scholar]
- 78.Gu Z, Eils R, Schlesner M. Complex heatmaps reveal patterns and correlations in multidimensional genomic data. Bioinformatics. 2016;32:2847–2849. doi: 10.1093/bioinformatics/btw313. [DOI] [PubMed] [Google Scholar]
- 79.Speliotes EK, et al. Association analyses of 249,796 individuals reveal 18 new loci associated with body mass index. Nat. Genet. 2010;42:937–948. doi: 10.1038/ng.686. [DOI] [PMC free article] [PubMed] [Google Scholar]
- 80.Dickinson ME, et al. High-throughput discovery of novel developmental phenotypes. Nature. 2016;537:508–514. doi: 10.1038/nature19356. [DOI] [PMC free article] [PubMed] [Google Scholar]
Associated Data
This section collects any data citations, data availability statements, or supplementary materials included in this article.