

Abstract
Glucagon secreted from the pancreatic alpha-cells is essential for regulation of blood glucose levels. However, glucagon may play an equally important role in the regulation of amino acid metabolism by promoting ureagenesis. We hypothesized that disruption of glucagon receptor signaling would lead to an increased plasma concentration of amino acids, which in a feedback manner stimulates the secretion of glucagon, eventually associated with compensatory proliferation of the pancreatic alpha-cells. To address this, we performed plasma profiling of glucagon receptor knockout (Gcgr−/−) mice and wild-type (WT) littermates using liquid chromatography-mass spectrometry (LC-MS)-based metabolomics, and tissue biopsies from the pancreas were analyzed for islet hormones and by histology. A principal component analysis of the plasma metabolome from Gcgr−/− and WT littermates indicated amino acids as the primary metabolic component distinguishing the two groups of mice. Apart from their hyperaminoacidemia, Gcgr−/− mice display hyperglucagonemia, increased pancreatic content of glucagon and somatostatin (but not insulin), and alpha-cell hyperplasia and hypertrophy compared with WT littermates. Incubating cultured α-TC1.9 cells with a mixture of amino acids (Vamin 1%) for 30 min and for up to 48 h led to increased glucagon concentrations (~6-fold) in the media and cell proliferation (~2-fold), respectively. In anesthetized mice, a glucagon receptor-specific antagonist (Novo Nordisk 25–2648, 100 mg/kg) reduced amino acid clearance. Our data support the notion that glucagon secretion and hepatic amino acid metabolism are linked in a close feedback loop, which operates independently of normal variations in glucose metabolism.
Keywords: alpha-cell, amino acids, glucagon, glucagon receptor, hyperglucagonemia
INTRODUCTION
Glucagon is a peptide hormone of 29 amino acids processed from the prohormone, proglucagon, by prohormone convertase 2 (PC-2) in pancreatic alpha-cells (39). Activation of the hepatic glucagon receptor (GR) increases hepatic glycogenolysis and gluconeogenesis (10), and the physiological role of glucagon has been coupled to glucose metabolism with opposing actions to insulin (1, 28, 43). However, several studies have suggested that glucagon may play an equally important role in the regulation of hepatic amino acid metabolism (2, 5, 7, 13, 21, 41). Increased fasting and postprandial plasma concentrations of glucagon have been reported in clinical conditions including nonalcoholic fatty liver disease (NAFLD) and type 2 diabetes (33) raising the question whether this is related to amino acid metabolism.
Knockout of the GR in mice has been associated with disturbed metabolism of amino acids (14, 50) and alpha-cell hyperplasia that appears to be mediated by a humoral factor(s) secreted from the liver (29, 32), and recent studies suggest that this factor may be increased plasma concentrations of amino acids (12, 24, 41). We hypothesized that a feedback circuitry may exist by which glucagon increases amino acid turnover while amino acids conversely stimulate secretion of glucagon from the pancreas.
We therefore initially performed metabolomics analysis of plasma, histology of the pancreas, and protein expression profiles in liver and pancreas tissue from glucagon receptor knockout (Gcgr−/−) mice to dissect the principal components of GR disruption. In addition, we investigated the hepatic clearance of amino acids in vivo after prior pharmacological or genetically induced GR blockage. Finally, amino acids were administered to the alpha-cell line αTC1.9 to monitor glucagon secretion and alpha-cell proliferation.
MATERIALS AND METHODS
Animal studies.
Animal studies were conducted with permission from the Danish Animal Experiments Inspectorate, Ministry of Environment and Food of Denmark, permit 2013-15-2934-00833, and in accordance with the EU Directive 2010/63/EU and guidelines of Danish legislation governing animal experimentation (1987), and the National Institutes of Health (Publication No. 85-23). All studies were approved by the local ethical committee.
Female C57BL/6JRj mice (12 wk of age) were obtained from Janvier Laboratories, Saint-Berthevin Cedex, France. Mice were housed in groups of six to eight in individually ventilated cages and followed a light cycle of 12 h (lights on 6 AM to 6 PM) with ad libitum access to standard chow (catalog no. 1319, Altromin Spezialfutter, Lage, Germany) and water. Glucagon receptor knockout (Gcgr−/−) mice C57BL/6Gcgrtm1Mjch were previously described (14). Male and female homozygotes and wild-type (WT) littermates, age 9–29 wk, were used. During all Gcgr−/− and littermate studies, the investigator was blinded to the genotype of the mice to avoid bias.
Biochemical and morphometric characterization of Gcgr−/− mice.
Eleven Gcgr−/− mice (6 females 18–28 wk of age and 5 males 15–25 wk of age) and 15 WT littermates (8 females 18–25 wk of age and 7 males 15–22 wk of age) were fasted for 4 h with free access to water. A 50-µl blood sample was collected from the tail vein, and subsequently the mice were anesthetized with isoflurane (Baxter, Søborg, Denmark). When the mice were sufficiently sedated (absence of reflexes) the abdominal cavity was opened with a midline incision. Tissue samples from the pancreas and liver were harvested and either fixed in formaldehyde 4% and methanol 1–2% (Hounisen Laboratory Equipment, Skanderborg, Denmark) or snap-frozen on dry ice. Finally, the mice were subjected to a total blood collection from the inferior vena cava. The blood was immediately transferred to prechilled EDTA-coated Eppendorf tubes and stored on ice until centrifuged (1,650 g, 15 min, 4°C). Plasma was collected and stored in prechilled Eppendorf tubes at −20°C until further analysis.
Amino acid clearance in Gcgr−/− mice.
Seven Gcgr−/− mice (6 females 9–21 wk of age and 1 male 28 wk of age), and seven WT littermates (6 females 9–29 wk of age and 1 male 20 wk of age) were fasted and anesthetized as above and the inferior caval vein exposed. At time 0 min the mice received an injection of 1 µmol/g body wt amino acid mixture, Vamin (Vamin 14 g/l electrolyte free, catalog no. B05ABA01; Fresenius Kabi, Copenhagen, Denmark, composition of amino acids is shown in Table 1), diluted with sterilized phosphate-buffered saline (PBS) to a total volume of 100 µl in the caval vein. At time 12 min, the mice were subjected to a total blood collection from the inferior vena cava. Blood samples were handled as described above. Plasma samples were later analyzed for total l-amino acid concentration.
Table 1.
The components and concentrations of Vamin 14 electrolyte-free
| Amino Acid | Concentration, g/l |
| Isoleucine | 4.2 |
| Leucine | 5.9 |
| Valine | 5.5 |
| Phenylalanine | 5.9 |
| Methionine | 4.2 |
| Lysine | 6.8 |
| Threonine | 4.2 |
| Tryptophan | 1.4 |
| Cysteine | 0.42 |
| Histidine | 5.1 |
| Tyrosine | 0.17 |
| Alanine | 12.0 |
| Arginine | 8.4 |
| Aspartic acid | 2.5 |
| Glutamic acid | 4.2 |
| Glycine | 5.9 |
| Proline | 5.1 |
| Serine | 3.4 |
Amino acid clearance after pharmacological disruption of glucagon receptor signaling in mice.
Female C57BL/6JRj mice (12 wk of age) received a glucagon receptor antagonist [GRA, 25–2648, a gift from Novo Nordisk A/S (25)] 180 min before the amino acid stimulation experiment. GRA was dissolved in 5% ethanol, 20% propyleneglycol, 10% 2-hydroxypropyl-β-cyclodextrin (vol/vol) and phosphate buffer at pH 7.5–8.0 to a concentration of 20 mg/ml and administered by oral gavage (100 µl) as a suspension in a dose of 100 mg/kg body wt (42). A control group received 100 µl vehicle. At time 0 min, the tip of the tail was cut and blood glucose concentrations were measured. The mice were then anesthetized with isoflurane, and 1 µmol/g body wt Vamin diluted in sterilized PBS (100 µl) was injected into the inferior vena cava. Control groups received 100 µl sterilized PBS. At times 0, 2, 4, 12, or 20 min, the mice were subjected to total blood collection from the inferior vena cava, and blood glucose concentrations were measured. Blood samples were handled as described above and analyzed for total l-amino acid, insulin, and glucagon concentrations. Clearance was defined as the incremental area under the curve (iAUC0–20min).
Amino acid clearance after ligation of the kidneys.
Female C57BL/6JRj mice (12 wk of age) were anesthetized with isoflurane and subsequently subjected to kidney ligation (n = 4); four mice were sham operated and served as controls. At time 0 min, 1 µmol/g body wt Vamin diluted in sterilized PBS (100 µl) was injected into the caval vein. At time 12 min, the mice were subjected to total blood collection from the inferior vena cava. Blood samples were handled as described above and analyzed for total l-amino acid concentrations.
Biochemical analysis.
Plasma concentrations of total l-amino acids were quantified using an enzyme-linked immunosorbent assay (ELISA) (catalog no. ab65347; Abcam, Cambridge, UK). This kit determines concentrations of free l-amino acids, but neither protein bound nor d-amino acids. The assay was evaluated by recovery experiments using pooled (n = 4) mouse plasma with added known amounts of amino acids (product no. A6282; Sigma-Aldrich, Copenhagen, Denmark). Recoveries of amino acids were on average 79 ± 9% in mouse plasma.
Plasma concentrations of glucagon were measured using a validated (52) two-site enzyme immunoassay (catalog no. 10-1281-01; Mercodia, Uppsala, Sweden) according to the manufacturer’s protocol.
Plasma concentrations of ammonia/ammonium and of bile acids were quantified using enzymatic assays (catalog no. ab83360; Abcam; and catalog no. STA-361; Cell Biolabs, San Diego, CA, respectively).
Plasma concentrations of corticosterone and insulin were quantified using ELISAs (catalog no. ADI-900–097, Enzo, AH Diagnostics, Aarhus, Denmark; and catalog no. 10-1247-10, Mercodia, Uppsala, Sweden, respectively).
To avoid bias when performing biochemical analysis, all samples were assigned a number, so that genotype and treatment were unknown at the time of analysis.
Plasma metabolomics.
Metabolomic analysis was performed on plasma samples from 11 Gcgr−/− (6 females 18–28 wk of age and 5 males 15–25 wk of age), and 11 WT littermates (6 females 18–25 wk of age and 5 males 18–22 wk of age), also used for biochemical and morphometric characterization.
Using liquid chromatographic-triple quadrupole mass spectrometric (LC-MS/MS) measurements and the AbsoluteIDQ p180 Kit (BIOCRATES Life Sciences, Innsbruck, Austria), 188 metabolites were quantified out of 10 µl plasma, including free carnitine, 39 acylcarnitines, 21 amino acids, 21 biogenic amines, hexoses, 90 glycerophospholipids (14 lysophosphatidylcholines and 76 phosphatidylcholines), and 15 sphingolipids. The assay procedures of the AbsoluteIDQ p180 Kit as well as the metabolite nomenclature have been described in detail previously (40, 54). Sample handling was performed by a Hamilton Microlab STAR robot (Hamilton Bonaduz, Bonaduz, Switzerland) and a Ultravap nitrogen evaporator (Porvair Sciences, Leatherhead, UK), besides standard laboratory equipment. Mass spectrometric analyses were done on an API 4000 triple quadrupole system (Sciex Deutschland, Darmstadt, Germany) equipped with a 1200 Series HPLC (Agilent Technologies Deutschland, Böblingen, Germany) and a HTC PAL auto sampler (CTC Analytics, Zwingen, Switzerland) controlled by the software Analyst 1.6.1. Data evaluation for quantification of metabolite concentrations and quality assessment were performed with the software MultiQuant (Sciex) and the MetIDQ software package, which is an integral part of the AbsoluteIDQ Kit. Metabolite concentrations were calculated using internal standards and reported in micromoles per liter.
All data have been deposited at Figshare at doi:10.6084/m9.figshare.5364082.v1.
Histology and immunohistochemistry.
Pancreas and liver tissue samples from the 10 Gcgr−/− mice (5 females 18–25 wk of age and 5 males 15–25 wk of age), and 11 WT littermates (6 females 18–25 wk of age and 5 males 18–22 wk of age), also used for plasma metabolomics analysis, were fixed for 24 h, and then transferred to 70% ethanol. The tissue samples were embedded in paraffin at the Finsen Laboratory (Rigshospitalet, Copenhagen Biocenter, Copenhagen, Denmark).
Tissue sections were stained for insulin (in-house-developed guinea pig anti-insulin antibody 2006, 1:10,000) and glucagon (in-house-developed rabbit anti-glucagon 4304, 1:2,000). For antigen retrieval, sections were pretreated by boiling in triethylene glycol (TEG) buffer, pH 9, for 15 min. The sections were then incubated overnight at 4°C with primary antibodies, washed with PBS buffer, pH 7.4, and subsequently incubated with a mixture of Alexa568-labeled donkey-anti-rabbit antibody (red, 1:500, Abcam) and Alexa488-labeled goat anti-guinea pig antibody (green, 1:500, Life Technologies, Carlsbad, CA). The slides were mounted with DAKO fluorescence mounting medium (Agilent, Santa Clara, CA) and examined using an Axioscope 2 plus microscope (Zeiss, Jena, Germany). Images were taken using a CoolSNAP camera (Photometrics, Tucson, AZ).
For composition and size, 30 islets from each mouse (2 to 3 sections separated by 200–300 µm evaluated per mouse) were photographed and the relevant areas (insulin, glucagon, and total islet area) were measured using Image-Pro 7 software (Media Cybernetics, Rockville MD) as previously described (31). To measure the mean size of alpha-cells and beta-cells in the two groups of mice, 20 glucagon positive and 20 insulin positive cells were measured for each mouse using Image-Pro 7 software.
The pancreas sections were also double-stained for the glucagon-like-peptide-1 receptor (GLP-1R) (mouse GLP-1 receptor antibody 7F38, 1: 200, generous gift from Charles Pyke, Novo Nordisk, Måløv, Denmark) and insulin, glucagon, and somatostatin (in-house-developed rabbit somatostatin antibody 1759, 1:4,000), respectively. The sections were pretreated with pronase for 10 min (0.1%, Roche, Switzerland) at 37°C and incubated overnight with the GLP-1R antibody, and after washing in PBS buffer, pH 7.4, subsequently incubated with biotin-anti-mouse antibody, 1:200, Vectastain-complex according to the manufacturer’s instruction (Vector, Burlingame, CA), stained with DAB and counterstained lightly with hematoxylin. After this staining was completed, the sections were incubated overnight with either glucagon, insulin, or somatostatin antibody and after a wash in PBS, incubated with either Alexa 568 (1:500), or Alexa 488. The slides were then mounted with DAKO fluorescence mounting medium, the sections were examined using Axioscope 2 microscope, and images were taken using the CoolSNAP camera.
Pancreatic protein extraction and measurements of pancreatic concentrations of glucagon, GLP-1, insulin, and somatostatin.
Snap-frozen pancreatic tissues from six WT mice (2 females 22 and 25 wk of age and 4 males 15–20 wk of age), and five Gcgr−/− mice (3 females 22–25 wk of age and 2 males 22 and 25 wk of age) were subject to peptide extraction carried out as described previously (51). The dipeptidyl peptidase-4 (DPP-4) inhibitor, valine-pyrrolidide, was added to all samples and standards (final concentration 0.01 mmol/l) to prevent NH2-terminal degradation of GLP-1 during the assay incubation. Total amidated GLP-1 concentrations (the sum of 1–36 NH2, 7–36NH2, and 9–36NH2) were quantified using an RIA (code name 89390) specific for the amidated COOH-terminal of the GLP-1 molecule (35). Active GLP-1 concentrations (7–36 NH2) were measured using a well-established immunoassay specific for the NH2 terminus (47). Glucagon concentrations were measured using an RIA (code name 4305) (18) validated by ELISA (48). Insulin concentrations were measured using an RIA (code name 2006–3) (34). Somatostatin concentrations were measured using an RIA (code name 1758–5) (4).
Stimulation of the alpha-cell line, alphaTC1.9, with amino acids.
The alpha-cell line, alphaTC1 Clone 9 (ATCC CRL-2350), was used (16). The cells were seeded in 24-well plates (Nunc, ThermoScientific) at a cell density of 4 × 10⁴ per well. Cells 80% confluent were incubated for 2 h with PBS (controls) or 1% Vamin added to the media. The cell media were subsequently harvested and centrifuged (1,500 g, 15 min, 4°C) to remove any cells or debris and kept at −80°C until analysis. For long-term incubation (48 h) cells were treated with Vamin or PBS as described above and also treated with 5-bromo-2-deoxyuridine (BrdU) to assess cell proliferation (catalog no. C10337; Invitrogen) according to the manufacturer’s protocol. Concentrations of glucagon were normalized to total protein content assessed with a BCA kit from Thermo Fisher Scientific (catalog no. 23225).
Statistics.
All bioinformatics analyses were done with the Perseus software of the MaxQuant computational platform. For the principal component analysis we included the data set derived from mass spectrometry and, in addition, all available biochemical data obtained in the current study. A false discovery rate of < 0.05 after Benjamini-Hochberg correction was used to correct for multiple testing. When more than two groups were compared, a one-way ANOVA corrected for multiple testing using the Sidak-Holm algorithm was applied. To analyze data from two independent groups unpaired t-tests were used. Calculations were made using GraphPad Prism (version 7.02 for Windows; GraphPad Software, La Jolla, CA) and STAT14 (SE) (StataCorp, College Station, TX). All data are presented as means ± SE unless otherwise stated.
RESULTS
Biochemical and morphometric characterization of Gcgr−/− and WT mice.
The body weight of Gcgr−/− mice did not differ from WT littermates (31 ± 6 vs. 30 ± 4 g, P = 0.6) (Fig. 1A). Blood glucose concentrations were lower in Gcgr−/− mice compared with WT littermates (7 ± 1 vs. 9 ± 0.8 mmol/l, P < 0.0001) (Fig. 1B). Plasma glucagon concentrations were increased ~20-fold in Gcgr−/− mice compared with WT littermates (378 ± 158 vs. 21 ± 15 pmol/l, P < 0.0001) (Fig. 1C). Plasma concentrations of total l-amino acids were ~3-fold increased in Gcgr−/− mice compared with WT littermates (7.4 ± 1.4 vs. 2.5 ± 0.6 mmol/l, P < 0.0001) (Fig. 1D). Ammonia/ammonium concentrations were increased ~1.5 fold in Gcgr−/− mice compared with WT littermates (27 ± 4 vs. 18 ± 4 µmol/l, P = 0.0002) (Fig. 1E). Plasma concentrations of corticosterone and bile acids did not differ between Gcgr−/− mice and WT littermates (corticosterone: 176 ± 64 vs. 173 ± 100 ng/ml, P = 0.9; Fig. 1F) (bile acids: 6 ± 4 vs. 4 ± 0.6 µmol/l, P = 0.3), but the concentration of bile acids showed greater variation in Gcgr−/− (Fig. 1G).
Fig. 1.

Biochemical characterization of glucagon receptor knockout mice and wild-type littermates. A: the body weight of glucagon receptor knockout (Gcgr−/−) male (gray empty circles) or female mice (gray full circles) did not differ significantly, P = 0.4, from wild-type (WT) male mice (black empty squares) or female littermates (black full squares). The body weight of female Gcgr−/− did not differ from Gcgr−/− males (P = 0.2). The body weight of female WT differed from WT males (25 ± 3 vs. 33 ± 5 g, P = 0.0002). B: blood glucose concentrations in Gcgr−/− mice were significantly lower compared with WT, P < 0.0001, and did not differ between males and females. C: plasma concentrations of glucagon were significantly increased in Gcgr−/− mice compared with WT, P < 0.0001, and did not differ between males and females. D: plasma amino acid concentrations were significantly increased in Gcgr−/− mice compared with WT, P < 0.0001, and did not differ between males and females. E: plasma ammonia/ammonium concentrations were significantly increased in Gcgr−/− mice compared with WT, P = 0.0002, and did not differ between males and females. F: plasma concentrations of corticosterone did not differ between Gcgr−/− mice and WT, P = 0.8. Plasma corticosterone concentrations of Gcgr−/− females did not differ from Gcgr−/− males, P = 0.2. Plasma corticosterone concentrations of WT females differed from WT males (251 ± 72 vs. 85 ± 25 ng/ml, P < 0.0001). G: plasma concentrations of bile acids did not differ between Gcgr−/− mice and WT, P = 0.3, and did not differ between males and females. Gcgr−/− mice, n = 11 (15–28 wk of age); WT littermates, n = 15 (15–25 wk of age). Data are presented as means ± SD. ****P < 0.0001.
Plasma metabolomics analysis.
A principal component analysis identified pooled concentrations of amino acids as the primary component separating Gcgr−/− mice from WT littermates (Fig. 2A) and was, furthermore, in an additional set of analysis, the predictor with most effect (~8-fold) as well as the most significant predictor (P = 7.7 × 10⁻⁹) across the 188 identified metabolites (Fig. 2B). Alanine (Ala), glutamine (Gln), glycine (Gly), threonine (Thr), and serine (Ser) were, listed in decreasing order, the amino acids found in the highest concentration in Gcgr−/− mice (Fig. 2C).
Fig. 2.

Glucagon receptor knockout mice show hyperaminoacidemia. A: a principal component analysis revealed that plasma amino acid concentrations (component 1) separated glucagon receptor knockout mice (Gcgr−/−) and wild-type (WT) littermates completely. B: a principal component analysis revealed that amino acids (red dot) were the principal component showing the greatest difference when Gcgr−/− mice were compared with WT littermates. Green dots indicate the metabolites that were significantly increased in Gcgr−/− compared with WT littermates, and blue dots indicate metabolites that were significantly decreased in Gcgr−/− compared with WT littermates. C: in Gcgr−/−, mice the concentrations of certain amino acids were elevated to a larger degree than those of other amino acids. All amino acid concentrations, except the concentration of tryptophan (Trp), were significantly higher in Gcgr−/− mice (red bars) compared with WT littermates (black bars). Data are presented as means ± SE Gcgr−/− mice, n = 11 (15–28 wk of age); WT littermates, n = 11 (18–25 wk of age).
Gcgr−/− mice show alpha-cell hyperplasia and hypertrophy.
The mean islet size (area) was significantly larger in the Gcgr−/− mice compared with WT littermates (43,206 ± 2,054 vs. 1,1939 ± 697 µm2, P < 0,0001). In the WT mice, the mean beta-cell area was 5,555 ± 423 µm2, amounting to a mean 46% of the mean total islet area, and the mean beta-cell area in the Gcgr−/− mice was 7,047 ± 465 µm2, amounting to a mean 16% of the total islet area. The percent beta-cell areas was thus smaller in the Gcgr−/− mice (P < 0.05). In the WT mice, the mean alpha-cell area was 1,150 ± 70 µm2, amounting to a mean 10% of the mean total islet area. The mean alpha-cell area in the Gcgr−/− mice was 23,013 ± 1,207 µm2, corresponding to a mean 53% of the total islet area. The alpha-cell area in the WT mice was significantly smaller than in the Gcgr−/− mice (P < 0.0001). Representative double-stained (insulin and glucagon) pancreatic islets from Gcgr−/− mice and WT littermates are shown in Fig. 3, A and D. The individual beta-cell size was slightly larger in the Gcgr−/− mice than in the WT littermates (142 ± 0.2 vs. 102 ± 0.1 µm2, P < 0.001) whereas the mean individual alpha-cell size was much larger in the Gcgr−/− mice than in the WT littermates (240 ± 0.3 vs. 87 ± 0.1 µm2, P < 0.0001).
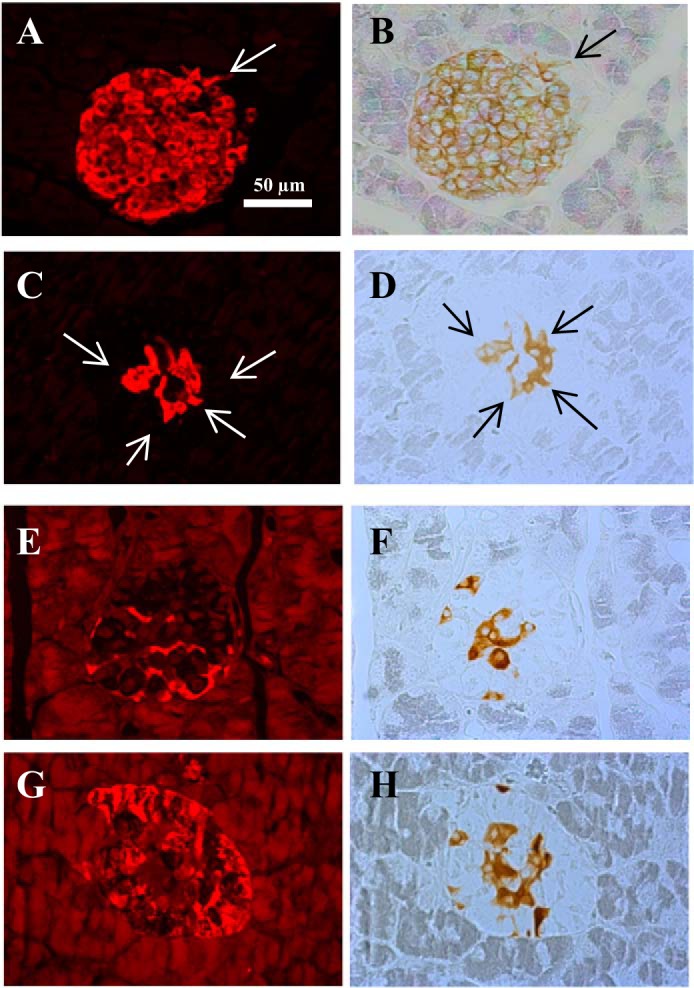
Fig. 3.

Glucagon receptor knockout mice show alpha-cell hyperplasia and hypertrophy. A: a typical immunohistochemical staining for glucagon (red, B) and insulin (green, C) in glucagon receptor knockout (Gcgr−/−) mice. D: a typical immunohistochemical staining for glucagon (red, E) and insulin (green, F) in wild-type (WT) littermates. The dotted arrows indicate a glucagon positive cell and the solid arrows indicate an insulin positive cell, the Gcgr−/− mice showed an increased size of glucagon positive cells compared with WT littermates. All images are shown at ×200 magnification. The scale bar indicates 50 µm.
Using a specific antibody against the murine GLP-1 receptor (37), the GLP-1 receptor was identified in pancreatic islets of both WT and Gcgr−/− mice. Staining for the GLP-1 receptor, combined with insulin, glucagon, and somatostatin immunohistochemistry, revealed that the GLP-1 receptor was localized to the beta-cells in both groups of mice; however, GLP-1 receptor staining of the somatostatin- and glucagon-producing cells could not be excluded. The GLP-1 receptor was confined to the plasma membrane of insulin positive cells in WT mice whereas in Gcgr−/− mice both plasma membrane and cytosolic staining was detected (Fig. 4).
Fig. 4.
Glucagon receptor knockout mice show an internalization of the glucagon-like-peptide-1 receptor compared with wild-type littermates. A typical insulin staining pattern in wild-type (WT) littermates (A) and in glucagon receptor knockout (Gcgr−/−) (C) mice. A typical glucagon-like-peptide-1 (GLP-1) receptor staining pattern in WT littermates (B) and in Gcgr−/− mice (D, F, H). (E) G: a typical somatostatin and glucagon staining pattern in Gcgr−/− mice. The arrows (in A, B, C, and D) indicate cells that stain positive for both insulin and the GLP-1 receptor. GLP-1 receptor staining was localized to insulin positive cells in both WT and Gcgr−/− mice. The GLP-1 receptor staining was confined to the plasma membrane in WT mice whereas both membrane and cytosolic staining was observed in Gcgr−/− mice. All images are shown at ×200 magnification. The scale bar indicates 50 µm.
Pancreatic concentrations of glucagon, GLP-1, insulin, and somatostatin in Gcgr−/− mice and WT littermates.
Pancreatic concentrations of extractable glucagon were higher in Gcgr−/− mice compared with WT littermates (6,851 ± 2,361 vs. 366 ± 285 pmol/g, P = 0.0003). Similarly, pancreatic concentrations of extractable, amidated total GLP-1 were significantly higher in Gcgr−/− mice compared with WT littermates (388 ± 66 vs. 69 ± 56 pmol/g, P < 0.0001). Concentrations of active extractable GLP-1 were 63 ± 22 pmol/g in the Gcgr−/− mice, whereas active GLP-1 was not detectable in WT littermate pancreata. The analytic detection limit was calculated to be 5 pmol/g. The pancreatic concentrations of extractable insulin did not differ significantly between Gcgr−/− mice and WT littermates (5,218 ± 1,782 pmol/g 7,218 ± 676.3 pmol/g, P = 0.2). The pancreatic concentration of extractable somatostatin was increased in Gcgr−/− mice compared with WT littermates (1,943 ± 231 vs. 1,071 ± 91 pmol/g, P = 0.002) (data not shown).
Amino acids stimulate glucagon secretion and proliferation of alphaTC1.9 cells.
Incubation with amino acids stimulated secretion of glucagon ~6-fold from the alphaTC1.9 cells compared with PBS stimulated controls (59 ± 26 vs. 9 ± 8 pmol/l, P = 0.0006) (Fig. 5A). A prolonged amino acid stimulation of the alphaTC1.9 cells led to an increased proliferation by ~2-fold compared with proliferation of cells not exposed to amino acids (31 ± 8% vs. 17 ± 4% BrdU positive cells, P = 0.01) (Fig. 5B).
Fig. 5.

Amino acids stimulate proliferation and secretion in cultured alpha-cells. A: the cultured alphaTC1.9 cells stimulated 4 h with Vamin (1%) (gray circles) showed a significant increase in glucagon secretion compared with PBS stimulated control cells (black squares). B: the alphaTC1.9 cells stimulated 48 h with Vamin (gray circles) showed an increased proliferation compared with control cells stimulated with phosphate-buffered saline (PBS) (black squares). Data are presented as means ± SD. *P < 0.05, ***P < 0.001.
Genetic disruption of glucagon receptor signaling influence on amino acid clearance.
Gcgr−/− mice and WT littermates received identical amino acid loads (1 µmol/g) at time 0 min. At time 12 min, the plasma Δ amino acid concentration in WT littermates reached 0.8 ± 0.5 mmol/l, whereas the Gcgr−/− mice had a Δ concentration of 6 ± 1 mmol/l (data not shown).
Effects of pharmacological blockade of glucagon receptor signaling on amino acid clearance in mice.
In mice treated with a glucagon receptor antagonist (GRA), fasting plasma concentrations of amino acids tended to be higher than in vehicle-treated mice (3.7 ± 0.3 vs. 3.0 ± 0.3 mmol/l, P = 0.1). In GRA + Vamin-treated mice, plasma concentrations of amino acids, at time 12 min, were significantly higher compared with vehicle + Vamin-treated mice (9 ± 1 vs. 5 ± 1 mmol/l, P = 0.006). In the latter group, concentrations returned to near baseline (4.8 ± 0.6 mmol/l) 20 min after the Vamin injection whereas concentrations in GRA + Vamin-treated mice remained elevated (7 ± 2 mmol/l) (Fig. 6A). The incremental area under the curve (iAUC0–20 min) was significantly higher in GRA + Vamin-treated mice compared with vehicle + Vamin-treated mice (P = 0.006) (Fig. 6B).
Fig. 6.

Total l-amino acids and glucagon plasma concentrations following amino acid stimulation during pharmacological blockade of the glucagon receptor. A: mice treated with the glucagon receptor antagonist (GRA) (red line and circles) were not able to clear the amino acid load (Vamin, 1 µmol/g body wt) administered at time 0 min whereas mice treated with vehicle (blue line and upward triangles) almost completely cleared the same amino acid load within 12 min. The control groups receiving phosphate-buffered saline (PBS) instead of Vamin after GRA treatment (pink line and squares) or vehicle administration (light blue line and downward triangles) showed no acute changes in the concentration of amino acids. B: the incremental areas under the curve (iAUC0–20 min) are shown for the 4 groups. C: mice treated with GRA responded to the amino acid stimulation with a larger increase in glucagon concentrations compared with mice treated with vehicle. The controls groups receiving PBS after GRA or vehicle treatment showed no change in glucagon concentrations. D: the iAUC0–20 min are shown for the 4 groups. Data are presented as means ± SE (n = 3–7). *P < 0.05, **P < 0.01.
Effects of pharmacological blockade of glucagon receptor signaling on glucagon secretion in mice.
In GRA-treated mice, fasting plasma concentrations of glucagon were significantly higher than in vehicle-treated mice (11 ± 1 vs. 7 ± 2 pmol/l, P = 0.02). Glucagon concentrations increased in Vamin-treated groups (vehicle + Vamin and GRA + Vamin). The glucagon response at time 2 min tended to be larger (~2-fold) in GRA-treated mice compared with vehicle-treated mice (39 ± 11 vs. 17 ± 4 pmol/l, P = 0.1), (Fig. 6C) and the glucagon secretory response was prolonged in GRA-treated mice compared with vehicle-treated mice (Fig. 6C). The iAUC0–20 min of GRA + Vamin-treated mice was 4-fold larger when compared with vehicle + Vamin-treated mice (82 min × pmol/L vs. 19 min × pmol/L, P = 0.02) (Fig. 6D).
Effect of pharmacological blockade of glucagon receptor signaling on insulin secretion in mice.
Fasting plasma concentrations of insulin did not differ from GRA- and vehicle-treated mice (0.9 ± 0.2 vs. 0.6 ± 0.5 ng/ml, P = 0.3). Plasma concentrations of insulin increased in response to the amino acid stimulation in both groups. GRA-treated mice had a smaller response in insulin secretion compared with vehicle-treated mice, although the difference was not significant (13 ± 3 vs. 19 ± 5 pmol/l, P = 0.3) at time 2 min (Fig. 7A). The iAUC0–20 min was smaller (~20 min × ng/ml, P = 0.1) in the GRA-treated group compared with the vehicle-treated group after the amino acid stimulation (Fig. 7B).
Fig. 7.

Plasma insulin and blood glucose concentrations following amino acid stimulation during pharmacological disruption of the glucagon receptor. A: both glucagon receptor antagonist (GRA, red line and circles)- and vehicle (blue line and upward triangles)-treated mice responded with a fast increase in plasma insulin concentration following amino acid infusion (Vamin, 1 µmol/g body wt). Control groups receiving phosphate-buffered saline (PBS) instead of amino acids (GRA + PBS, pink line and squares; and vehicle + PBS, light blue line and downward triangles) showed no change in insulin concentrations. B: the incremental areas under the curve (iAUC0–20 min) are shown for the 4 groups. The amino acid stimulation resulted in an increase in insulin concentrations in both groups. C: blood glucose concentrations increased in response to the amino acid stimulation in both groups. Blood glucose concentrations also increased in the control groups receiving PBS. D: the total areas under the curve (TAUC0–20 min) are shown for blood glucose levels. Data are presented as means ± SE (n = 3–7).
Effect of pharmacological disruption of glucagon receptor signaling on blood glucose concentrations in mice.
Fasting blood glucose concentrations of GRA- and vehicle-treated mice differed significantly (6.5 ± 0.2 vs. 7.5 ± 0.3 mmol/l, P = 0.008). Blood glucose concentrations increased in response to the amino acid stimulation in both groups. Blood glucose concentrations also increased in response to PBS in both groups. At time 2 min, the blood glucose levels were significantly lower in GRA + PBS-treated mice compared with vehicle + PBS-treated mice (8 ± 0.3 vs. 11 ± 0.9 mmol/l, P = 0.02) (Fig. 7C). The total area under the curve (TAUC20 min) was ~2-fold larger in the vehicle + Vamin-treated group compared with the GRA + Vamin-treated group (P = 0.06) (Fig. 7D).
Amino acid clearance after ligation of the kidneys.
Plasma concentrations of amino acids 12 min after Vamin injection did not differ significantly between mice subjected to ligation of both kidneys and control mice (4.4 ± 0.6 vs. 3.7 ± 0.3 mmol/l, P = 0.4) (data not shown).
DISCUSSION
Here we demonstrate that normal clearance of amino acids in mice requires glucagon receptor signaling, and that disruption of the latter, by a glucagon receptor antagonist (GRA, 25–2648) or genetic deletion of the glucagon receptor (Gcgr−/−), results in significantly higher plasma concentrations of amino acids (hyperaminoacidemia) possibly due to decreased hepatic ureagenesis.
First, we recharacterized the Gcgr−/− mouse with a focus on amino acid metabolism using plasma metabolomics, histology, and measurements of pancreatic peptide hormones. As previously reported (11, 14), Gcgr−/− mice had lower blood glucose concentrations, elevated plasma concentrations of glucagon, increased alpha-cell mass, increased pancreatic content of glucagon, total and active GLP-1, somatostatin, and an equal content of insulin compared with WT littermates. Importantly, we found that Gcgr−/− mice had pronounced increases in plasma amino acid and ammonia concentrations. In line with this, a metabolomics-driven principal component analysis showed that among 188 metabolites measured after glucagon receptor signaling disruption, the amino acid concentrations showed the most dramatic changes (~41%). In particular, the glucogenic amino acids showed the largest changes. We were, in contrast to what has been reported previously (53), unable to detect significantly higher plasma concentrations of bile acids in Gcgr−/− mice compared with WT littermates, but we did observe a greater variability in the Gcgr−/− mice and bile acids were indeed higher in some animals. In this report, corticosterone plasma concentrations were found to be similar in Gcgr−/− mice and WT mice after a short-term fast (4 h), and others (11, 14) have reported similar corticosterone concentrations under similar conditions. However, the corticosterone levels of Gcgr−/− mice were found to be increased twofold compared with WT mice upon a prolonged fast (>12 h), suggesting that increased levels of corticosterone may function to prevent hypoglycemia during prolonged fasting, but are less important in the fed state.
Remodeling of the pancreatic islets has been suggested to be of importance for maintaining adequate metabolism and in particular normal glucose concentrations (6).
We found the average area of the pancreatic islets to be significantly larger in the Gcgr−/− mice than in the WT littermates, in accordance with previous studies (8, 14). The larger alpha-cell area was due to both hyperplasia and hypertrophy, as the individual alpha-cells in the Gcgr−/− mice were significantly larger than in WT littermates, and there were also more alpha cells. In the pancreatic alpha-cells, proglucagon is primarily processed to glucagon by prohormone convertase (PC) 2 (39), and very little, if any, of proglucagon is processed to GLP-1 (20). Active GLP-1 (7–36NH2) is therefore not a product of the alpha-cell proglucagon processing under normal conditions, according to the present studies. However, we detected significant amounts of fully processed active GLP-1 in pancreatic tissue from Gcgr−/− mice. A plasticity in the proglucagon producing cells may therefore exist, as has previously been reported (19, 39), which can be activated upon metabolic or anatomical alterations. However, GLP-1 remained a minor product of proglucagon amounting to only ~1% of glucagon. If active GLP-1 was present in the WT pancreas in the same proportion, the concentration of active GLP-1 would be below detection limit (0.6 pmol/g). The larger amount of active GLP-1 in the pancreas may result in increased concentrations of circulating GLP-1 (14) in Gcgr−/− mice, and this has been suggested as an underlying reason for the improved glucose tolerance of these mice (11, 22). In connection with this finding we thought that it would be interesting to investigate the expression of the GLP-1 receptor in the markedly abnormal islets of the Gcgr−/− mice compared with the WT littermates. For this we used specific murine GLP-1 receptor antibody (37), but the receptor was found exclusively on the beta-cells. The sensitivity of the immunohistochemical approach does not allow us to exclude expression of a small (and therefore undetectable) number of GLP-1 receptors on the glucagon and somatostatin producing cells, but at least the hyperplastic and hypertrophic alpha-cells do not seem to express the receptor in large amounts, and expression in the beta-cells was apparently not downregulated by the larger than normal exposure to the ligand. Interestingly, the GLP-1 receptor staining in WT mice was confined to the cell membrane of the beta-cells, whereas both membrane and cytoplasmic staining was found in Gcgr−/− islets, due to internalization of the GLP-1 receptor. We speculate that this may be due to increased secretion of pancreatic GLP-1 in the Gcgr−/− mice thereby resulting in an increased internalization of the GLP-1 receptor. However, further studies are needed to clarify this.
We found an increased density of somatostatin cells in the Gcgr−/− islets compared with the WT islets, as also reported in Ref. 14 and in accordance with the higher somatostatin content measured in the pancreatic extracts from these mice. The delta-cells may therefore contribute to the increased islet area detected in Gcgr−/− mice. Finally, it has been suggested that some alpha-cells, contributing to the hyperplasia, may transdifferentiate to beta-cells (30, 44). Our data showed, as reported in Ref. 14, that the pancreatic insulin content did not differ significantly between Gcgr−/− mice and WT littermates. However, insulin immunostaining showed a slightly larger beta-cell area in Gcgr−/− mice than in WT littermates.
GRA-treated WT mice had reduced clearance of an intravenous load of mixed amino acids, compared with vehicle-treated mice, suggesting that intact glucagon receptor signaling is required for adequate clearance of exogenous amino acids. Both groups responded with an increase in glucagon concentrations upon amino acid stimulation. However, the glucagon increase was larger in GRA-treated mice compared with vehicle-treated mice. The greater and longer-lasting glucagon response observed in GRA-treated mice might be due to the persistently higher level of amino acids in GRA-treated mice. Both groups responded with an increase in insulin concentrations upon amino acid stimulation. However, a tendency to a decreased insulin response in GRA-treated mice was observed, perhaps due to GRA inhibition of glucagon-induced insulin secretion (15, 23).
In the Gcgr−/− mice, the receptor deletion can lead to lifelong metabolic adaptions. These adaptions may skew the results, and make the results from the model difficult to interpret in terms of physiology and less relevant for the understanding of human metabolic disease (8). However, we were able to demonstrate decreased clearance of amino acids using both Gcgr−/− as well as a highly specific glucagon receptor antagonist. It is therefore unlikely that the decreased clearance of amino acids is a result of biological adaption following knockout of the glucagon receptor gene. Furthermore, the glucagon receptor is not expressed in human or mouse adipose tissue or in muscles [there is a single aberrant report of receptor expression in muscles (17)], and we were also able to demonstrate that ligation of the kidneys did not acutely influence amino acid clearance in WT mice. We therefore suggest that the observed effects of glucagon receptor blockade on amino acid metabolism are a consequence of disrupted glucagon signaling in the liver.
Cultured alpha cells (alphaTC1.9) incubated with amino acids showed increased proliferation and glucagon secretion, supporting a role for amino acids as growth factors for the alpha-cells (32, 41) and as stimulators of glucagon secretion as previously suggested (3, 26, 36, 38, 41, 45).
The amino acid clearance experiments were performed using mice anesthetized with isoflurane. Isoflurane has, in contrast to other rodent anesthetics, previously been shown not to attenuate arginine-stimulated glucagon secretion in mice (52), supporting that the glucagon responses observed are physiologically relevant. The use of anesthetized mice allowed us to obtain sufficient plasma to perform accurate measurements of amino acids, glucagon, and insulin. In addition, by using anesthetized mice we were also able to exclude the effects of muscular contractions on plasma amino acids (46).
Some of the findings in Gcgr−/− mice are reflected in human studies: patients with inactivating glucagon receptor knockout mutations show pancreatic swelling, hyperaminoacidemia, and hyperglucagonemia (27). Subjects with nonalcoholic fatty liver disease (NAFLD) and type 2 diabetes have been shown to have elevated concentrations of plasma amino acids and hyperglucagonemia (49). These findings suggest that, also in humans, impaired liver function leads to hyperglucagonemia, perhaps as a consequence of impaired glucagon action on hepatic amino acid turnover, leading to elevated concentrations of circulating amino acids that stimulate alpha-cells. In line with this, patients with glucagon-producing tumors (glucagonomas) show hypoaminoacidemia (9, 50). This may be caused by the high rate of glucagon accelerated hepatic amino acid turnover and ureagenesis.
In conclusion, both pharmacological and genetic disruption of glucagon receptor signaling lead to severely impaired amino acid clearance in mice, supporting an essential role for glucagon receptor signaling in acute amino acid turnover in mice. Furthermore, mice lacking glucagon receptor signaling (Gcgr−/− mice) have hyperaminoacidemia, hyperglucagonemia, and alpha-cell hyperplasia. These findings support the existence of a liver-alpha-cell axis with amino acid and glucagon feedback loops in mice. This feedback circuitry may be particularly important during ingestion of protein-rich meals that raise the concentration of circulating amino acids. Disruption of the axis, be it by liver dysfunction as seen in NAFLD patients or in defects in glucagon receptor signaling as seen in patients with inactivating glucagon receptor mutations or treatment with a glucagon receptor antagonist, leads to hyperaminoacidemia and is, in this way, responsible for the apparent hypersecretion of glucagon (hyperglucagonemia) rather than disturbances in glucose metabolism.
GRANTS
This study was supported by the Novo Nordisk Foundation (NNF) Center for Basic Metabolic Research University of Copenhagen, NNF Application No. 13563, EliteForsk Rejsestipendiat (2016), The Danish Council for Independent Research (DFF-1333-00206A), The Augustinus Foundation, Aase and Ejnar Danielsens Foundation, The Mærsk Foundation, The Holger Rabitz Foundation, Doctor Johannes Nicolaj Krogsgaard and wife Else Krogsgaard Memorial Scholarship for Medical Research and Medical Students at the University of Copenhagen, European Biology Organization (EMBO) and the European Foundation for the Study of Diabetes (EFSD), Novo Scholarship Program 2017, and by a grant from the German Federal Ministry of Education and Research (BMBF) to the German Center Diabetes Research (DZD).
DISCLOSURES
No conflicts of interest, financial or otherwise, are declared by the authors.
AUTHOR CONTRIBUTIONS
K.D.G., J.P., N.J.W.A., and J.J.H. conceived and designed research; K.D.G., M.W.-S., C.Ø., H.K., S.S.P., C.P., J.A., S.L.J., B.H., J.H., J.P., and N.J.W.A. performed experiments; K.D.G., M.W.-S., C.Ø., S.S.P., J.A., J.P., N.J.W.A., and J.J.H. analyzed data; K.D.G., M.W.-S., C.Ø., H.K., S.S.P., H.V., J.P., N.J.W.A., and J.J.H. interpreted results of experiments; K.D.G. and N.J.W.A. prepared figures; K.D.G. and N.J.W.A. drafted manuscript; M.W.-S., C.Ø., H.K., S.S.P., H.V., B.H., M.J.C., J.P., and J.J.H. edited and revised manuscript; K.D.G., M.W.-S., C.Ø., H.K., S.S.P., H.V., C.P., J.A., S.L.J., B.H., J.H., M.J.C., J.P., N.J.W.A., and J.J.H. approved final version of manuscript.
ACKNOWLEDGMENTS
We thank J. Silke Becker for metabolomics measurements performed at the Helmholtz Zentrum München, Genome Analysis Center, Metabolomics Core Facility and the Finsen Core Laboratory [Biotech Research & Innovation Centre (BRIC), Copenhagen, Denmark]. We are very grateful for the help of laboratory technician R. Kweder and Assoc. Prof. Reidar Albrechtsen (BRIC, University of Copenhagen, Denmark) with cell proliferation assays.
REFERENCES
- 1.Alford FP, Bloom SR, Nabarro JD, Hall R, Besser GM, Coy DH, Kastin AJ, Schally AV. Glucagon control of fasting glucose in man. Lancet 304: 974–977, 1974. doi: 10.1016/S0140-6736(74)92071-6. [DOI] [PubMed] [Google Scholar]
- 2.Almdal TP, Jensen T, Vilstrup H. Increased hepatic efficacy of urea synthesis from alanine in insulin-dependent diabetes mellitus. Eur J Clin Invest 20: 29–34, 1990. doi: 10.1111/j.1365-2362.1990.tb01787.x. [DOI] [PubMed] [Google Scholar]
- 3.Assan R, Attali JR, Ballerio G, Boillot J, Girard JR. Glucagon secretion induced by natural and artificial amino acids in the perfused rat pancreas. Diabetes 26: 300–307, 1977. doi: 10.2337/diab.26.4.300. [DOI] [PubMed] [Google Scholar]
- 4.Bersani M, Johnsen AH, Holst JJ. Oxidation/reduction explains heterogeneity of pancreatic somatostatin. FEBS Lett 279: 237–239, 1991. doi: 10.1016/0014-5793(91)80157-X. [DOI] [PubMed] [Google Scholar]
- 5.Boden G, Rezvani I, Owen OE. Effects of glucagon on plasma amino acids. J Clin Invest 73: 785–793, 1984. doi: 10.1172/JCI111272. [DOI] [PMC free article] [PubMed] [Google Scholar]
- 6.Chambers AP, Sorrell JE, Haller A, Roelofs K, Hutch CR, Kim KS, Gutierrez-Aguilar R, Li B, Drucker DJ, D’Alessio DA, Seeley RJ, Sandoval DA. The role of pancreatic preproglucagon in glucose homeostasis in mice. Cell Metab 25: 927–934.e3, 2017. doi: 10.1016/j.cmet.2017.02.008. [DOI] [PMC free article] [PubMed] [Google Scholar]
- 7.Charlton MR, Adey DB, Nair KS. Evidence for a catabolic role of glucagon during an amino acid load. J Clin Invest 98: 90–99, 1996. doi: 10.1172/JCI118782. [DOI] [PMC free article] [PubMed] [Google Scholar]
- 8.Charron MJ, Vuguin PM. Lack of glucagon receptor signaling and its implications beyond glucose homeostasis. J Endocrinol 224: R123–R130, 2015. doi: 10.1530/JOE-14-0614. [DOI] [PMC free article] [PubMed] [Google Scholar]
- 9.Chastain MA. The glucagonoma syndrome: a review of its features and discussion of new perspectives. Am J Med Sci 321: 306–320, 2001. doi: 10.1097/00000441-200105000-00003. [DOI] [PubMed] [Google Scholar]
- 10.Cherrington AD, Chiasson JL, Liljenquist JE, Lacy WW, Park CR. Control of hepatic glucose output by glucagon and insulin in the intact dog. Biochem Soc Symp 43: 31–45, 1978. [PubMed] [Google Scholar]
- 11.Conarello SL, Jiang G, Mu J, Li Z, Woods J, Zycband E, Ronan J, Liu F, Roy RS, Zhu L, Charron MJ, Zhang BB. Glucagon receptor knockout mice are resistant to diet-induced obesity and streptozotocin-mediated beta cell loss and hyperglycaemia. Diabetologia 50: 142–150, 2007. doi: 10.1007/s00125-006-0481-3. [DOI] [PubMed] [Google Scholar]
- 12.Dean ED, Li M, Prasad N, Wisniewski SN, Von Deylen A, Spaeth J, Maddison L, Botros A, Sedgeman LR, Bozadjieva N, Ilkayeva O, Coldren A, Poffenberger G, Shostak A, Semich MC, Aamodt KI, Phillips N, Yan H, Bernal-Mizrachi E, Corbin JD, Vickers KC, Levy SE, Dai C, Newgard C, Gu W, Stein R, Chen W, Powers AC. interrupted glucagon signaling reveals hepatic α cell axis and role for l-glutamine in α cell proliferation. Cell Metab 25: 1362–1373.e5, 2017. doi: 10.1016/j.cmet.2017.05.011. [DOI] [PMC free article] [PubMed] [Google Scholar]
- 13.Flakoll PJ, Borel MJ, Wentzel LS, Williams PE, Lacy DB, Abumrad NN. The role of glucagon in the control of protein and amino acid metabolism in vivo. Metabolism 43: 1509–1516, 1994. doi: 10.1016/0026-0495(94)90009-4. [DOI] [PubMed] [Google Scholar]
- 14.Gelling RW, Du XQ, Dichmann DS, Romer J, Huang H, Cui L, Obici S, Tang B, Holst JJ, Fledelius C, Johansen PB, Rossetti L, Jelicks LA, Serup P, Nishimura E, Charron MJ. Lower blood glucose, hyperglucagonemia, and pancreatic alpha cell hyperplasia in glucagon receptor knockout mice. Proc Natl Acad Sci USA 100: 1438–1443, 2003. doi: 10.1073/pnas.0237106100. [DOI] [PMC free article] [PubMed] [Google Scholar]
- 15.Goldfine ID, Cerasi E, Luft R. Glucagon stimulation of insulin release in man: inhibition during hypoglycemia. J Clin Endocrinol Metab 35: 312–315, 1972. doi: 10.1210/jcem-35-2-312. [DOI] [PubMed] [Google Scholar]
- 16.Hamaguchi K, Leiter EH. Comparison of cytokine effects on mouse pancreatic alpha-cell and beta-cell lines. Viability, secretory function, and MHC antigen expression. Diabetes 39: 415–425, 1990. doi: 10.2337/diab.39.4.415. [DOI] [PubMed] [Google Scholar]
- 17.Hansen LH, Abrahamsen N, Nishimura E. Glucagon receptor mRNA distribution in rat tissues. Peptides 16: 1163–1166, 1995. doi: 10.1016/0196-9781(95)00078-X. [DOI] [PubMed] [Google Scholar]
- 18.Holst JJ. Evidence that glicentin contains the entire sequence of glucagon. Biochem J 187: 337–343, 1980. doi: 10.1042/bj1870337. [DOI] [PMC free article] [PubMed] [Google Scholar]
- 19.Holst JJ. Molecular heterogeneity of glucagon in normal subjects and in patients with glucagon-producing tumours. Diabetologia 24: 359–365, 1983. [PubMed] [Google Scholar]
- 20.Holst JJ, Bersani M, Johnsen AH, Kofod H, Hartmann B, Orskov C. Proglucagon processing in porcine and human pancreas. J Biol Chem 269: 18827–18833, 1994. [PubMed] [Google Scholar]
- 21.Holst JJ, Wewer Albrechtsen NJ, Pedersen J, Knop FK. Glucagon and amino acids are linked in a mutual feedback cycle: the liver-α-cell axis. Diabetes 66: 235–240, 2017. doi: 10.2337/db16-0994. [DOI] [PubMed] [Google Scholar]
- 22.Jun LS, Millican RL, Hawkins ED, Konkol DL, Showalter AD, Christe ME, Michael MD, Sloop KW. Absence of glucagon and insulin action reveals a role for the GLP-1 receptor in endogenous glucose production. Diabetes 64: 819–827, 2015. doi: 10.2337/db14-1052. [DOI] [PubMed] [Google Scholar]
- 23.Kawai K, Yokota C, Ohashi S, Watanabe Y, Yamashita K. Evidence that glucagon stimulates insulin secretion through its own receptor in rats. Diabetologia 38: 274–276, 1995. doi: 10.1007/BF00400630. [DOI] [PubMed] [Google Scholar]
- 24.Kim J, Okamoto H, Huang Z, Anguiano G, Chen S, Liu Q, Cavino K, Xin Y, Na E, Hamid R, Lee J, Zambrowicz B, Unger R, Murphy AJ, Xu Y, Yancopoulos GD, Li WH, Gromada J. Amino acid transporter Slc38a5 controls glucagon receptor inhibition-induced pancreatic α cell hyperplasia in mice. Cell Metab 25: 1348–1361.e8, 2017. doi: 10.1016/j.cmet.2017.05.006. [DOI] [PMC free article] [PubMed] [Google Scholar]
- 25.Kodra JT, Jørgensen AS, Andersen B, Behrens C, Brand CL, Christensen IT, Guldbrandt M, Jeppesen CB, Knudsen LB, Madsen P, Nishimura E, Sams C, Sidelmann UG, Pedersen RA, Lynn FC, Lau J. Novel glucagon receptor antagonists with improved selectivity over the glucose-dependent insulinotropic polypeptide receptor. J Med Chem 51: 5387–5396, 2008. doi: 10.1021/jm7015599. [DOI] [PubMed] [Google Scholar]
- 26.Kuhara T, Ikeda S, Ohneda A, Sasaki Y. Effects of intravenous infusion of 17 amino acids on the secretion of GH, glucagon, and insulin in sheep. Am J Physiol Endocrinol Metab 260: E21–E26, 1991. [DOI] [PubMed] [Google Scholar]
- 27.Larger E, Wewer Albrechtsen NJ, Hansen LH, Gelling RW, Capeau J, Deacon CF, Madsen OD, Yakushiji F, De Meyts P, Holst JJ, Nishimura E. Pancreatic α-cell hyperplasia and hyperglucagonemia due to a glucagon receptor splice mutation. Endocrinol Diabetes Metab Case Rep 2016: 16–81, 2016. [DOI] [PMC free article] [PubMed] [Google Scholar]
- 28.Liljenquist JE, Chiassan JL, Cherrington AD, Keller U, Jennings AS, Bomboy JD, Lacy WW. An important role for glucagon in the regulation of glucose production in vivo. Metabolism 25, Suppl 1: 1371–1373, 1976. doi: 10.1016/S0026-0495(76)80144-8. [DOI] [PubMed] [Google Scholar]
- 29.Longuet C, Robledo AM, Dean ED, Dai C, Ali S, McGuinness I, de Chavez V, Vuguin PM, Charron MJ, Powers AC, Drucker DJ. Liver-specific disruption of the murine glucagon receptor produces α-cell hyperplasia: evidence for a circulating α-cell growth factor. Diabetes 62: 1196–1205, 2013. doi: 10.2337/db11-1605. [DOI] [PMC free article] [PubMed] [Google Scholar]
- 30.Lysy PA, Weir GC, Bonner-Weir S. Making β cells from adult cells within the pancreas. Curr Diab Rep 13: 695–703, 2013. doi: 10.1007/s11892-013-0400-1. [DOI] [PMC free article] [PubMed] [Google Scholar]
- 31.Merino B, Alonso-Magdalena P, Lluesma M, Ñeco P, Gonzalez A, Marroquí L, García-Arévalo M, Nadal A, Quesada I. Pancreatic alpha-cells from female mice undergo morphofunctional changes during compensatory adaptations of the endocrine pancreas to diet-induced obesity. Sci Rep 5: 11622, 2015. doi: 10.1038/srep11622. [DOI] [PMC free article] [PubMed] [Google Scholar]
- 32.Morley MG, Leiter EH, Eisenstein AB, Strack I. Dietary modulation of alpha-cell volume and function in strain 129/J mice. Am J Physiol Gastrointest Liver Physiol 242: G354–G359, 1982. [DOI] [PubMed] [Google Scholar]
- 33.Müller WA, Faloona GR, Aguilar-Parada E, Unger RH. Abnormal alpha-cell function in diabetes. Response to carbohydrate and protein ingestion. N Engl J Med 283: 109–115, 1970. doi: 10.1056/NEJM197007162830301. [DOI] [PubMed] [Google Scholar]
- 34.Orskov C, Jeppesen J, Madsbad S, Holst JJ. Proglucagon products in plasma of noninsulin-dependent diabetics and nondiabetic controls in the fasting state and after oral glucose and intravenous arginine. J Clin Invest 87: 415–423, 1991. doi: 10.1172/JCI115012. [DOI] [PMC free article] [PubMed] [Google Scholar]
- 35.Orskov C, Rabenhøj L, Wettergren A, Kofod H, Holst JJ. Tissue and plasma concentrations of amidated and glycine-extended glucagon-like peptide I in humans. Diabetes 43: 535–539, 1994. doi: 10.2337/diab.43.4.535. [DOI] [PubMed] [Google Scholar]
- 36.Pipeleers DG, Schuit FC, Van Schravendijk CF, Van de Winkel M. Interplay of nutrients and hormones in the regulation of glucagon release. Endocrinology 117: 817–823, 1985. doi: 10.1210/endo-117-3-817. [DOI] [PubMed] [Google Scholar]
- 37.Pyke C, Heller RS, Kirk RK, Ørskov C, Reedtz-Runge S, Kaastrup P, Hvelplund A, Bardram L, Calatayud D, Knudsen LB. GLP-1 receptor localization in monkey and human tissue: novel distribution revealed with extensively validated monoclonal antibody. Endocrinology 155: 1280–1290, 2014. doi: 10.1210/en.2013-1934. [DOI] [PubMed] [Google Scholar]
- 38.Rocha DM, Faloona GR, Unger RH. Glucagon-stimulating activity of 20 amino acids in dogs. J Clin Invest 51: 2346–2351, 1972. doi: 10.1172/JCI107046. [DOI] [PMC free article] [PubMed] [Google Scholar]
- 39.Rouillé Y, Westermark G, Martin SK, Steiner DF. Proglucagon is processed to glucagon by prohormone convertase PC2 in alpha TC1-6 cells. Proc Natl Acad Sci USA 91: 3242–3246, 1994. doi: 10.1073/pnas.91.8.3242. [DOI] [PMC free article] [PubMed] [Google Scholar]
- 40.Römisch-Margl W, Prehn C, Bogumil R, Röhring C, Suhre K, Adamski J. Procedure for tissue sample preparation and metabolite extraction for high-throughput targeted metabolomics. Metabolomics 8: 133–142, 2012. doi: 10.1007/s11306-011-0293-4. [DOI] [Google Scholar]
- 41.Solloway MJ, Madjidi A, Gu C, Eastham-Anderson J, Clarke HJ, Kljavin N, Zavala-Solorio J, Kates L, Friedman B, Brauer M, Wang J, Fiehn O, Kolumam G, Stern H, Lowe JB, Peterson AS, Allan BB. Glucagon couples hepatic amino acid catabolism to mTOR-dependent regulation of α-cell mass. Cell Reports 12: 495–510, 2015. doi: 10.1016/j.celrep.2015.06.034. [DOI] [PubMed] [Google Scholar]
- 42.Steenberg VR, Jensen SM, Pedersen J, Madsen AN, Windeløv JA, Holst B, Quistorff B, Poulsen SS, Holst JJ. Acute disruption of glucagon secretion or action does not improve glucose tolerance in an insulin-deficient mouse model of diabetes. Diabetologia 59: 363–370, 2016. doi: 10.1007/s00125-015-3794-2. [DOI] [PubMed] [Google Scholar]
- 43.Taborsky GJ., Jr The physiology of glucagon. J Diabetes Sci Technol 4: 1338–1344, 2010. doi: 10.1177/193229681000400607. [DOI] [PMC free article] [PubMed] [Google Scholar]
- 44.Thorel F, Népote V, Avril I, Kohno K, Desgraz R, Chera S, Herrera PL. Conversion of adult pancreatic alpha-cells to beta-cells after extreme beta-cell loss. Nature 464: 1149–1154, 2010. doi: 10.1038/nature08894. [DOI] [PMC free article] [PubMed] [Google Scholar]
- 45.Unger RH, Ohneda A, Aguilar-Parada E, Eisentraut AM. The role of aminogenic glucagon secretion in blood glucose homeostasis. J Clin Invest 48: 810–822, 1969. doi: 10.1172/JCI106039. [DOI] [PMC free article] [PubMed] [Google Scholar]
- 46.Wagenmakers AJ. Muscle amino acid metabolism at rest and during exercise: role in human physiology and metabolism. Exerc Sport Sci Rev 26: 287–314, 1998. doi: 10.1249/00003677-199800260-00013. [DOI] [PubMed] [Google Scholar]
- 47.Wewer Albrechtsen NJ, Bak MJ, Hartmann B, Christensen LW, Kuhre RE, Deacon CF, Holst JJ. Stability of glucagon-like peptide 1 and glucagon in human plasma. Endocr Connect 4: 50–57, 2015. doi: 10.1530/EC-14-0126. [DOI] [PMC free article] [PubMed] [Google Scholar]
- 48.Wewer Albrechtsen NJ, Hartmann B, Veedfald S, Windeløv JA, Plamboeck A, Bojsen-Møller KN, Idorn T, Feldt-Rasmussen B, Knop FK, Vilsbøll T, Madsbad S, Deacon CF, Holst JJ. Hyperglucagonaemia analysed by glucagon sandwich ELISA: nonspecific interference or truly elevated levels? Diabetologia 57: 1919–1926, 2014. doi: 10.1007/s00125-014-3283-z. [DOI] [PubMed] [Google Scholar]
- 49.Wewer Albrechtsen NJ, Junker AE, Galsgaard KD, Holst JJ, Knop FK, Vilsbøll T. . Fasting levels of amino acids are correlated to hyperglucagonemia in patients with nonalcoholic fatty liver disease independently of type 2 diabetes. In: American Diabetes Association's 77th Scientific Sessions Abstract Book (June 9–13, 2017, San Diego, CA). Arlington, VA: American Diabetes Association, 2017. [Google Scholar]
- 50.Wewer Albrechtsen NJ, Kuhre RE, Pedersen J, Knop FK, Holst JJ. The biology of glucagon and the consequences of hyperglucagonemia. Biomarkers Med 10: 1141–1151, 2016. doi: 10.2217/bmm-2016-0090. [DOI] [PubMed] [Google Scholar]
- 51.Wewer Albrechtsen NJ, Kuhre RE, Toräng S, Holst JJ. The intestinal distribution pattern of appetite- and glucose regulatory peptides in mice, rats and pigs. BMC Res Notes 9: 60, 2016. doi: 10.1186/s13104-016-1872-2. [DOI] [PMC free article] [PubMed] [Google Scholar]
- 52.Wewer Albrechtsen NJ, Kuhre RE, Windeløv JA, Ørgaard A, Deacon CF, Kissow H, Hartmann B, Holst JJ. Dynamics of glucagon secretion in mice and rats revealed using a validated sandwich ELISA for small sample volumes. Am J Physiol Endocrinol Metab 311: E302–E309, 2016. doi: 10.1152/ajpendo.00119.2016. [DOI] [PubMed] [Google Scholar]
- 53.Yang J, MacDougall ML, McDowell MT, Xi L, Wei R, Zavadoski WJ, Molloy MP, Baker JD, Kuhn M, Cabrera O, Treadway JL. Polyomic profiling reveals significant hepatic metabolic alterations in glucagon-receptor (GCGR) knockout mice: implications on anti-glucagon therapies for diabetes. BMC Genomics 12: 281, 2011. doi: 10.1186/1471-2164-12-281. [DOI] [PMC free article] [PubMed] [Google Scholar]
- 54.Zukunft S, Sorgenfrei M, Prehn C, Möller G, Adamski J. Targeted metabolomics of dried blood spot extracts. Chromatographia 76: 1295–1305, 2013. doi: 10.1007/s10337-013-2429-3. [DOI] [Google Scholar]