Abstract
The design and laboratory tests of the interferometers for the Michelson Interferometer for Global High-resolution Thermospheric Imaging (MIGHTI) instrument which measures thermospheric wind and temperature for the NASA-sponsored Ionospheric Connection (ICON) Explorer mission are described. The monolithic interferometers use the Doppler Asymmetric Spatial Heterodyne (DASH) Spectroscopy technique for wind measurements and a multi-element photometer approach to measure thermospheric temperatures. The DASH technique and overall optical design of the MIGHTI instrument are described in an overview followed by details on the design, element fabrication, assembly, laboratory tests and thermal control of the interferometers that are the heart of MIGHTI.
Keywords: Remote sensing and sensors, Passive remote sensing, Interferometery, Spectrometers, Spectroscopy, high-resolution
1. Introduction
The Michelson Interferometer for Global High-resolution Thermospheric Imaging (MIGHTI) is one of four instruments on the NASA-sponsored Ionospheric Connection (ICON) Explorer mission. ICON investigates the extreme variability of the Earth’s ionosphere with a unique combination of sensors on-board a low Earth orbit satellite. MIGHTI uses the Doppler Asymmetric Spatial Heterodyne (DASH) Spectroscopy technique to derive thermospheric winds by measuring Doppler shifts of atomic oxygen airglow emission lines in the visible spectrum over an altitude range generally not accessible to in-situ probes. Specifically, MIGHTI measures neutral winds utilizing the atomic oxygen O(1S - 1D) transition at 557.7 nm (green line) and the O(1D - 3P) transition at 630.0 nm (red line). In addition, it uses a multiband photometric technique to derive thermospheric temperatures from the spectral shape of the molecular oxygen A-band in the near infrared near 760 nm. Heritage for MIGHTI is provided by the Wind Imaging Interferometer (WINDII) which was flown on NASA’s Upper Atmosphere Research Satellite (UARS) measuring both red and green line winds [Shepherd, et al., 2012, Shepherd, et al., 2016], and the Spatial Heterodyne Imager for Mesospheric Radicals (SHIMMER) on STPSat-1 [Englert et al., 2008, 2010]. In this paper we focus on the design, fabrication, assembly and testing of the DASH interferometers that are the heart of the MIGHTI instrument. More detail on the ICON mission and instruments along with additional information on MIGHTI’s operation, performance and data processing can be found elsewhere in this issue.
2. Brief Introduction to DASH
The DASH technique was developed specifically to measure atmospheric winds while simultaneously monitoring calibration signals to monitor instrument drifts [Englert et al. 2007]. The motivation for the DASH concept is shown schematically in Figure 1 where a single-sided interferogram from an isolated emission line is plotted in thin black. Zero path difference is at the left edge with increasing path difference to the right. The decrease in fringe amplitude with path difference is due to the thermal width of the emission line. Broader lines, corresponding to higher atmospheric temperatures, would result in the fringe envelope decreasing more rapidly with path difference. Also shown in light gray in Figure 1 is an emission with the same temperature but slightly different line center, corresponding to a wind-induced Doppler shift. Evident in these two interferograms is an increasing phase shift with path difference. The difference between these interferograms is plotted as the thick black line at the bottom of the figure. It is apparent that there is an optimum path difference, near 400 units in this illustration, where the difference amplitude is large and the measurement is most sensitive to wind. Near zero optical path difference the fringe amplitude is large but the Doppler induced phase shift is small while at large path difference the phase shift is large but the fringe amplitude is small. It can be shown [Englert et al. 2007] that for an isolated emission line of Gaussian lineshape, the optimum path difference is given by 2Δdopt = 1/(2πσD) where σD is the thermal width of the emission line in wavenumber units. The WINDII instrument typically measured four phase points over one wavelength of path difference to reconstruct the phase near 2Δdopt (indicated by the black arrow in figure 1). This approach has the limitation that only one isolated emission line can measured at a time, because a monochromatic fringe is required for retrieving the fringe phase. The DASH technique measures a much larger path difference interval, typically with hundreds of optical path difference samples, about this optimum position (indicated in red in figure 1) which enables the instrument to simultaneously measure multiple emission lines, including those from on-board calibration lamps. It is important to note that since the DASH technique measures only a limited range of path differences it cannot measure the shape of an emission line without a priori assumptions (e.g. Gaussian line shape). This is because line shape information is carried in the envelope of the interferogram which is only partially measured with DASH. However, information about the center wavelength of the emission which is directly related to the line of sight wind is carried in the fringe phase measurement for which DASH is optimized.
Figure 1.
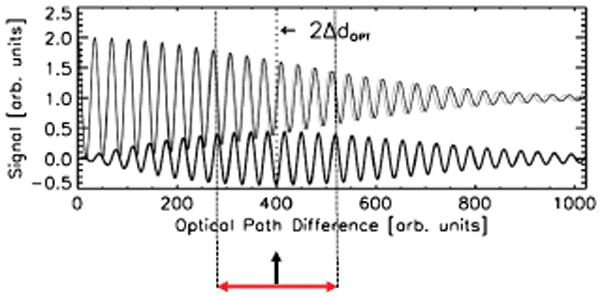
Schematic interferogram from an isolated thermally-broadened emission line. See text for details.
Figure 2 shows the optical implementation of the DASH technique. A monochromatic wavefront at the input of the interferometer from a telescope or collimator enters the left of the figure (indicated in red) and is incident on a beamsplitter. Fixed diffraction gratings terminate the arms of the interferometer such that the Littrow wavelength of the gratings return to the beamsplitter without deviation. Due to grating dispersion, wavelengths away from Littrow return with tilted exiting wavefronts, shown schematically in red at the exit of the interferometer, which produce a wavenumber-dependent Fizeau fringe pattern. The wavefront tilt in the figure is greatly exaggerated for clarity. The interference between these tilted wavefronts produces a low spatial frequency fringe pattern, as plotted at the lower left of the figure. The fringe pattern, which is localized near the plane of the gratings, is imaged by exit optics L1 and L2 onto an imaging detector (e.g. a charge coupled device, CCD). Note that the light at the Littrow wavelength of the gratings produces zero spatial frequency on the detector with adjacent wavelengths generating low spatial frequency fringes. In this way the interferogram can be thought of as being spatially heterodyned about the Littrow wavenumber enabling the instrument to measure a moderate spectral range with a relatively small number of CCD pixels.
Figure 2.
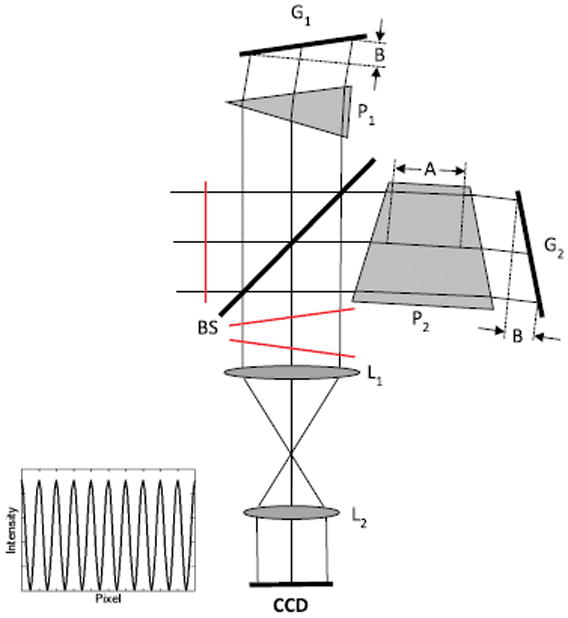
Optical arrangement of a DASH interferometer. An input monochromatic plane wave generates two coherent wavefronts at the output with a wavenumber-dependent tilt between them. The resulting fixed fringe pattern is detected on an imaging detector.
The path difference offset is shifted away from zero (black arrow in figure 1) by making one arm longer than the other as indicated schematically by A in Figure 2. The path difference interval (red in Figure 1), indicated by B in figure 2, occurs due to the tilt of the gratings. Due to its asymmetric arms, the DASH can be thought of as a conventional Spatial Heterodyne Spectrometer (SHS) [Harlander et al. 1992] with an offset aperture. Like SHS, no element is mechanically scanned to obtain an interferogram, rather the path difference across the aperture of the interferometer is imaged onto the detector. An alternate way to understand the interferometer is to consider the diffraction grating facets as a series of stepped mirrors which are imaged and thereby sample the required path difference interval spatially much like a step-scanned Fourier Transform Spectrometer would do temporally.
Also shown in Figure 2 are field widening prisms. From a geometric optics point of view, these prisms make the diffraction gratings appear coincident. This has the effect of increasing the field of view over which the interferometer achieves high fringe contrast by as much as three orders of magnitude compared to an interferometer without field widening [Harlander et al. 1992]. Multiple wavelengths can be measured simultaneously so long as the fringe frequencies of these lines are sufficiently different to be separated in Fourier (spectral) space. The ultimate spectral bandwidth is limited by the number of detector pixels (Nyquist limit) at the detector. More details of the DASH technique can be found in Englert et al. 2007.
3. Optics Overview
This section provides a description of the overall optical design of the MIGHTI instrument to provide context for the interferometer discussion to follow. The optical design and component specifications for the MIGHTI instrument were driven by the ICON science requirements and constrained by the spacecraft resources and technical maturity considerations. The MIGHTI instrument is comprised of two identical optical sensors oriented on the spacecraft at an azimuth angle of 45° and 135° degrees from the satellite velocity vector to provide perpendicular line of sight measurements of the Earth’s limb. Each sensor can be separated into three subassemblies: entrance optics that form an image of the limb on the interferometer gratings, an interferometer that superimposes a fringe pattern on the limb image, and exit optics that reimage the limb/fringe image separately for green and red/IR on the CCD. Figure 3 shows a schematic of the MIGHTI instrument. Some of the housing structure has been removed in these illustrations to reveal the key components. Figure 4 shows just the optics without their mounts.
Figure 3.

MIGHTI instrument layout. Left: One of the two identical optical units. The signal enters though the baffle (blue), and is modulated by a temperature stabilized interferometer. A cooled CCD camera detects the fringe patterns, which are used to retrieve the wind profiles, and the multispectral band signals, which are used to retrieve the temperature profiles. A honeycomb panel radiator (teal color) below the baffle rejects the heat from the cooled CCD camera. Right: all optical elements are mounted to the temperature controlled optical bench (purple). L denotes lenses, M mirrors, and F filters.
Figure 4.
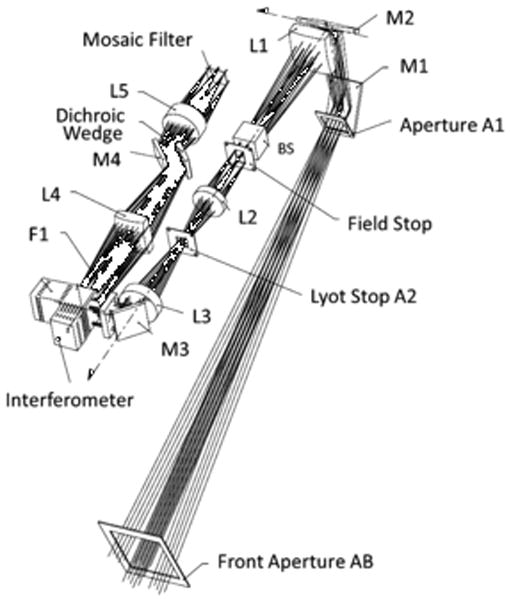
The MIGHTI optical components with the rays from the limb. L denotes lenses, M mirrors, BS beamsplitter, and F filters.
The atmospheric signal from the Earth’s limb enters each sensor through a baffle designed using a similar design concept as was implemented for WINDII [Englert et al. 2016, Gault et al. 1992]. The entrance pupil (A1) is located at the end of the baffle near mirror M1. Following the baffle and A1, light reflects from two plane mirrors (M1, M2) and through lens L1 which forms an image of the limb on the field stop limiting the tangent point altitude range to 85–300 km. Ultimately, this stop is reimaged onto the CCD detector, eliminating the need for altitude scanning and associated mechanisms. Just prior to the field stop, a calibration signal can be superimposed using a beamsplitter (BS) that transmits 95% of the atmospheric signal and injects 5% of the calibration signal into the optical path. Following the field stop, Lens L2 collimates the scene and simultaneously forms an image of the entrance pupil on the Lyot stop (A2). The Lyot stop is slightly undersized with respect to the image of the entrance pupil formed on it to block any spurious signal from the edges of the entrance pupil caused by illumination from the Sun or the bright atmosphere. To further increase the rejection of signal from outside the field of view when the Earth’s disk is illuminated during the day, two variable apertures, one at the entrance pupil (A1) and one at the Lyot stop (A2) are implemented. As was conceived and demonstrated by WINDII [Shepherd, et at., 2012], these apertures limit off-axis rays from the daytime Earth’s bright disk from entering the instrument and also decrease the étendue during the day to 15% of its night value. The daytime increase in brightness of the observed atmospheric emission features compensates for this étendue reduction, resulting in similar signal values for day and night [Englert et al. 2016]. Since the apertures A1 and A2 are located at the system pupils, the field of view is the same for both day and night observations. Lens L3 collimates the signal from the Lyot stop and forms an image of the field stop/limb on the diffraction gratings at the ends of the arms of the temperature-stabilized, monolithic interferometer. Following the interferometer a dichroic wedge, between relay lenses L4 and L5, separates the green and red signals so they can be detected side-by-side on the CCD detector array, thereby minimizing photon shot noise. A mosaic filter in front of the CCD allows the simultaneous wind and temperature measurements over the required altitude ranges [Englert et al. 2016]. The final CCD image (Figure 5) then consists of separate green and red/IR images of the limb with superimposed fringes, the phase of which carry the velocity information. The detector array utilizes an E2V42-80 back illuminated CCD chip in a frame transfer configuration. Details on the detector array design and performance can be found in Englert et. al. this issue.
Figure 5.
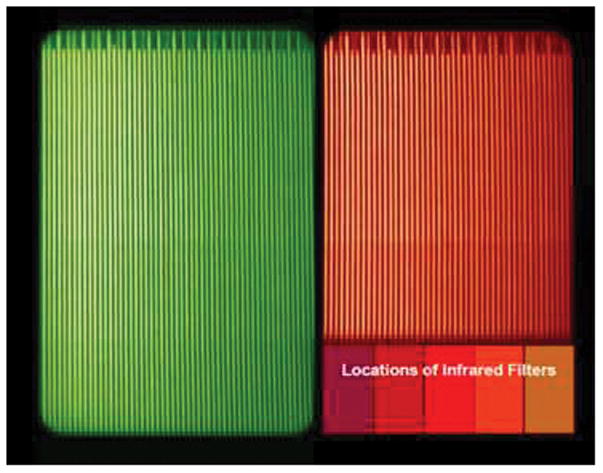
CCD image from one MIGHTI sensor taken during calibration showing the separation of the green and red/IR images. The fringes evident in the red and green wind channels are from Ne and Kr calibration lamps, respectively. The Earth’s limb, which is imaged on the CCD is oriented such that high altitudes are at the top of the image. The marks at the top of each image are burned into one of the interferometer gratings and are used to correct for any mechanical drift between the interferometer and the CCD. In normal operations the vertical direction will be binned a factor of 8 more than this image to obtain an altitude sampling of approximately 2.5 km.
4. Interferometer
The MIGHTI interferometer, schematically shown in Figure 6, receives a telecentric incident beam from the entrance optics of square profile f/9.0 along an edge. The entrance optics forms a 27.0 mm × 15.5 mm image of the Earth’s limb on the diffraction gratings located at the ends of the interferometer arms. The interferometer itself is a monolithic DASH design whereby a Fizeau fringe pattern is measured over a fixed path difference interval that is optimized for measuring the Doppler fringe phase shift associated with thermospheric winds. Although the spacer and prism angles are the same in both arms, the arm with the longer path utilizes a thicker field widening prism and thinner air spacer. As mentioned before, in this way a DASH interferometer can be thought of as a conventional Spatial Heterodyne Spectrometer with an offset aperture.
Figure 6.
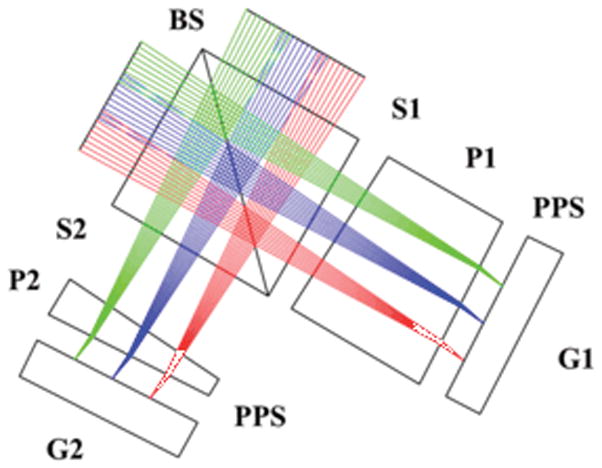
The MIGHTI Interferometer. The arms are terminated by identical low-order Echelle diffraction gratings G1 and G2. BS = N-BK7 cube beamsplitter, S1 = Fused Silica Spacer, S2 = CaF2 spacer, P1 and P2 are N-SF57 field widening prisms, PPS = Plane parallel fused silica spacer. The spacers (not shown) consist of hollow frames that are slotted to allow for differential thermal expansion between the elements they support (cf. figure 8).
Low order Echelle diffraction gratings, described in more detail in section 5, below, enable the interferometer to simultaneously process light from spectral bands diffracted from multiple grating orders. Specifically, MIGHTI measures thermospheric winds using the Doppler shift of the atomic oxygen red (630.0 nm, 7th grating order) and green (557.7 nm, 8th order) lines. Within each of these spectral passbands, emission lines of Ne (630.5 nm) and Kr (557.0 nm) from onboard calibration sources can be measured simultaneously to track residual thermal instrument drifts. In addition, MIGHTI measures lower thermospheric O2 A-band temperatures using a multi-channel photometer approach between 754 and 780 nm [Mende et al. 1988, Christensen et al. 2013, Sheese et al. 2010, 2011]. Although interference fringes are not utilized for this temperature measurement, the NIR signal passes through the interferometer (in grating order 6) before reaching the five photometer filters located at the detector shown in the lower right of Figure 5. The fringes superimposed on the signal within the NIR channels have spatial frequencies that are too high to be resolved by the CCD pixels so that the interferometer can be viewed as merely transmitting the signal. The five filters each have passbands of approximately 2 nm. Three of the filters (at 760.6, 763.2, and 765.6 nm) measure the A-band spectral shape which is a function of atmospheric temperature while the other two (at 754.5 and 780.6 nm) monitor the background signal. Additional details on the A-band temperature measurement and retrieval can be found in the companion paper by Stevens, et. al. in this issue.
The interferometer design parameters are shown in Table 1. N-SF57 was chosen as the prism material for its negative dn/dT at 630 nm which compensates for the change in grating groove spacing due to thermal expansion of the fused silica grating substrates. If not compensated, the grating expansion would result in a fringe frequency change with temperature [Harlander et al. 2010]. The materials and thicknesses of the spacers S1 (Fused Silica) and S2 (CaF2) were chosen to compensate the phase shift of the fringes as the arms expand and contract with temperature along their lengths.
Table 1.
Interferometer Design Parameters
| Path difference | |
| At center of interferogram | 5.1 cm |
| Interval | ± 0.4 cm |
|
| |
| Etendue (Night) | 0.055 cm2 steradian |
|
| |
| Beamsplitter (BS) | |
| Material | Schott N-Bk7 |
| Size | 42 × 32 × 32 mm |
| Beamsplitting coating | 50–50 Hybrid metallic non-polarizing |
|
| |
| Wedged Spacers (S1 & S2) | |
| Material (Hollow/Slotted) | CaF2 (S2), Fused Silica (S1) |
| Wedge angle | 3.402 degrees |
| Thickness @ center | 16.116 mm (S2), 5.573 mm (S1) |
|
| |
| Prisms (P1 & P2) | |
| Material | Schott N-SF57 |
| Wedge angle | 6.280 degrees |
| Thickness @ center | 5.554 mm (P2), 25.103 mm (P1) |
|
| |
| Parallel Spacers (PPS) | |
| Material (Hollow/Slotted) | Fused Silica |
| Thickness | 5.0 mm nominal |
|
| |
| Grating (G1 & G2) | |
| Blank material | Fused Silica |
| Groove density | 64.285 lines/mm |
| Blaze angle | 8.2 degrees |
| Material/coating | Gold on epoxy replica |
|
| |
| Cement | Norland 61 |
N-SF57 is a high dispersion glass for which the optimum thicknesses and angles of the field widening prisms are slightly different for red and green bands. Multi-element prism designs that mitigate the dispersive effects of a single prism were considered but rejected because they were difficult to thermally compensate and more difficult to fabricate. The single prism parameters chosen, shown in Table 1, are a compromise between the red and green optimum values. This compromise made the alignment of the interferometers, described in section 6.6 below, slightly more challenging.
5. Diffraction Gratings
The diffraction gratings terminating the arms of the MIGHTI interferometers are one of the key optical components in the design and from a fabrication standpoint one of the most technically challenging. Grating orders 6 (IR), 7 (red) and 8 (green) are each used simultaneously in a Littrow configuration. This multi-band approach has been described in more detail in Lawler et al. 2008 in the context of a high resolution broadband SHS instrument for laboratory astrophysics applications. It is important that the orders adjacent to the desired orders have as low diffraction efficiency as possible, not only to maintain efficiency in the desired orders, but also due to the large cone of light (f/9, square profile) incident on the gratings, roughly 1/3 of the signal diffracted into adjacent orders falls within the field of view of the instrument. This put significant demands on the grating roughness and groove shape.
During the grating fabrication process two master gratings were made by Bach Research in Boulder, CO. An initial master grating was fabricated and from it replicas were made. Groove shape measurements from these gratings provided input to a first-principles diffraction model that calculated the expected performance of the gratings. In parallel, laboratory measurements were made of the on- and off-blaze efficiency of these gratings to validate the theoretical model. These efforts provided feedback to improve the fabrication process to achieve better gratings, particularly with regard to high efficiency in desired orders and low efficiency in adjacent orders. A second master grating was fabricated from which the flight gratings were replicated. Additional details of the grating fabrication process and modeling can be found in a companion paper [Englert et al., 2017]. Shown in figure 7 is the measured efficiency versus order for the final flight gratings peaked in 8th order (green) and 7th order (red). Light from the non-desirable adjacent orders finds its way to the MIGHTI detectors resulting in fringes of much different frequency than the desired science or calibration lines (Table 2, below). This signal is roughly 1% of the signal from the desired order, producing a small amount of additional shot noise in the measurement.
Figure 7.
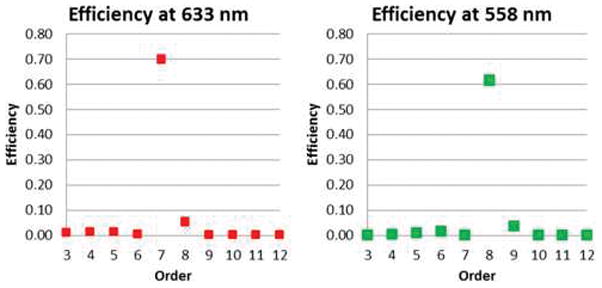
Flight grating efficiency vs. order. The grating was oriented near Littrow (8.2° angle of incidence) for both measurements. The reduced peak efficiency in the green is predominantly due to the reflectivity of the gold coating used to maximize the efficiency in the red.
Table 2.
Final Fringe Frequencies*
| Alignment Lines | Design Frequency (cycles/15 mm grating width) | Measured Frequency (cycles/15 mm grating width) | ||
|---|---|---|---|---|
| MTA | MTB | Flight Spare | ||
| HeNe Laser (632.8 nm) | −19.3 | −14 | −17 | −19 |
| Ne (630.5 nm) | 34.9 | 39 | 36 | 34 |
| Kr (557.0 nm) | 41.2 | 46 | 44 | 40 |
| Science Lines | Expected Frequency | |||
| Red (630.0 nm) | 45.3 | 50 | 47 | 45 |
| Green (557.8 nm) | 19.6 | 24 | 22 | 18 |
positive and negative frequencies indicate fringes from wavelengths shorter and longer than Littrow for the respective grating order.
6. Interferometer Assembly and Test
Figure 8 is a photograph of one of the three interferometers (two flight, one spare) after final assembly and cementing at LightMachinery Inc. in Ottawa, Ontario. The spacers surrounding the prisms are slotted to accommodate the differing thermal expansion of the beamsplitter, prisms, and gratings. The collimating lens used for the test at the input of the interferometer can be seen in the upper left of the figure. At the exit of the interferometer an Offner all reflective imaging system (not shown) was used to reimage the fringe localization plane, coincident with the gratings, onto a CCD detector.
Figure 8.
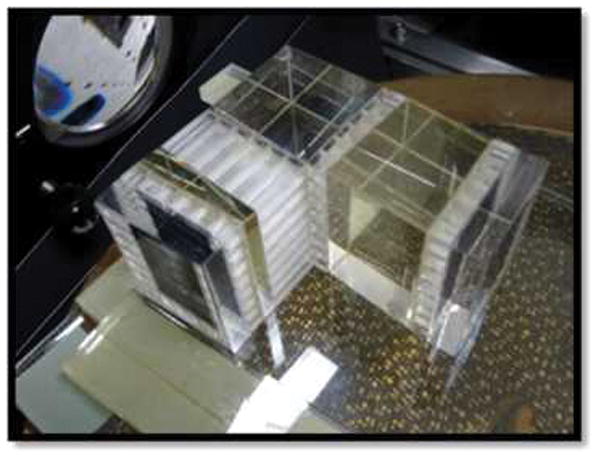
Photograph of the MIGHTI interferometer on the bench at LightMachinery. Orientation of the elements is similar to Figure 6. Table 1 provides more detail on each of the interferometer components.
The final fringe frequencies were set by making small tilts of grating G2 (cf. Figure 6) prior to bonding. Fringe frequencies obtained post-bonding are shown in Table 2 along with target design frequencies. Since the Doppler signal is contained in the change of phase of the fringes from nominal, the tolerance on setting the fringe frequencies is quite relaxed at roughly +/− 5 fringes across the image. Note that by design, the calibration lines have frequencies sufficiently different from the science lines to enable them to be easily separated in Fourier space. Fringe images for the Ne and Kr calibration lines are shown in Figure 5. Registration marks burned into the gratings terminating the short interferometer arms are evident at the top of each of the fringe images. These marks are used to register the grating position onto the CCD pixels in the event there is a shift of the image on the MIGHTI CCD. Although the interferometer simultaneously processes green (8th order), red (7th order) and NIR (6th order) passbands, to minimize shot noise in the measurement the red/NIR signals are separated from the green signal on the MIGHTI CCD by a dichroic mirror in the optical train following the interferometer (see discussion above).
To optimize the fringe visibility the geometric path difference, which affects the fringe visibility over a large field of view, was adjusted prior to cementing by translating prism P1 along spacer S1 while monitoring the fringe visibility produced by Ne (red) and Kr (green) calibration lamps. Due to prism dispersion, the optimum setting is a compromise between the red and green passbands. Figure 9 shows the modeled trade-off between the prism position on the spacer and the fringe visibility assuming purely monochromatic sources. The Ne and Kr pen-ray sources used in the alignment are not monochromatic resulting in an additional reduction in fringe visibility due to their spectral width. In the spectral domain the instrument broadening and source line widths are convolved to obtain the measured spectral shape. In the Fourier domain (fringe space) this convolution becomes a multiplication of fringe envelope functions. To remove the source width effects from the fringe measurements, the visibility due to the width of the source alone was measured separately using nearly collimated light (small input aperture) for which the instrument has very high fringe visibility. This value was then divided into the measured visibility at the nominal input aperture to obtain the visibility due to the instrument alone. An additional measurement of the fringe visibility was measured in the red using a frequency stabilized Helium-Neon laser of very narrow spectral width. Table 3 shows the post-assembly visibility values for each of the three interferometers after correcting for background light and source linewidth effects. As discussed in more detail in Englert et al. 2016, the fringe visibilities for each of the interferometers meet our driving requirements for the performance of the MIGHTI instrument.
Figure 9.
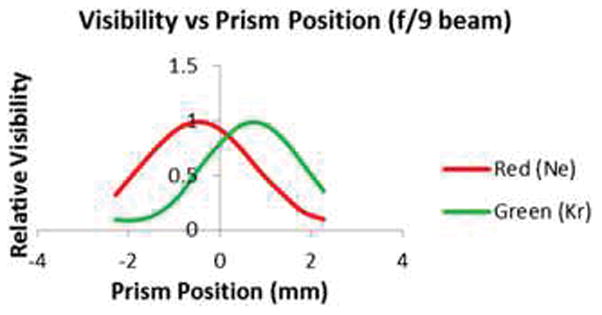
Modeled fringe visibility vs prism position. Prism position corresponds to shifting prism P1 along spacer S1 to adjust the path difference. Positive values correspond to a thicker prism.
Table 3.
Measured Fringe Visibilities
| Interferometer | Aperture | Corrected Fringe Visibility | |
|---|---|---|---|
| Red (Ne, [HeNe]) | Green (Kr) | ||
| MTA | Night (100%) | 0.89, [0.86] | 0.80 |
| Day (15%) | 0.95, [0.95] | 0.83 | |
| MTB | Night (100%) | 0.87, [0.81] | 0.88 |
| Day (15%) | 0.95, [0.94] | 0.90 | |
| Flight Spare | Night (100%) | 0.69, [0.63] | 0.95 |
| Day (15%) | 0.89, [0.90] | 0.95 | |
7. Thermal control
As discussed in section 4 above the MIGHTI interferometers were designed to be thermally compensated. However, this compensation is not perfect so it is important to control the thermal environment surrounding the interferometer to keep thermal drifts, which would be otherwise interpreted as winds, to a minimum. These drifts are caused by thermo-elastic distortions of the interferometer elements [Marr et al. 2013], uncertainties in the coefficients of thermal expansion and uncertainties in the thermal variation of index of refraction of the optical materials.
To mitigate these effects the MIGHTI interferometers are housed in a thermally stabilized enclosure (cf. Figure 3) that uses resistive heaters under PID (proportional–integral–derivative) control. The set point of the heaters, which is biased about 5° C above the optical baseplate, is controlled with an accuracy requirement of ±0.1° C. These heaters are in contact with the metal interferometer enclosure. Due to the high thermal conductivity of the enclosure, it will respond much more quickly to heater inputs than the interferometer which has a large thermal inertia and will therefore be more thermally stable than the enclosure. Note also that the interferometer is imaged on the CCD. This means that thermal gradients which result in fringe distortions are inconsequential as long as they are stable as they are removed by calibration.
Fringes from the Neon and Krypton calibration lamps which are measured at the same time as the atmospheric signal provide the means to measure and remove any residual thermal drift. Although it is possible to obtain calibration fringes simultaneously with every atmospheric measurement, the thermal environment is expected to be highly synchronized with the orbital period of the spacecraft, so the current operational plan is to monitor the effects of the thermal environment with the calibration lamps for only one orbit per day, roughly 1 orbit in every 16. This will reduce the shot noise from the calibration lamps in the atmospheric signal and conserve spacecraft power for the orbits that the lamps are off. See Englert et al. 2016 for an example of measurements taken during thermal-vacuum testing, where the calibration signal for one simulated orbit is used to correct a subsequent simulated orbit.
8. Summary
The interferometers are the most complex and critical optical components of the MIGHTI instrument requiring great care in design, fabrication, assembly and operation. They measure multiple wavelength bands simultaneously to enable temperature and Doppler wind measurements while imaging the Earth’s limb. The interferometers are monolithic (i.e. no moving parts), thermally compensated, and have sufficient étendue to measure thermospheric emission features with enough sensitivity to determine line of sight winds that can be inverted to obtain altitude dependent vector wind profiles.
Acknowledgments
The authors would like to acknowledge the following individuals:
MIGHTI Team: Rebecca Baugh, Glenn Weigle, Eloise Stump, Warren Tolson, Miles Newman, Steve Tanner
ICON Team: Thomas Immel
Bach Research (gratings): Eric Bach
JenOptik Inc (non-interferometer optics): Jay Kumler, Dan Sykora St Cloud State University (AFM grating measurements): Russel Lidberg Space Systems Research Corp (Grating modeling): John Seely
ICON is supported by NASA’s Explorers Program through contracts NNG12FA45C and NNG12FA42I.
References
- Christensen AB, Bishop RL, Budzien SA, Hecht JH, Mlynczak MG, Russell JM, III, Stephan AW, Walterscheid RW. J Geophys Res. 2013 doi: 10.1002/jgra.50317. [DOI] [Google Scholar]
- Englert CR, Babcock DD, Harlander JM. Appl Opt. 2007;46:7297. doi: 10.1364/ao.46.007297. [DOI] [PubMed] [Google Scholar]
- Englert CR, Stevens MH, Siskind DE, Harlander JM, Roesler FL, Pickett HM, von Savigny C, Kochenash AJ. Geophysical Research Letters. 2008 doi: 10.1029/2008GL035420. [DOI] [Google Scholar]
- Englert CR, Stevens MH, Siskind DE, Harlander JM, Roesler FL. J Geophys Res. 2010 doi: 10.1029/2010JD014398. [DOI] [Google Scholar]
- Englert CR, Harlander JM, Brown CM, Marr KD, Miller IJ, Stump JE, Hancock J, Peterson J, Kumler J, Morrow W, Mooney T, Ellis S, Mende SB, Harris SE, Stevens MH, Immel T. Space Sci Rev. 2016 doi: 10.1007/s11214-017-0358-4. this issue. [DOI] [PMC free article] [PubMed] [Google Scholar]
- Englert CR, Brown CM, Bach B, Bach E, Bach K, Harlander JM, Seeley JF, Marr KD, Miller I. High efficiency echelle gratings for MIGHTI, the spatial heterodyne interferometers for the ICON mission. Applied Optics. 2017 doi: 10.1364/AO.56.002090. submitted. [DOI] [PubMed] [Google Scholar]
- Gault WA, Brun JF, Desaulniers DL, Miller DW, Pasternak F, Rochon Y, Rupil JM, Shepherd GG. SPIE Vol 1753 Stray Radiation in Optical Systems. 1992;11:189. [Google Scholar]
- Harlander JM, Reynolds RJ, Roesler FL. Astrophys J. 1992;396:730. [Google Scholar]
- Harlander JM, Englert CR, Babcock DD, Roesler FL. Opt Ex. 2010;18:26430. doi: 10.1364/OE.18.026430. [DOI] [PubMed] [Google Scholar]
- Lawler JE, Labby ZE, Harlander JM, Roesler FL. Appl Opt. 2008;47:6371–6384. doi: 10.1364/ao.47.006371. [DOI] [PubMed] [Google Scholar]
- Marr KD, Englert CR, Harlander JM, Miller KW. Appl Opt. :52. doi: 10.1364/AO.52.008082. [DOI] [PubMed] [Google Scholar]
- Mende SB, Swenson GR, Llewellyn EJ, Denig WF, Kendall DJW, Slanger TG. J Geophys Res. 1988;93:12,861. [Google Scholar]
- Sheese PE, Llewellyn EJ, Gattinger RL, Bourassa AE, Degenstein DA, Lloyd ND, McDade IC. Can J Phys. 2010;88:919. [Google Scholar]
- Sheese PE, Llewellyn EJ, Gattinger RL, Bourassa AE, Degenstein DA, Lloyd ND, McDade IC. Geophys Res Lett. 2011 doi: 10.1029/2011GL047437. [DOI] [Google Scholar]
- Shepherd GG, Thuillier G, Cho Y-M, Duboin M-L, Evans WFJ, Gault WA, Hersom C, Kendall DJW, Lathuillère C, Lowe RP, McDade IC, Rochon YJ, Shepherd MG, Solheim BH, Wang D-Y, Ward WE. Rev Geophys. 2012 doi: 10.1029/2012RG000390. [DOI] [Google Scholar]
- Shepherd GG, Desaulniers D, Gault WA, Hersom C, Smith K, Scott A, Solheim B, Wimperis J. Wind Imaging Interferometer on NASA’s Upper Atmosphere Research Satellite. In: Qian Shen-En., editor. Optical Payloads for Space Missions. Chapter 18. John Wiley & Sons, Ltd; United Kingdom: 2016. [Google Scholar]
- Stevens MH, Englert CR, Harlander JM, England SL, Marr KD, Brown CM, Immel T. Space Sci Rev this issue. 2016 doi: 10.1007/s11214-017-0434-9. [DOI] [PMC free article] [PubMed] [Google Scholar]


