

Abstract
Background
Understanding the characteristics of men who initially present with metastatic prostate cancer (mPCa) can better enable directed improvement initiatives. The objective of this study was to assess the relationship between socioeconomic status (SES) and newly diagnosed mPCa.
Materials Methods
All men diagnosed with PCa in the National Cancer Data Base from 2004 to 2013 were identified. Characteristics of men presenting with and without metastatic disease were compared. A 4-level composite metric of SES was created using Census-based income and education data. Multivariable logistic regression was used to evaluate the association between SES, race/ethnicity, and insurance and the risk of presenting with mPCa at the time of diagnosis.
Results
Of 1,034,754 patients diagnosed with PCa, 4% had mPCa at initial presentation. Lower SES (first vs. fourth quartile; odds ratio [OR] = 1.39, 95% CI: 1.35-1.44), black and Hispanic race/ethnicity (vs. white; OR = 1.47, 95% CI: 1.43-1.51 and OR = 1.22, 95% CI: 1.17-1.28, respectively), and having Medicaid or no insurance (vs. Medicare or private; OR = 3.91, 95% CI: 3.78-4.05) were each independently associated with higher odds of presenting with mPCa after adjusting for all other covariates.
Conclusions
Lower SES, race/ethnicity, and having Medicaid or no insurance were each independently associated with higher odds of presenting with metastases at the time of PCa diagnosis. Our findings may partially explain current PCa outcomes disparities and inform future efforts to reduce disparities.
Keywords: Prostatic neoplasms, United States, Epidemiology, Neoplasm metastasis
1. Introduction
A stage migration away from advanced and metastatic prostate cancer (mPCa) occurred after prostate-specific antigen (PSA)-based screening became more prevalent in the 1990s [1]. Accordingly, there was a significant decline in PCa mortality since men were more often diagnosed at a localized, curable stage. Over the last several years, screening recommendations have evolved [2,3]. and there has been a decline in PCa screening and diagnosis [4]. Some have postulated that these factors may have contributed to recent decreases in the diagnosis of low-risk PCa and may eventually lead to increases in advanced PCa cases [4]. The current profile of men presenting with mPCa is poorly understood and the complex association between sociodemographics and stage at presentation may relate.
Socioeconomic status (SES), race, and insurance status have each been implicated as factors affecting stage at diagnosis of PCa [5–8], however, prior studies have been limited by small sample size or inability to evaluate the independent effect of each variable simultaneously. Evaluating the role of socioeconomics and demographics in the diagnosis of mPCa may reveal particularly vulnerable populations and improve disparities in outcomes.
It was our hypothesis that lower SES is independently associated with a higher odds of mPCa at the time of PCa diagnosis regardless of race or insurance status. We therefore used a large national cancer registry to compare socioeconomic, demographic, and clinical characteristics of men presenting with and without mPCa.
2. Materials and methods
2.1. Data source and patients
Data was sourced from the participant user file of the National Cancer Data Base (NCDB), an oncology registry developed by the American College of Surgeons’ Commission on Cancer and the American Cancer Society [9]. The NCDB is composed of over 1,500 Commission-accredited hospitals and captures data on about 40% of PCa cases in the United States [9,10].
All men diagnosed with adenocarcinoma of the prostate from 2004 through 2013 were identified. Only men treated at facilities that contributed patient data for every study year were included to avoid bias in temporal trends (n = 1,127,078). Men were excluded if data on American Joint Committee on Cancer clinical nodal and metastatic stage were missing (n = 32,531; 2.9%). Men with missing SES data were also excluded (n = 59,793; 5%).
2.2. Patient and reporting hospital characteristics
Patient characteristics assessed included year of diagnosis, age, Charlson-Deyo Comorbidity Index [11], geographic region, insurance type, and patient’s county population. Race and ethnicity were defined as non-Hispanic white, non-Hispanic black, Hispanic, and other/unknown. Hospital type were designated by the Commission on Cancer as a community program if they treat fewer than 500 cancer patients annually, and a comprehensive and academic program if they treat greater than 500. Academic programs also provide at least 4 graduate medical education programs [12]. Reporting hospital location was categorized as New England, Middle Atlantic, Southeast, Great Lakes, South, Midwest, West, Mountain, and Pacific.
Gleason score was determined from the largest histologic specimen available. Accordingly, radical prostatectomy pathologic Gleason score is used in lieu of prostate needle biopsy Gleason score when available. For the years 2010 to 2013, both biopsy Gleason score and radical prostatectomy Gleason score were recorded.
2.3. Socioeconomic status
The NCDB used American Community Survey data from 2008 through 2012 to categorize each patient into national quartiles of median household income and percentage of adults who did not graduate high-school based on patient ZIP Code Tabulation Areas.
We created a single, 4-level measure of SES based on 16 possible combined values for each patients’ quartiles of zip code income and education, following methods originally used to study the association of SES with breast cancer mortality [13]. To estimate joint zip code income and education SES levels, we used logistic regression to rank the odds ratios (ORs) of the likelihood of mPCa for all 16 zip code strata. Based on these results we empirically derived 4 mutually exclusive SES categories based on nonoverlapping 95% CIs, with the highest SES group being composed of patients from the highest quartiles of both education and income.
As an additional independent indicator of SES and access to care, insurance status (or coverage) was dichotomized as uninsured or Medicaid vs. other insurance (private or Medicare).
2.4. Outcome variable and statistical analysis
Our primary outcome was the presence of local or distant mPCa at time of diagnosis. This was defined as any patient with cN1 or cM1 as determined by American Joint Committee on Cancer tumor, node, and metastasis clinical staging. Unadjusted rates and categorical variables were compared using chi-squared testing. Multivariable logistic regression was used to test the significance of associations between patient socio-demographic characteristics, tumor, and reporting hospital characteristics, and the likelihood of a patient presenting with metastatic disease while adjusting for covariates that were selected a priori. Stata 13.0 (College Station, TX) was used for all statistical tests. All tests were 2-tailed and P < 0.05 was considered statistically significant. This study of deidentified, publicly available data was determined to be exempt by the Northwestern University Institutional Review Board.
3. Results
3.1. Patient characteristics
In our cohort of 1,034,754 men diagnosed with adenocarcinoma of the prostate during the study period, 4.0% presented with mPCa. Men were clinically node positive (N+) in 1.5% of cases, clinically metastatic (M+) in 3.3%, and both (N+M+) in 0.8%. Full cohort demographic details can be found in Supplemental Table S1. Black (5.9%) and Hispanic (6.2%) men had higher unadjusted percentages of metastases on presentation than white men (3.6%; Table S1). Men 75 and older accounted for only 16% of all PCa diagnoses, but represented 36% of men with mPCa.
Of the patients diagnosed with mPCa, PSA values were <10ng/ml in 17%, between 10 and <20ng/ml in 15%, between 20 and <50 ng/ml in 19%, and between 50 and <98 ng/ml in 17% and 98 ng/ml or greater in 35%. A total of 19,609 were diagnosed after 2009, during which time the NCDB recorded the site of metastases at diagnosis for distant metastases. Metastases to bone, brain, liver, and lung were present in 69%, 0.7%, 2.1%, and 3.9%, respectively.
3.2. SES and race/ethnicity
The derivation of our 4-level regional SES variable can be found in Table 1. Unadjusted rates of metastatic disease at diagnosis increased continuously from 3% in the first quartile SES group to 5% in the fourth quartile (Table S1). Among all races/ethnicities, lower SES was associated with a higher unadjusted proportion of mPCa (Fig. 1; all P < 0.05). Within each individual SES group, white men were less likely to be diagnosed with mPCa compared to black and Hispanic men (Fig. 1; all P < 0.001). Larger disparities in the absolute difference in odds of men with mPCa were seen between the first and fourth quartile SES groups among black and Hispanic men compared to white men.
Table 1.
Deriving a measure of socioeconomic status
| Income quartile | Education quartile | OR (95% CI) | Combined prevalence, n (%) | SES group OR (95% CI) |
|---|---|---|---|---|
| First | First | Reference | 222,764 (21.5) | Highest (first quartile) reference |
| Second | First | 1.11 (1.06-1.18) | 321,117 (31.0) | |
| First | Second | 1.16 (1.11-1.21) | Second highest (second quartile) | |
| Fourth | First | 1.20 (0.97-1.48) | 1.20 (1.17-1.24) | |
| Second | Second | 1.26 (1.22-1.31) | ||
| First | Third | 1.31 (1.22-1.41) | ||
| Third | Second | 1.31 (1.26-1.37) | 180,768 (17.5) | |
| Third | First | 1.35 (1.23-1.49) | Third highest (third quartile) | |
| First | Fourth | 1.36 (1.16-1.60) | 1.35 (1.30-1.39) | |
| Second | Third | 1.37 (1.31-1.43) | ||
| Fourth | Second | 1.42 (1.30-1.55) | ||
| Third | Third | 1.43 (1.37-1.48) | 310,105 (30.0) | |
| Fourth | Third | 1.68 (1.61-1.76) | Lowest (fourth quartile) | |
| Third | Fourth | 1.69 (1.61-1.78) | 1.69 (1.64-1.74) | |
| Second | Fourth | 1.74 (1.63-1.86) | ||
| Fourth | Fourth | 1.99 (1.92-2.07) |
Univariable logistic regression analyses were used to evaluate the association of 16 and then 4 combinations of zip code income and educations quartiles with presenting with metastatic prostate cancer (n = 1,034,754). All odds ratios were statistically significant, P < 0.05.
Fig. 1.
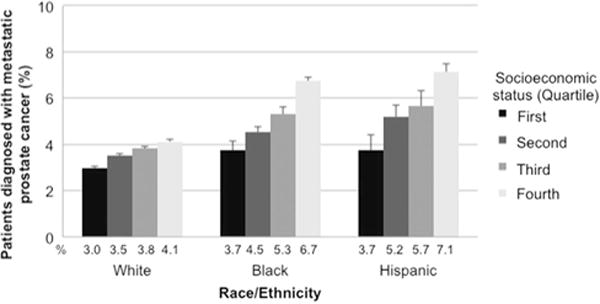
Unadjusted percentage of men with prostate cancer diagnosed with metastatic disease by race/ethnicity and socioeconomic status. All comparisons to the first quartiles of socioeconomic status were P < 0.05 for chi-squared analyses.
3.3. SES and insurance status
A total of 13% of men with Medicaid or no insurance presented with metastases compared to 4% with Medicare or private insurance (Table S1). Larger disparities in the absolute difference in odds of presenting with mPCa were seen between the first and fourth quartile SES groups in men with Medicaid or no insurance compared to those with private insurance or Medicare (all P < 0.05, Fig. 2).
Fig. 2.
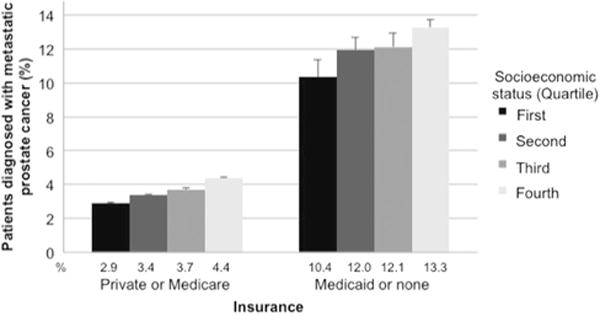
Unadjusted percentage of men with prostate cancer diagnosed with metastatic disease stratified by insurance and socioeconomic status. All comparisons to the first quartiles of socioeconomic status were P < 0.05 for chi-squared analyses.
3.4. Multivariable analysis
In a logistic regression model examining demographic and social factors (Table 2), the odds of presenting with mPCa remained significantly and independently associated with SES. Compared to the first quartile SES group, the odds of mPCa increased continuously with lower SES: second quartile, OR = 1.14 (95% CI: 1.10-1.17); third quartile, OR = 1.22 (95% CI: 1.18-1.27); and fourth quartile, 1.39 (95% CI: 1.35-1.44; Table 2). Similarly, insurance status remained independently associated with mPCa. Specifically, as compared to private insurance or Medicare, having Medicaid or no insurance was strongly associated with presenting with metastatic disease (OR = 3.91, 95% CI: 3.78-4.05, P < 0.001). Finally, after adjusting for the impact of several other factors including our composite SES variable and insurance status, the odds of presenting with mPCa were significantly higher in black (OR = 1.47, 95% CI: 1.43-1.51; P < 0.001) and Hispanic (OR = 1.22, 95% CI: 1.17-1.28; P < 0.001) men as compared to white men.
Table 2.
Multivariable logistic regression analysis for likelihood of presenting with metastatic prostate cancer at diagnosis
| Covariate | OR (95% CI) | P |
|---|---|---|
| Year | ||
| 2004 | Reference | |
| 2005 | 1.06 (1.01-1.11) | 0.02 |
| 2006 | 0.99 (0.94-1.04) | 0.7 |
| 2007 | 0.97 (0.93-1.02) | 0.3 |
| 2008 | 1.16 (1.10-1.22) | <0.001 |
| 2009 | 1.38 (1.31-1.44) | <0.001 |
| 2010 | 1.66 (1.58-1.74) | < 0.001 |
| 2011 | 1.66 (1.59-1.74) | < 0.001 |
| 2012 | 2.17 (2.07-2.27) | < 0.001 |
| 2013 | 2.40 (2.29-2.51) | < 0.001 |
| Age, y | ||
| 54 or younger | Reference | |
| 55-64 | 0.98 (0.95-1.02) | 0.4 |
| 65-74 | 1.31 (1.26-1.36) | < 0.001 |
| 75 or older | 4.19 (4.04-4.36) | < 0.001 |
| Race/ethnicity | ||
| White | Reference | |
| Black | 1.47 (1.43-1.51) | < 0.001 |
| Hispanic | 1.22 (1.17-1.28) | < 0.001 |
| Unknown/other | 1.01 (0.97-1.04) | 0.8 |
| Comorbidities | ||
| 0 | Reference | |
| 1 | 1.13 (1.10-1.17) | < 0.001 |
| >1 | 2.20 (2.10-2.30) | < 0.001 |
| Geographic location | ||
| New England | Reference | |
| Middle Atlantic | 0.89 (0.84-0.93) | < 0.001 |
| Southeast | 0.96 (0.92-1.01) | 0.1 |
| Great Lakes | 1.00 (0.95-1.05) | 0.9 |
| South | 0.77 (0.73-0.82) | < 0.001 |
| Midwest | 1.07 (1.01-1.13) | 0.013 |
| West | 0.97 (0.92-1.03) | 0.3 |
| Mountain | 1.08 (1.01-1.15) | 0.02 |
| Pacific | 1.01 (0.96-1.06) | 0.7 |
| Facility type | ||
| Community | Reference | |
| Comprehensive | 0.83 (0.80-0.85) | < 0.001 |
| Academic | 0.83 (0.80-0.86) | < 0.001 |
| Other | 0.78 (0.74-0.82) | < 0.001 |
| Uninsured or Medicaid | ||
| No | Reference | |
| Yes | 3.91 (3.78-4.05) | < 0.001 |
| Socioeconomic status group | ||
| First quartile | Reference | |
| Second quartile | 1.14 (1.10-1.17) | < 0.001 |
| Third quartile | 1.22 (1.18-1.27) | < 0.001 |
| Fourth quartile | 1.39 (1.35-1.44) | < 0.001 |
| Patient’s county population | ||
| ≥1 million | Reference | |
| 250,000-1 million | 0.94 (0.91-0.96) | < 0.001 |
| <250,000 | 0.89 (0.87-0.92) | < 0.001 |
Multivariable logistic regression analyses were used to evaluate the association of covariates with presenting with metastatic prostate cancer (n = 1,034,754). Bolded P values are statistically significant.
Because 1 patient presenting with PCa and enlarged nodes on subsequent axial imaging and 1 presenting with distant metastatic disease potentially represent 2 very scenarios with regard to access to health care, we repeated our multivariable analysis with the dependent variable being distant metastatic disease at the time of diagnosis (cM+). Black race, Hispanic ethnicity, and the lowest SES each had ORs similar to the main multivariable analysis with overlapping CIs (data not show). Having Medicaid or no insurance had a higher OR in this analysis (OR = 4.27, 95% CI: 4.17-4.42, P < 0.001).
4. Discussion
In 2013, the Institute of Medicine released a consensus report describing recommendations essential to delivering high-quality cancer care [14]. The report recommended improvements in the accessibility and affordability of cancer care as well as reductions in disparities involving access to cancer care [14]. Adequate access and use of health care services is integral to appropriate screening practices, which are most effective when at-risk populations are targeted and a diagnosis can be made at a treatable stage. In a national cancer data set, we found regional SES was significantly associated with a diagnosis of mPCa within each of the racial groups studied (white, black, and Hispanic) and in populations with similar insurance status. Moreover, in a multivariable model considering several sociodemographic factors, lower regional SES, race, and insurance status were significantly and independently associated with mPCa at diagnosis.
In considering metastatic stage at diagnosis rather than mortality, we were able to specifically assess the potential role of socioeconomic factors on PCa outcomes in the pretreatment realm. Previous studies have documented disparities in the presentation of advance or mPCa based on presentation to a government-funded vs. private hospital [7], low income and lack of insurance [5,6], and nonwhite race [5,8]. Given the large scale of the NCDB, we were able to simultaneously account for SES, race, and insurance in our cohort which revealed that each variable independently affected the odds of presenting with mPCa. This finding suggests each of these variables requires further investigation to address disparities in PCa outcomes.
There is a strong body of evidence demonstrating adverse PCa outcomes among racial minorities [15,16], but the reasons for such disparities remain poorly elucidated. Within the NCDB, even after accounting for SES, black, and Hispanic race/ethnicity were still associated with higher odds of mPCa. We also noted socioeconomic disparities in mPCa were greatest among black and Hispanic men. A number of potential causes for racial disparities have been proposed, ranging from tumor-specific molecular characteristics to social factors such as education and attitudes toward health care [17,18]. In light of these findings, it is important to improve early diagnostic strategies among these vulnerable racial groups.
Recent data have suggested racial/ethnic minorities receive fewer PSA screens at greater intervals [19]. Additionally, compared to white men, black men may be less informed about PCa and screening and have a more fatalistic understanding of diagnosis. That is, they are more likely to believe that a diagnosis of PCa always implies an imminent PCa death [20,21]. Efforts to improve knowledge regarding screening and reduce these beliefs among minorities may improve screening practices and therefore early detection among these groups. Additionally, instituting patient navigators in health systems with large proportions of underserved population have been shown to have large effects on the use of age-appropriate colorectal cancer screening [22]. Interventions such as these may prove valuable to reduce screening disparities and discrepancies in initial PCa screening.
Having Medicaid or no insurance had the strongest association with mPCa in our multivariable model, similarly, to a recent study using the Surveillance, Epidemiology and End Reports (SEER) database which demonstrated an increased risk of advanced PCa in those without insurance [23]. This is relevant in the era of the Affordable Care Act and rising rates of coverage. In the NCDB, providing insurance appears to have a positive effect of reducing the odds of presenting with mPCa among patients with PCa. However, socioeconomic disparities in mPCa presentation did exist even among patients with Medicare or private insurance, albeit to a smaller degree than those seen between patients with different insurance coverage. In addition to providing more insurance coverage, patient navigation strategies to improve access to screening among low SES populations [24] or follow-up after positive cancer screen [25] have the potential to be cost-effective ways to reduce late stage cancer diagnoses.
Strengths of our study include a large sample size of over 1,000,000 patients representing about 40% of all PCa diagnoses in the United states and the broad regional representation of the NCDB.
Limitations to our study include our retrospective design which does not account for unmeasured variables. SES can include factors in addition to education and income, such as occupation and employment status. Additionally, our analysis was limited to regional-level education and income levels rather than individual patient status. However, the strength of our SES analysis stems from using a large nation-wide dataset. Although our SES groupings are relative within our study population and the bias associated with the convenience sampling of the cohort, they still likely reflect national practice patterns.
Additionally, the NCDB is not a population-based dataset and is likely overly representative of patients seen at academic and large hospitals. For instance, compared to the population-based SEER dataset, the patients in the NCDB with PCa were slightly younger (less than 1 y), had slightly lower proportion of black patients (8.8% vs. 9.6%), had a slightly greater proportion of Hispanics (less than 2% difference), and slightly lower rate of patients with distant metastatic disease (17.3% vs. 18.6%) [26]. The study also does not include any information on individual screening practices among these men diagnosed with mPCa. Therefore, it is not appropriate to attribute these cases of mPCa to screening failures or health maintenance neglect. Finally, our outcome variable was metastatic disease at diagnosis, which does not consider metastasis detected later in the course of disease. In both the NCDB and SEER, this is labeled as clinical N and M staging which by definition would capture information at the time of diagnosis based on imaging, physical examination, and biopsy but before any surgical other treatment intervention. In the SEER dataset from 2007 to 2013, 5% of patients presented with “distant” metastatic disease and 12% presented with regional disease, whereas our data demonstrated 4% of patients presenting with cM+ or cN+ disease [27]. The reason for this discrepancy is likely owing to the SEER Summary Stage 2000 definition of “regional” disease which include locally invasive cancer (T3-T4) [28].
5. Conclusion
Decreasing SES, race/ethnicity, and having Medicaid or no insurance were each independently associated with increased odds of presenting with metastases at the time of PCa diagnosis. This finding may partially explain and inform future efforts to reduce previously demonstrated sociodemographic disparities in PCa outcomes.
Supplementary Material
Acknowledgments
National Institutes of Health, United States Grant no. 5U01CA196390 and the Prostate Cancer Foundation, United States. Northwestern Surgical Outcomes and Quality Improvement Center.
Appendix A. Supporting information
Supplementary data associated with this article can be found in the online version at http://dx.doi.org/10.1016/j.urolonc.2017.10.023.
References
- 1.Welch HG, Gorski DH, Albertsen PC. Trends in metastatic breast and prostate cancer. N Engl J Med. 2016;374:596. doi: 10.1056/NEJMc1515983. [DOI] [PubMed] [Google Scholar]
- 2.Moyer VA, U.S. Preventive Services Task Force Screening for prostate cancer: U.S Preventive Services Task Force recommendation statement. Ann Intern Med. 2012;157:120. doi: 10.7326/0003-4819-157-2-201207170-00459. [DOI] [PubMed] [Google Scholar]
- 3.U.S. Preventive Services Task Force. Screening for prostate cancer: U.S Preventive Services Task Force recommendation statement. Ann Intern Med. 2008;149:185. doi: 10.7326/0003-4819-149-3-200808050-00008. [DOI] [PubMed] [Google Scholar]
- 4.Jemal A, Fedewa SA, Ma J, et al. Prostate cancer incidence and PSA testing patterns in relation to USPSTF screening recommendations. J Am Med Assoc. 2015;314:2054. doi: 10.1001/jama.2015.14905. [DOI] [PubMed] [Google Scholar]
- 5.Dall’era MA, Hosang N, Konety B, et al. Sociodemographic predictors of prostate cancer risk category at diagnosis: unique patterns of significant and insignificant disease. J Urol. 2009;181:1622. doi: 10.1016/j.juro.2008.11.123. [DOI] [PubMed] [Google Scholar]
- 6.Miller DC, Litwin MS, Bergman J, et al. Prostate cancer severity among low income, uninsured men. J Urol. 2009;181:579. doi: 10.1016/j.juro.2008.10.010. [DOI] [PMC free article] [PubMed] [Google Scholar]
- 7.Porten SP, Richardson DA, Odisho AY, et al. Disproportionate presentation of high risk prostate cancer in a safety net health system. J Urol. 2010;184:1931. doi: 10.1016/j.juro.2010.06.116. [DOI] [PubMed] [Google Scholar]
- 8.Taksler GB, Keating NL, Cutler DM. Explaining racial differences in prostate cancer mortality. Cancer. 2012;118:4280. doi: 10.1002/cncr.27379. [DOI] [PubMed] [Google Scholar]
- 9.Winchester DP, Stewart AK, Bura C, et al. The National Cancer Data Base: a clinical surveillance and quality improvement tool. J Surg Oncol. 2004;85:1. doi: 10.1002/jso.10320. [DOI] [PubMed] [Google Scholar]
- 10.Siegel R, Naishadham D, Jemal A. Cancer statistics, 2013. CA Cancer J Clin. 2013;63:11. doi: 10.3322/caac.21166. [DOI] [PubMed] [Google Scholar]
- 11.Deyo RA, Cherkin DC, Ciol MA. Adapting a clinical comorbidity index for use with ICD-9-CM administrative databases. J Clin Epidemiol. 1992;45:613. doi: 10.1016/0895-4356(92)90133-8. [DOI] [PubMed] [Google Scholar]
- 12.American College of Surgeons. Cancer Program Categories. 2016 “Available at: http://www.facs.org/quality-programs/cancer/coc/apply/categories”. Accessed: March 25.
- 13.Feinglass J, Rydzewski N, Yang A. The socioeconomic gradient in all-cause mortality for women with breast cancer: findings from the 1998 to 2006 National Cancer Data Base with follow-up through 2011. Ann Epidemiol. 2015;25:549. doi: 10.1016/j.annepidem.2015.02.006. [DOI] [PubMed] [Google Scholar]
- 14.Institute of Medicine. Delivering high-quality cancer care: charting a new course for a system in crisis. Washington, DC: The National Academies Press; 2013. [PubMed] [Google Scholar]
- 15.Siegel RL, Miller KD, Jemal A. Cancer statistics, 2016. CA Cancer J Clin. 2016;66:7. doi: 10.3322/caac.21332. [DOI] [PubMed] [Google Scholar]
- 16.Faisal FA, Sundi D, Cooper JL, et al. Racial disparities in oncologic outcomes after radical prostatectomy: long-term follow-up. Urology. 2014;84:1434. doi: 10.1016/j.urology.2014.08.039. [DOI] [PMC free article] [PubMed] [Google Scholar]
- 17.Freedland SJ, Isaacs WB. Explaining racial differences in prostate cancer in the United States: sociology or biology? Prostate. 2005;62:243. doi: 10.1002/pros.20052. [DOI] [PubMed] [Google Scholar]
- 18.Faisal FA, Sundi D, Tosoian JJ, et al. Racial variations in prostate cancer molecular subtypes and androgen receptor signaling reflect anatomic tumor location. Eur Urol. 2016;70:14. doi: 10.1016/j.eururo.2015.09.031. [DOI] [PMC free article] [PubMed] [Google Scholar]
- 19.Carpenter WR, Howard DL, Taylor YJ, et al. Racial differences in PSA screening interval and stage at diagnosis. Cancer Causes Control. 2010;21:1071. doi: 10.1007/s10552-010-9535-4. [DOI] [PMC free article] [PubMed] [Google Scholar]
- 20.Forrester-Anderson IT. Prostate cancer screening perceptions, knowledge and behaviors among African American men: focus group findings. J Health Care Poor Underserved. 2005;16:22. doi: 10.1353/hpu.2005.0122. [DOI] [PubMed] [Google Scholar]
- 21.Hararah MK, Pollack CE, Garza MA, et al. The relationship between education and prostate-specific antigen testing among urban African American Medicare beneficiaries. J Racial Ethn Health Disparities. 2015;2:176. doi: 10.1007/s40615-014-0061-z. [DOI] [PMC free article] [PubMed] [Google Scholar]
- 22.Joseph DARD, DeGroff A, Butler EL. Use of evidence-based interventions to address disparities in colorectal cancer screening. MMWR Suppl. 2016;65:21–8. doi: 10.15585/mmwr.su6501a5. [DOI] [PubMed] [Google Scholar]
- 23.Amini A, Jones BL, Yeh N, et al. Disparities in disease presentation in the four screenable cancers according to health insurance status. Public Health. 2016;138:50. doi: 10.1016/j.puhe.2016.03.014. [DOI] [PubMed] [Google Scholar]
- 24.Honeycutt S, Green R, Ballard D, et al. Evaluation of a patient navigation program to promote colorectal cancer screening in rural Georgia, USA. Cancer. 2013;119:3059. doi: 10.1002/cncr.28033. [DOI] [PubMed] [Google Scholar]
- 25.Bensink ME, Ramsey SD, Battaglia T, et al. Costs and outcomes evaluation of patient navigation after abnormal cancer screening: evidence from the Patient Navigation Research Program. Cancer. 2014;120:570. doi: 10.1002/cncr.28438. [DOI] [PMC free article] [PubMed] [Google Scholar]
- 26.Mettlin CJ, Menck HR, Winchester DP, et al. A comparison of breast, colorectal, lung, and prostate cancers reported to the National Cancer Data Base and the Surveillance, Epidemiology, and End Results Program. Cancer. 1997;79:2052. doi: 10.1002/(sici)1097-0142(19970515)79:10<2052::aid-cncr29>3.0.co;2-s. [DOI] [PubMed] [Google Scholar]
- 27.Surveillance E, End Results Program Cancer Stat Facts: Prostate Cancer. Web. Accessed 8 Aug. 2017 Available at: seer.cancer.gov/statfacts/html/prost.html.
- 28.Young JLRS, Jr, Ries LAG, Fritz AG, Hurlbut AA. SEER Summary Staging manual— 2000 codes and coding instructions. Bethesda, MD: National Cancer Institute; 2001. [Google Scholar]
Associated Data
This section collects any data citations, data availability statements, or supplementary materials included in this article.