

Abstract
An intercomparison of high-latitude precipitation characteristics from observation-based and reanalysis products is performed. In particular the precipitation products from CloudSat provide an independent assessment to other widely used products, these being the observationally-based GPCP, GPCC and CMAP products and the ERA-Interim, MERRA and NCEP-DOE R2 reanalyses. Seasonal and annual total precipitation in both hemispheres poleward of 55° latitude is considered in all products, and CloudSat is used to assess intensity and frequency of precipitation occurrence by phase, defined as rain, snow or mixed phase. Furthermore, an independent estimate of snow accumulation during the cold season was calculated from the Gravity Recovery and Climate Experiment (GRACE). The intercomparison is performed for the 2007–2010 period when CloudSat was fully operational. It is found that ERA- Interim and MERRA are broadly similar, agreeing more closely with CloudSat over oceans. ERA-Interim also agrees well with CloudSat estimates of snowfall over Antarctica where total snowfall from GPCP and CloudSat is almost identical. A number of disagreements on regional or seasonal scales are identified: CMAP reports much lower ocean precipitation relative to other products, NCEP-DOE R2 reports much higher summer precipitation over northern hemisphere land, GPCP reports much higher snowfall over Eurasia, and CloudSat overestimates precipitation over Greenland, likely due to mischaracterization of rain and mixed-phase precipitation. These outliers are likely unrealistic for these specific regions and time periods. These estimates from observations and reanalyses provide useful insights for diagnostic assessment of precipitation products in high latitudes, quantifying the current uncertainties, improving the products, and establishing a benchmark for assessment of climate models.
1. Introduction
Precipitation characteristics are expected to change in a warming climate [Trenberth 2003; Stephens et al., 2008]. Accurate quantification of the amount and distribution of precipitation is critical to understanding the current state of Earth’s climate and water and energy budget [Stephens et al., 2012; Trenberth et al., 2007; Rodell et al., 2015; L’Ecuyer et al., 2015], and how the hydrological cycle responds to the energy imbalances that force climate change [Andrews et al., 2009]. Changes in the amount, frequency, and intensity of precipitation can significantly impact regional hydrologic processes and may have severe impacts on socioeconomic sectors and agricultural productivity.
High-latitude regions respond more strongly to anthropogenic climate change than other regions according to surface temperature observations and climate model simulations [Serreze and Francis, 2006; Solomon et al., 2007], and an intensification of high-latitude precipitation is also projected by climate models [Lau et al., 2013]. Reported changes in high-latitude hydrology have been inferred from changes in snow cover, mountain glacier area, permafrost extent and lake area [Smith et al., 2005; Alley et al. 2007], and increasing freshwater discharge [Yang et al., 2002; Dyurgerov and Carter, 2004; McClelland et al., 2006]. Reduced uncertainty in precipitation estimates is required to fully contextualize these changes, understand physical processes, and reliably detect and quantify possible changes in the high-latitude hydrological cycle [Ye et al., 2014].
Climate models are known to contain large biases in precipitation [Stephens et al., 2010] and observational precipitation products contain large uncertainties [Behrangi et al., 2012] particularly where ground measurements are sparse, such as over the oceans and high-latitude regions [Adler et al., 2012]. It is therefore essential to characterize and utilize other observation sources to quantify high-latitude precipitation. This is especially important as the number of precipitation gauges at northern high latitudes has sharply decreased since 1990 [Serreze et al., 2005] and only a handful of gauges are operating in Antarctica. Furthermore, existing gauges often face large biases caused by a number of factors such as wind-induced undercatch [Goodison et al., 1998], particularly for snow, where correction factors can lead to uncertainties of order 100% [Yang et al., 2005; Fuchs et al., 2001].
Given the importance and challenge of quantifying high-latitude precipitation, the present study investigates high-latitude precipitation from products that are often used in climate analysis and assessments of climate models. Furthermore, newly emerged capabilities for quantification of high-latitude precipitation with the CloudSat Cloud Profiling Radar (CPR)[Stephens et al., 2008] and the Gravity Recovery and Climate Experiment (GRACE)[Tapley et al., 2004] are exploited to provide independent precipitation or accumulation estimates.
CloudSat provides direct observations of snow and light rainfall at high latitudes with unprecedented signal sensitivity (e.g., minimum detectable signal of ~−28 dBZ) but, it suffers from occasional signal saturation which we ameliorate here by referring to the Advanced Microwave Scanning Radiometer-Earth Observing System (AMSR-E). CloudSat provides a rain product that is optimized for use over the oceans where no gauges are available, and a snow product that is designed to work over both land and ocean, and which is not vulnerable to the large uncertainties introduced by gauge undercatch of snow in windy conditions. Another instrument that has shown highly useful for measuring total snow accumulation [Landerer et al., 2010; Swenson, 2010] is NASA’s Gravity Recovery And Climate Experiment (GRACE) satellite mission. GRACE provides monthly observations of changes in the Earth’s gravity field and is well suited for measuring changes in continental-scale water storage. To our knowledge this is the first time that global high latitude precipitation is assessed using such various datasets.
Detailed information about the products, instruments and methods are provided in Section 2. Section 3 reports and discusses the results of the intercomparison split by region before Section 4 concludes.
2. Data resources and methods
Current precipitation products may be considered as belonging to one of four groups: gauge-only, satellite-only, satellite and gauge, and reanalysis. Each product was remapped onto a common 2.5°×2.5° lat-lon grid to match the lowest-resolution dataset, avoiding issues with downscaling and ensuring sufficient CloudSat retrievals within each grid cell. We remapped the products using linear spatial interpolation. While there are numerous interpolation schemes available (e.g., Kriging, Linear, Natural Neighbor, Nearest Neighbor, Polynomial Regression), we use linear interpolation as it makes very little difference on the gridded quantity averages. These methods were applied to CloudSat precipitation rates and found that the choice of the method resulted in a maximum difference of 0.005% compared to the linear method. Intercomparison is conducted for the period 2007 to 2010, during which both CloudSat and AMSR-E were almost fully functional.
2.1. Gauge product
2.1.1. GPCC
The Global Precipitation Climatology Centre (GPCC) was established in 1989 at Deutscher Wetterdienst under the World Meteorological Organization (WMO) as the in situ component of the Global Precipitation Climatology Project (GPCP) of the Global Energy and Water Exchanges (GEWEX) project. GPCC integrates data from various networks, organizations, and additional precipitation data through bilateral contacts and with the support of WMO to its database [Schneider et al., 2014] and thus employs more gauges compared to other popular gauge products. However, in many regions --especially at high latitudes-- gauges are sparse or non-existent. For example, only a handful of gauges are operating over entire Antarctic and Greenland (Fig. 1). Therefore, gauge-based estimates of precipitation in these regions have to rely on interpolation of sparse data, reducing the quality of the product there.
Figure 1.

Number of stations in each 2.5°x2.5° grids used in GPCC. The map is constructed by averaging the number of stations during 2007 to 2010.
Before merging the data from different sources, quality control and homogenization of station metadata are performed, but the product does not include bias correction for systematic gauge measuring errors. In this study we used GPCC Full Data Reanalysis Version 7.0 at 2.5°×2.5° resolution. Details for construction of gridded precipitation products and data access are described in Becker et al. (2013) and Schneider et al. [2014; 2015].
2.2. Satellite-gauge products
2.2.1. GPCP
GPCP was formed as a community-based analysis of global precipitation under the auspices of the World Climate Research Program (WCRP) and is being widely used by the research community. GPCP is a merged product using data from gauges over land, and from spaceborne sensors over both land and ocean including Special Sensor Microwave Imager (SSMI), Special Sensor Microwave Imager/Sounder (SSMIS), and geostationary and polar orbiting infrared imagers and sounders. Gauge-based estimates are adjusted for gauge undercatch using climatological factors. In the high latitudes (starting at ~40°), precipitation (including snow) rate is obtained using a regression relationship between historical collocated rain gauge measurements (adjusted for wind loss, including relation to snow) and a few cloud-related parameters (e.g., cloud-top pressure, fractional cloud cover, and cloud-layer relative humidity; Susskind et al. [1997]). The cloud parameters are retrieved from Television Infrared Observation Satellite (TIROS) Operational Vertical Sounder (TOVS) and Atmospheric Infrared Sounder (AIRS).
The latest version of the monthly 2.5°×2.5° resolution GPCP product (version 2.2; Huffman and Bolvin, [2012]) available from Goddard Earth Sciences Data and Information Services Center (GES DISC) is used. Detailed description of the product can be found in [Adler et al., 2003; Huffman et al., 2009; Huffman and Bolvin, 2012].
2.2.2. CMAP
The Climate Prediction Center (CPC) Merged Analysis of Precipitation (CMAP) product [Xie and Arkin, 1997] is also widely used. CMAP provides gridded global monthly estimate of precipitation at monthly 2.5°×2.5°resolution using many of the same datasets as GPCP. It also uses precipitation data from Microwave Sounding Units (MSUs). However, the merging of the individual data sources is different from GPCP. Unlike GPCP it does not use AIRS/TOVS in high latitudes and makes no undercatch adjustment for gauge measurements. Over land, the blended analysis is controlled by gauge observations which capture snowfall, but over ocean the satellite estimates (IR and PMW) implicitly include snowfall as they only estimate total precipitation and snow remains to be difficult to retrieve. The product was obtained from the NOAA’s Earth System Laboratory via: http://www.esrl.noaa.gov/psd/data/gridded/data.cmap.html. Unlike GPCP, CMAP does not adjust gauge-based estimates for assumed undercatch.
2.3. Satellite-only products
2.3.1. CloudSat
The 94-GHz nadir-looking CPR on CloudSat provides unprecedented sensitivity to retrieve snowfall and light rain. The CPR footprint is ~ 1.7 km along track and ~1.4 km cross track. CloudSat precipitation data have been invaluable in advancing cold-region and high-latitude precipitation analysis [Behrangi et al., 2012; 2014a,b; Palerme et al, 2014].
Three CloudSat products are used here: 2C-PRECIP-COLUMN R04 (henceforth “2c- column”; Haynes et al. 2009), 2C-RAIN-PROFILE R04 (henceforth “2c-rain”)[Lebsock and L’Ecuyer, 2011] and 2C-SNOW-PROFILE (henceforth “2c-snow”)[Wood et al., 2013 and 2014] along with the CloudSat auxiliary AMSR-E product CS_AMSRE-AUX (henceforth “AMSR-E”) generated by CloudSat team. All data are available at: http://www.cloudsat.cira.colostate.edu.
The 2c-column product provides precipitation occurrence through flags representing the phase (rain, snow or mixed) and likelihood of precipitation (certain, probable, possible). The 2c-rain product then calculates rain rate when the flag is certain for rain or mixed phase, while the 2c-snow product calculates snow also in snow possible cases provided that the estimated melted fraction is under 0.1. For consistency we restrict our analysis to “certain” for all phases. Where the flag is rain certain, the corresponding intensity is extracted from 2c-rain, for snow certain the intensity is taken from 2c-snow, and for mixed phase certain the mean value from 2c-snow and 2c-rain is used if both are nonzero, otherwise the single nonzero value from 2c-snow or 2c-rain is used. This occurs in few cases due to temperature or melted-fraction thresholds in the retrieval algorithms.
In intense rain the radar signal is saturated and the CloudSat algorithm provides a lower limit on the rain intensity, although some adjustments can be made to provide better estimates of heavy precipitation [Stephens et al., 2010; Matrosov, 2014]. Here we choose to make no adjustment and select the largest value out of this lower limit and the coincident AMSR-E from CS_AMSRE-AUX. In the Southern Hemisphere poleward of 55° latitude (SH55), 0.4% of rain events result in saturation, and in the Northern Hemisphere poleward of 55° (NH55) 0.2% are saturated. Thus, while there is a potential underestimate of precipitation rates in the most intense events, the size of this underestimate should be limited by the rarity of these events and the inclusion of AMSR-E retrievals.
Similarly, the exclusion of possible or probable precipitation events may lead to an underestimate, although analysis of the 2c-snow product suggests that this is also small. Non-certain events tend to be of low intensity and in the case of the 2c-snow product, including non-certain snow events would only increase the mean snowfall rate in the SH55 region by +2.9% and in the NH55 region by +4.5%.
There are further issues to consider regarding the CloudSat rain rate retrieval algorithm. Firstly, it uses ocean reflectance properties in its path integrated attenuation approach [Haynes et al., 2009]. Over land the surface reflectivity properties are not as well known, resulting in uncertainty in the rain rate retrievals. The magnitude of any potential bias has not yet been quantified. Secondly, when the surface topography is rough the CPR may receive backscatter from ice or land surfaces at high altitudes, which it misinterprets as being very intense near surface rain. The 2c-snow algorithm uses vertical reflectivity continuity tests to eliminate this scenario, but these tests have not been applied to the 2c-rain product to date. The above issues affect only the rain rates retrieved over land, and not the frequency of occurrence or snow rates. A relevant concern for all of the CloudSat retrievals is that it does not fully sample the diurnal cycle with overpasses occurring near 1:31 a.m. and 1:31 p.m. local time. We are unable to correct for this sampling issue and it remains an unquantified source of uncertainty. However, as shown in Behrangi et al. [2012] the effect is likely small over ocean.
2.3.2. GRACE
The Gravity Recovery and Climate Experiment (GRACE) data are used to calculate precipitation accumulation during the winter season over land. GRACE is a twin satellite mission that has measured range-rate variations between the two satellites using microwave interferometry since 2002. Gravity changes due to mass redistribution by solid-earth processes and hydrology perturb the GRACE orbit, allowing retrieval of mass variations with high accuracy [Tapley et al., 2004]. GRACE has been used extensively to study changes in terrestrial water stores (snow, ice, surface water, soil moisture, and groundwater [Niu et al., 2007; Swenson and Wahr, 2007; Swenson et al., 2006; Swenson et al., 2010; Landerer et al., 2010].
During winter, almost all land poleward of 55° latitude experiences near surface temperature below −2°C, and hence much of the precipitation falls as snow. Evapotranspiration and runoff are relatively small in winter [Serreze et al., 2003; Lammers et al., 2001], such that, after accounting for solid earth processes, the gravity anomaly measured by GRACE over high latitude regions at this time of year is primarily due to the accumulated snowfall. A GRACE-based estimate of winter precipitation accumulation is unique in that: (i) it is based on a completely independent technique (gravimetry versus radiometry) with no need for empirical parameterizations, ground-based calibration, or correction for gauge undercatch, (ii) it captures accumulated precipitation so does not miss precipitation occurring between satellite overpasses, and (iii) during wintertime, other satellites and ground measurements face the highest uncertainty. Furthermore, the measurement noise of GRACE is smallest in high latitudes because of GRACE’S high density of orbits there.
Precipitation accumulation is calculated from GRACE Terrestrial Water Storage Anomaly (TWSA) based on mass conservation [Dingman, 2008]. If t1 is accumulation start-time (e.g., early winter] and t2 is the accumulation end-time (e.g., late winter) for domain D, the water storage change between time t1 and t2 can be calculated as
| 1 |
Where S, P, ET, Q, represent water storage, precipitation, evapotranspiration, and discharge for domain D, respectively and Δ represents the net change between t1 and t2. ΔP is the accumulated precipitation during winter.
Over the Greenland and Antarctic ice sheets, the use of GRACE to estimate the accumulated snowfall is complicated by ice divergence (continual export of mass from the interior to the oceans via ice flow)[Rignot et al., 2011]. Therefore, the present study does not include these regions in the analysis.
Monthly 1° × 1° gridded GRACE total water storage anomalies are obtained from the latest release (RL 5) from Center for Space Research at University of Texas, Austin (CSR ) with corrections applied [Landerer and Swenson, 2012; Swenson and Wahr, 2006], available at http://gracetellus.jpl.nasa.gov/. Sakumura et al. [2014] showed that using an ensemble average of the gravity field solutions from CSR and two other processing centers can reduce noise. However, differences between the three products are small and fall within the error bounds of the GRACE solution itself. Evapotranspiration and runoff are obtained from GLDAS Noah Land Surface Model L4 monthly 0.25 × 0.25 degree Version 2.0 (GLDAS_NOAH025_M) product [Rodell et al., 2004], available from NASA Goddard Earth Sciences (GES) Data and Information Services Center (DISC). The calculations are performed at 1° × 1° resolution and the results are mapped to the common 2.5° × 2.5° resolution used for comparison
2.4. Reanalysis products
2.4.1. ERA-interim
ERA-interim [Dee et al., 2011; Simmons, 2014] is the latest European Center for Medium-Range Weather Forecasting (ECMWF) global atmospheric reanalysis. ERA-interim relies on a 4D-VAR (rather than 3D-Var as in ERA-40) system which uses observations within 12-hour windows to initialize forecast simulations. This study uses daily precipitation obtained from http://apps.ecmwf.int/datasets/ at 1.5° × 1.5° spatial resolution.
2.4.2. MERRA
The Modern Era Retrospective-Analysis for Research and Applications (MERRA) [Rienecker et al., 2011; Bosilovich et al., 2011] uses the Goddard Earth Observing System Data Assimilation System version 5 (GEOS-5; Rienecker et al., [2011]) to assimilate observations (e.g., radiance data) for the retrospective analyses. In the present study precipitation is obtained from the latest version of the MERRA product (V 5.2) available at GES DISC with resolution of 2/3° longitude by 1/2° latitude.
2.4.3. NCEP-DOE R2
The National Centers for Environmental Prediction-Department of Energy Reanalysis 2 (NCEP-DOE R2) product [Kanamitsu et al., 2002] uses a global data assimilation system and numerical weather prediction model to produce atmospheric analyses using historical data and also to produce analyses of the current atmospheric state from 1979 to the present. The Reanalysis-2 product fixed errors and updated parameterizations of physical processes that hampered earlier versions. This product has 17 vertical pressure levels globally gridded at T62 spatial resolution (~1.875°X1.875°) four times daily. Data is provided by the NOAA-ESRL Physical Sciences Division, Boulder Colorado from their web site at http://www.esrl.noaa.gov/psd/.
2.5. Calculation method for precipitation characteristics
2.5.1. Development of CloudSat gridded products
CloudSat data are transferred onto a 2.5°×2.5° grid, and the mean monthly intensity climatology is estimated by dividing the sum of all precipitation intensities for the month and grid cell by the total number of valid measurements determined as the cases in which 2c-column status_flag < 10. CloudSat is also used to provide maps of the frequency of rain occurrence, and the total number of certain precipitation retrievals is divided by the total number of valid retrievals within a grid cell. Reported precipitation frequency depends on the spatial scale, in this case reported values are precipitation frequency at the natural scale of the CPR footprint.
In each case separate maps were produced for rain, mixed-phase precipitation and snow, and these were summed to obtain total precipitation rate or frequency.
2.5.2. Calculation of regional and hemispheric precipitation rates
Total precipitation rates from each product were calculated for a number of regions including the northern hemisphere north of 55°N (NH55), southern hemisphere south of 55°S (SH55). As CloudSat only fully covers grid cells in the latitude band 80°N-S, area-mean intensities for hemispheric averages are only reported for the 55°−80° latitude bands.
In addition, the hemispheric averages were split into land and ocean and separate estimates were made for the Greenland and Antarctic ice sheets. For each product these estimates were made by multiplying the total precipitation in each grid cell by the relevant area-weighted land or ocean fraction determined from the 0.125° ERA-Interim land-sea mask.
3. Results
3.1. Northern hemisphere (NH)
3.1.1. CloudSat precipitation frequency and intensity
Figure 2 shows maps of annual and seasonal rain, mixed-phase, snow, and total precipitation frequencies calculated using four years of CloudSat observations in NH55. The first row displays the annual frequencies and the remaining rows are for precipitation frequencies for each of the four seasons: winter (DJF), spring (MAM), summer (JJA), and fall (OND). The map shows that snow is the most frequent land precipitation type in all seasons except summer, while rain and mixed-phase precipitation are more frequent over the southern part of the Atlantic Ocean, Gulf of Alaska, and nearby coastal areas where daily surface temperature typically remains above 0 °C. Boreal summer precipitation mainly occurs as rainfall except in Greenland, where, due to its high elevation, snowfall remains most frequent. However, rainfall and mixed-phase precipitation also occur over southern coastal regions of Greenland. Precipitation is most frequent over the Atlantic Ocean and Gulf of Alaska across all four seasons, occurring 10–30% of the time with a summer minimum and winter maximum across almost the entire region north of 55°N. As discussed in Behrangi et al. [2012], precipitation frequency is sensitive to spatial scale so the values in Figure 2 should be interpreted cautiously.
Figure 2.

Maps of annual and seasonal rain, mixed-phase, snow, and total precipitation frequencies calculated using four years of CloudSat observations poleward of 55°N. The first row displays the annual frequencies and the remaining rows are for precipitation frequencies for each of the four boreal seasons: winter (DJF), spring (MAM), summer (JJA), and fall (OND).
Figure 3 shows seasonal precipitation rates from CloudSat stratified by precipitation phase. Patterns in intensity are similar to those in occurrence frequency in Figure 2, except that rainfall events are consistently more intense than snow thus contributing more to the total precipitation. The intense seasonal precipitation over the Atlantic Ocean is mainly from rainfall and mixed phase precipitation, with the largest contribution during boreal fall and winter when the Atlantic storm tracks are most active.
Figure 3.

Maps of seasonal precipitation rates from CloudSat in NH for 2007–2010, stratified by precipitation phases. From left to right columns represent mean rainfall, mixed-phase, snowfall, and total precipitation and rows display the four boreal seasons. Seasons are winter (DJF), spring (MAM), summer (JJA), and fall (SON)
3.1.2. NH55 Annual precipitation intensity by region
Figure 4 shows maps of average precipitation rates (mm/day) over NH55 constructed from various products. GPCC is based on gauge observations so reports no ocean data. According to CloudSat (Fig 4a), the highest precipitation rates are in the North Atlantic up to the coast of Greenland and along southern coast of Alaska. This pattern is qualitatively consistent with the other land-ocean products except for CMAP. GPCC (Fig. 4g) agrees well with CloudSat over land (Fig. 4a), but has smaller precipitation rates over coastal Greenland and southern Alaska. Furthermore, GPCC has slightly higher precipitation rates than CloudSat over central Canada and Eurasia. As gauges are not utilized in the CloudSat precipitation estimate, its overall consistency with GPCC is remarkable. In northern Eurasia, GPCP (Fig 4b) shows a much higher mean precipitation rate. GPCP and GPCC apply different correction factors to account for gauge undercatch (e.g. induced by wind) which could contribute to the observed differences between the two products. In Section 3.1.5 we present analysis of winter-season precipitation including GRACE accumulation to support these adjustments. Over the Atlantic Ocean, GPCP does not show a strong north-south gradient in mean precipitation, while other products show a significant decrease in mean precipitation intensity poleward of approximately 70°N. GPCP displays higher precipitation intensity north of 70°N than the other products, and a lower intensity south of this band than all except for CMAP, which is a low outlier over all NH55 ocean regions. CMAP’s land precipitation (Fig. 4c) is more consistent with other products, but remains the lowest. Overall, the observation-based products agree more over land than over ocean, where surface observations are non-existent. The reanalyses show less disagreement over the spatial distribution of ocean precipitation than do the observations, and MERRA and ERA-Interim are particularly consistent. NCEP-DOE R2 reports higher intensity in the Atlantic, but reports less total ocean precipitation as this is offset by less precipitation in the Bay of Alaska, North Sea and off the coast of Greenland. MERRA and ERA-Interim broadly agree with CloudSat both spatially (e.g., by reproducing the strong precipitation gradient over the Atlantic ocean from north to south of 70°N) and in terms of total ocean precipitation.
Figure 4.

Maps of four-year averaged precipitation rates (mm/day) for 2007–2010 constructed from CloudSat, GPCP, CMAP, MERRA, ERA-Interim, NCEP, and GPCC over land and ocean north of latitude 55°. White areas represent missing or non-reported data.
Figure 5 shows the mean and standard deviation of precipitation estimates separately for reanalysis (MERRA, ERA-interim, NCEP-DOE R2; top row) and observation (GPCP, CMAP, CloudSat; middle row) products. The bottom row is similar to the middle row, but excludes CMAP. Average precipitation is similar between observations and reanalyses over ocean when CMAP is excluded, but observations have higher variance over oceans. The large standard deviation of the satellite-gauge products over ocean is consistent with findings of Adler et al. [2012]. Note that as CMAP is the notable outlier in total ocean precipitation estimates, its removal leads to a smaller standard deviation in the observational products.
Figure 5.

Maps of mean and standard deviation of precipitation estimates for 2007–2010, calculated separately for reanalysis (MERRA, ERA-Interim, NCEP) and observation (GPCP, CMAP, CloudSat) products in NH.
3.1.3. NH55 Seasonal precipitation by region
Figure 6 shows precipitation mean intensity maps of each product by season. All products report a strong seasonal cycle over both land and ocean. The Atlantic Ocean and the Gulf of Alaska receive much of their precipitation during winter and fall, while land receives more during summer. The outliers once again are CMAP, which shows suppressed amplitude of the annual cycle and NCEP-DOE R2, which shows much heavier summer precipitation over land than any other product.
Figure 6.

Maps of precipitation mean intensity for the studied products (shown in rows) across the four boreal seasons and poleward of 55°N. White areas represent missing or non-reported data. Seasons are winter (DJF), spring (MAM), summer (JJA), and fall (SON).
As summer precipitation tends to be rain and therefore less sensitive to gauge correction factors, the gauge products should be more reliable in densely instrumented regions. For example, Bolvin et al. [2009] compared GPCP with independent gauge measurements in Finland and found good agreement. This suggests that NCEP-DOE R2 may well be overestimating land precipitation, particularly during summer.
Despite the general agreement in their seasonal patterns, the products show marked differences in total amount. Over the Atlantic south of 70°N, CloudSat reports average precipitation during fall and winter greater than 5 mm/day in many cells, exceeding CMAP and GPCP, but similar to reanalyses. Furthermore, unlike other products, GPCP does not show any noticeable precipitation gradient around 70°N over the Atlantic Ocean in any season. In winter and fall, GPCP shows much higher total precipitation than the other products over Europe, north-west Asia, and over the Atlantic north of 70°N. The observed higher estimate by GPCP over Eurasia, compared to the other products, is in agreement with that found by Behrangi et al. [2014a] in which overestimation of GPCP was also noticed using the net surface water exchange rate estimated from remote-sensing observation and reanalysis. In the next section, this cold season discrepancy is investigated in more detail by including GRACE estimates of cold-season accumulation.
3.1.4. Implications of GRACE results for cold-season precipitation
Figure 7 compares winter estimates of snowfall from GRACE (Fig 7g) with the other products over grids experiencing mean 2m air temperature below −1°C across all days in winter. As described in Section 2.1, GRACE-based estimates of winter precipitation are calculated from Eq. 1 using corresponding evapotranspiration and runoff values from GLDAS. Note that it was found that the contributions of evapotranspiration and runoff to the total precipitation are on average about 10% and 0.4%, respectively. Figure 7 suggests that GRACE-based seasonal accumulation of snowfall is comparable to the other products, except GPCP which shows much higher total precipitation over parts of northern Eurasia. This again suggests that GPCP likely overestimates precipitation in this region, which could be related to overcorrection for gauge undercatch problem in high latitude and especially during winter [Swenson et al., 2010].
Figure 7.

Comparison of wintertime estimate of snowfall rate from GRACE (Fig 6g) with the other products. Only grids experiencing mean 2m air temperatures below −1°C across all days in boreal winter are considered for this comparison.
Figure 8 compares the mean accumulated winter snowfall estimated from different products, over North Asia (Fig. 8a) and North America (Fig. 8b) regions shown in Figure 7. The range of accumulated winter snowfall estimates is 46 mm to 64 mm (or 91 mm including GPCP) in North Asia and between 34 mm and 50 mm in North America. The average winter snowfall within the identified zones in North America and North Asia are 42.6±4.9(lσ) mm and 53.1±7.5 mm (or 58.1± 14.6 mm including GPCP), respectively. The GRACE estimate falls well within the estimated range of winter snowfall in both regions and is consistent with CloudSat, MERRA, and ERA-Interim estimates.
Figure 8.

Comparison between 2007–2010 mean accumulated boreal winter snowfall estimated by different products separately over (a) Northern Asia and (b) Northern America. The two regions are identical to those shown in Figure 6.
3.1.5. Comparison of total precipitation
Figure 9 provides a summary of the 2007–2010 average annual precipitation rate and spatial statistics calculated for each product over the entire NH55, NH55 oceans, NH55 land, and Greenland. Bar charts (top row) show mean precipitation within region by products and Taylor diagrams [Taylor, 2001] show the centered spatial correlation and standard deviation relative to GPCP.
Figure 9:

Precipitation statistics for each product by region. Top row: bar charts show mean precipitation (2007–2010) within region by product, organized as reanalyses (left 3 bars) and observations (right bars). The red solid bar shows the mean ±1 standard deviation of the reanalysis product means, the dashed black bar shows the mean ±1 standard deviation of the observational series GPCP, CMAP and CloudSat, and the solid black bar is the same excluding CMAP. Bottom row: Taylor diagrams of the same regions, product symbols shown in legend (far right) and the reference (black star) is the mean of the reanalyses plus the geographically complete observations GPCP and CloudSat. Regions are, from left to right: the entire NH (55–80°N), NH oceans (55–80°N), NH land (55–80°N), and Greenland.
These figures allow estimation of the range of precipitation estimated by observation and reanalysis and the identification of key disagreements. Over NH55 the all-product mean±standard deviation is 561±88 mm/yr with a range of 386—622 mm/yr. This large range is due to lower estimates from CMAP, particularly over the ocean. Excluding CMAP the products show substantially better agreement with mean±standard deviation of 596±23 mm/yr and a range of 572—622 mm/yr. Aside from CMAP, both the observation and reanalysis products are fairly consistent: the maximum difference between non-CMAP NH55 products is 8%, which means that observations and reanalyses combined place a relatively tight bound on total precipitation amount for assessment of climate models or for the precipitation component of the energy budget over NH55. However, this agreement between non-CMAP products over NH55 at annual scales hides disagreements in the spatial and temporal distribution. From the regional Taylor diagrams, it can be seen that CloudSat consistently reports larger spatial variability and in particular is an outlier over Greenland in terms of both total precipitation (591 mm/yr versus the 300–469 mm/yr range of other products) and its spatial distribution. CloudSat reports 311 mm/yr of snow and 280 mm/yr of rain and mixed phased precipitation over Greenland. While the CloudSat estimate of annual snowfall agrees with previous estimates of precipitation accumulation over Greenland ice sheet (~300 mm/yr) using ice core, snow pits, and in situ measurements [Bales et al., 2009; Chen et al., 2011], the intensity of rain and mixed-phase precipitation is likely overestimated. We think this might be related to misinterpretation of radar backscatter from the rugged topography, and thus the credibility of CloudSat rain retrievals over Greenland needs to be further investigated. In particular, future revisions to the 2c-rain product should include vertical continuity tests to prevent the misidentification of surface clutter as precipitation.
Nonetheless, we identify outliers in total precipitation as those whose precipitation estimate falls outside of 10 % of the range limits of the other products. From this we identify CMAP over oceans in all seasons except MAM, CloudSat over Greenland in all seasons except DJF, NCEP over NH55 land during JJA and GPCP over NH55 land during DJF. These results are consistent with our previous identification of outliers in Sections 3.2.1 through 3.1.4. The Taylor diagrams in Figure 9 provide quantification of the more qualitative statements made in Section 3.1.2 based on analysis of the maps.
3.2. Southern hemisphere (SH)
3.2.1. CloudSat Precipitation frequency and Intensity
Figure 10 shows maps of annual and seasonal rain, mixed-phase, snow, and total precipitation frequencies calculated using CloudSat observations collected between 2007 and 2010. The annual frequencies are shown in the first row, followed by precipitation frequencies for each of the four seasons: DJF, MAM, JJA, and SON.
Figure 10.

Maps of annual and seasonal rain, snow, and precipitation frequencies from CloudSat observations for 2007–2010. The first row displays the annual frequencies and the remaining rows are for precipitation frequencies for each of the four austral seasons: summer (DJF), fall (MAM), winter (JJA), and spring (OND).
Over the Antarctic continent, nearly all precipitation falls as snow and is most frequent near the coasts, where its frequency of occurrence can exceed 20% in parts of the Antarctic Peninsula and near some regions of the East Antarctic Ice Sheet. Away from the coasts frequency of snowfall occurrence can be as low as 5% over the Antarctic Plateau where elevation exceeds 2 km. The seasonal cycle of precipitation is weak over the continent and stronger over the ocean, with precipitation more frequent in austral summer than winter.
Over oceans the precipitation frequency is highest over the southern Pacific and Indian Oceans, where it can exceed 30% during austral fall and winter. In general, the seasonal variability of precipitation occurrence in SH55 (Fig. 10) is much lower than in NH55 (Fig. 2).
Figure 11 shows the seasonal distribution of rainfall, mixed-phase precipitation, snowfall, and total precipitation rate over SH55 as observed by CloudSat. The maps suggest that the intense precipitation region observed at 55°−60°S is mainly composed of rainfall and mixed-phased precipitation, except in austral winter, when snowfall contribution is the highest. Nearly all precipitation south of 70°S falls as snow during all seasons and over both ocean and land.
Figure 11.

Maps of seasonal precipitation rates from CloudSat for 2007–2010, stratified by precipitation phases. From left to right columns represent mean rainfall, mixed-phase, snowfall, and total precipitation and rows display the four austral seasons.
3.2.2. SH55 Annual precipitation intensity by region
Figure 12 shows maps of annual average precipitation rates (mm/day) over 2007–2010 from CloudSat, GPCP, CMAP, MERRA, ERA-interim, and NCEP-DOE R2 for SH55. No precipitation data from GPCC exists over the Antarctic continent due to the very sparse precipitation gauges. The overall pattern of mean annual precipitation is consistent among the studied products except for CMAP (Fig. 12c). The CloudSat precipitation map (Fig. 12a) shows higher agreement with MERRA (Fig. 12d) and ERA-Interim (Fig. 12e) and less agreement with GPCP.
Figure 12.
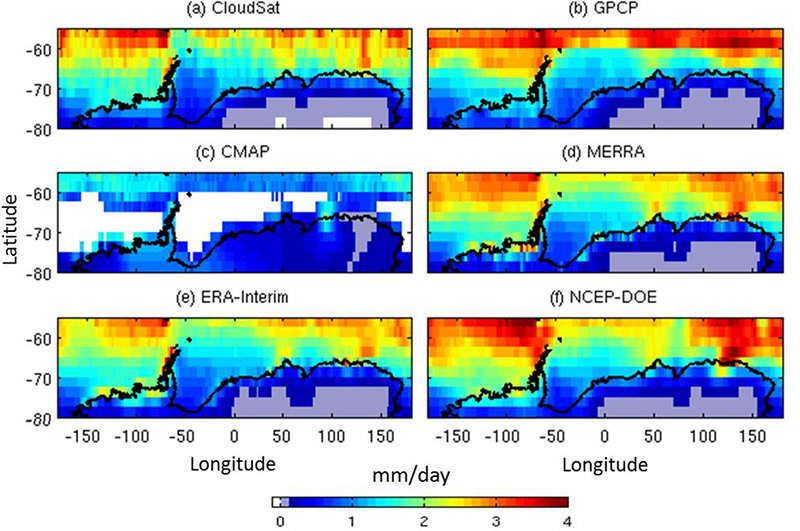
Maps of 2007–2010 averaged precipitation rates (mm/day) constructed from CloudSat, GPCC, GPCP, CMAP, MERRA, ERA-interim, NCEP, and GLDAS over land and ocean south of latitude 55°. White areas represent missing or non-reported data.
Unlike other products, GPCP (Fig. 12b) does not show significant longitudinal variation in precipitation intensity along the band between 55°−60°S and shows continuous annual precipitation intensity of greater than 3mm/day in this zone. This is consistent with previous findings indicating that GPCP overestimates zonally averaged precipitation rates around 60°S (Behrangi et al. 2014). Figure 12c shows that CMAP consistently underestimates precipitation rates and has wide areas of missing data over the ocean south of 60°S (shown in white).
NCEP-DOE R2 consistently reports higher precipitation intensity than MERRA or ERA-Interim, with a continuous band of heavier precipitation heading equatorward from the Antarctic Peninsula that is not seen in ERA-Interim, MERRA or CloudSat. NCEP-DOE R2 also reports more intense precipitation on the periphery of Wilkes Land, and penetrating more deeply into the continent from the Bellingshausen and Amundsen Seas than is seen in other products. CMAP reports rates of order 1 mm/day inland from the Ronne Ice Shelf to Queen Maud Land, and some larger precipitation rates at the edge of Kaiser Wilhelm II Land that are not seen in other products.
Figure 13 shows mean and standard deviation of precipitation estimates, calculated separately from reanalyses (MERRA, ERA-interim, NCEP-DOE R2; top row), and observations (GPCP, CMAP, CloudSat; middle row) over SH55. The bottom row is similar to the middle row, but excludes CMAP from calculations. Consistent with NH55 (Fig 5), reanalyses show higher agreement among themselves than with observations, especially over ocean. Removing CMAP suppresses the spread in observational estimates and leads to regional patterns that are more similar to reanalyses.
Figure 13.

Maps of mean and standard of precipitation estimates, calculated separately for reanalysis (MERRA, ERA-interim, NCEP; bottom row) and observation (GPCP, CMAP, CloudSat) products in SH for 2007–2010.
3.2.4. SH55 Seasonal precipitation intensity by region
Figure 14 shows seasonal distribution maps of precipitation mean intensity for the products for SH55. All of the products (except CMAP) suggest a seasonal variation that is not as strong as that observed for NH55 (Fig. 6). The products agree that the Southern Ocean receives much of its precipitation during austral fall and winter. Figure 14 shows that the GPCP’s continuous zonal band of intense precipitation around 60°S (observed in Fig. 12) is observed across all four seasons, but is more distinct in austral fall. In particular, there appears to be a discontinuity in GPCP’s reported precipitation intensities at 60°S that is most obvious in austral summer and fall.
Figure 14.

Maps of precipitation mean intensity for the studied products (shown in rows) across the four austral seasons in SH for 2007–2010. White areas represent missing or non-reported data.
Over West Antarctica and the Antarctic Peninsula, ERA-Interim is most similar to GPCP and CloudSat throughout the year while MERRA reports more intense local precipitation from austral fall through spring. NCEP-DOE R2 consistently shows more widespread snow and continues to report widespread snow during austral summer over the West Antarctic coast up to where it meets the Ross Ice Shelf, where other products report little or none.
3.2.5. Comparison of total precipitation
Figure 15 is similar to Fig. 9, but is over SH55, SH55 ocean, and SH55 land (Antarctica). Once again, CMAP is a notable low outlier at 303 mm/yr that is mainly related to underestimation over ocean. Excluding CMAP the products show mean±standard deviation of 667±46 mm/yr and a range of 611—732 mm/yr. Based on CloudSat data, precipitation totals are split by phase as follows: snow 50.1%, rain 13.7% and mixed-phase 36.1%. CloudSat is not an outlier over Antarctica as it is over Greenland, perhaps because the challenges with retrieval of rainfall are not relevant in Antarctica (see Figure 10).
Figure 15.

Similar to Fig. 9 but for Southern Hemisphere 55–80° (SH55). Regions are, from left to right: the entire SH (55–80°S), SH oceans (55–80°S), and SH land (55– 80°S)(Antarctica). GPCC has no data over Antarctica and is not shown.
Over Antarctica, CloudSat reports 178 mm/yr of snowfall, accounting for approximately 97.5% of total precipitation. We consider this to be consistent with the 171 mm/yr by Palerme et al. (2014). The remaining 4 % difference may be explained by different time periods (2007—2010 here versus August 2006 to April 2011 in Palerme et al. [2014]), regional coverage (north of 80 °S here, north of 82 °S in Palerme et al. [2014]) and potentially choice of land-sea mask. This result is also similar to the ~ 170mm/yr estimate by Vaughan et al. [1999] who interpolated between a compilation of in situ surface accumulation measurements throughout Antarctica.
Among the reanalyses, ERA-Interim is closest to the observations with 193 mm/yr of total precipitation, while MERRA and NCEP-DOE R2 report 23–37 % more snowfall. It has been reported that ERA-Interim does not show temporal discontinuities over Antarctica and likely presents the most realistic depiction of changes in Antarctic precipitation over 1989–2009 [Bromwich et al., 2011]. ERA-Interim is also in stronger agreement with CloudSat estimates in terms of both total precipitation and their spatial statistics shown in the Taylor diagram.
Figure 15 implies that CMAP is a consistent outlier over both land and ocean, both in terms of absolute precipitation and spatial distribution. Meanwhile, over oceans GPCP displays larger spatial variability than other products, in terms of the centered standard deviation, which is consistent with the latitudinal discontinuity (see Fig. 12). The clustering of the reanalyses and CloudSat on the Taylor diagram for SH55 ocean suggests better agreement between these products in the spatial distribution of precipitation. Unlike in NH55 where we were able to find evidence suggestive of reasons for outliers (GPCP gauge correction and CloudSat 2c-rain topography issues), we are not able to identify clear reasons for the magnitude of this spread. As such, it appears that our best estimates from observation and reanalysis of SH55 precipitation span a larger range than over NH55, with a maximum difference depending on product choice of 18 %, versus 8 % in NH55.
4. Concluding Remarks
Precipitation estimates from ground observation (GPCC), remote sensing (GPCP, CMAP, CloudSat, and GRACE), and reanalyses (MERRA, ERA-Interim, and NCEP-DOE R2) are compared in terms of total annual and seasonal precipitation in high-latitude regions between 55°−80° latitude. Additionally, CloudSat precipitation products are used to characterize the frequency of precipitation occurrence and precipitation phase. The period 2007–2010 was selected as this is when CloudSat provides a complete observation record. CMAP, GPCP and GPCC utilize gauges over land, CloudSat is very sensitive to light rain and snowfall, and GRACE enables a fully independent estimation (i.e. gravimetry versus radiometry) of accumulated cold-season precipitation.
Overall, a fairly good agreement between CloudSat and GPCP is found in total annual precipitation across the domains studied, with differences of <10% absolute over NH55-land-ocean, NH55-ocean, SH55 and SH55-ocean while results are almost identical over Antarctica. However, these totals mask regional and seasonal differences. For example, CloudSat reports much heavier total precipitation over Greenland, which is attributed to surface radar returns over rugged topography being misinterpreted as intense rain. GPCP reports much heavier winter precipitation over northern Eurasia, which is attributed to a likely issue with gauge correction factors. GPCP also differs from other products over the Atlantic Ocean where it does not show a distinct latitudinal gradient in precipitation on either side of 70°N, and over the Southern Ocean where there is a notable discrepancy in precipitation rates at 60°S. CMAP is a clear outlier over the oceans, with total precipitation 50% lower than the mean of the other products in NH55 and 30% lower in SH55. Over land it also provides the lowest estimate but is less extreme as an outlier, likely due to its use of ground gauges for bias correction.
Among the reanalyses, over NH55 MERRA and ERA-Interim are generally consistent with each other on large spatial scales while NCEP-DOE R2 reports about 20% more precipitation over land. The most obvious contributor to this higher estimate is high accumulation during summer. As this is the warm season when land precipitation is predominantly rain, undercatch uncertainties are smaller, so products utilizing gauge networks (e.g., GPCP) are more likely to be reliable. MERRA and ERA-Interim are more consistent with the gauge estimates, suggesting that NCEP-DOE likely overestimates land precipitation in NH55, particularly during boreal summer. In SH55, reanalyses are approximately evenly spread over the range 611—732 mm/yr, with ERA-Interim the lowest and NCEP-DOE R2 the highest. NCEP-DOE R2 is the furthest from CloudSat over the ocean (13% higher) and especially over Antarctica (44% higher), whereas ERA-Interim most closely matches the CloudSat and GPCP observed totals. Considerable seasonal variation is seen in SH55 precipitation maps, but this is weaker than in NH55. All products agree that SH55-ocean receives much of its precipitation during austral fall and winter. Antarctica has a weak seasonal cycle with a minimum in winter. CloudSat reports that precipitation south of 70°S is almost purely from snowfall across all seasons over both ocean and land. In general, the CloudSat and re-analysis (MERRA and ERA-Interim) results agree well with each other, both in terms of absolute magnitude and pattern in most areas and this cross-confirmation increases our confidence in their use. The merit of reanalysis to produce precipitation fields in middle to high latitudes (e.g., Adler et al. [2001]) is likely due to large-scale dynamics and moisture convergence playing a dominant role in precipitation processes and the success at assimilating conventional and satellite temperature and moisture soundings.
We find that some regional discrepancies remain between precipitation products, which suggest locations where they should be used cautiously. For rain over the oceans and snow over all surfaces, for which the 2c-rain and 2c-snow algorithms were designed, GPCP, MERRA and ERA-Interim tend to be consistent with CloudSat totals although the GPCP spatial distribution of rainfall over the ocean is not in good agreement. Over NH55 land where gauge data is used, MERRA and ERA-Interim also agree better with the gauge-based products than does NCEP-DOE R2. Over Antarctica, ERA-Interim is in best agreement with both GPCP and CloudSat.
Issues of concern raised by this intercomparison are that NCEP-DOE R2 reports much higher summer precipitation over land in NH55 than all other products, that GPCP reports excess snowfall over northern Eurasia, and that CMAP consistently reports much less precipitation over oceans. The quality of CloudSat rain estimation over Greenland also remains a subject for further investigation.
Although precipitation estimation at higher latitudes is a major challenge that has not been fully addressed by the Earth observing community, we show in this paper that some progress has been achieved. This is indicated by the level of agreement between products derived from independent data sources. The present comparative analysis provides useful insights for diagnostic assessment of precipitation products in high latitudes, quantifying uncertainties among observations and reanalyses, and establishing a benchmark for assessment of climate models. The recently launched Global Precipitation Measurement (GPM) mission [Hou et al., 2014] deploys a Ka/Ku band dual frequency precipitation radar (DPR) and a multichannel passive microwave imager (GMI) on its Core Observatory, covering 65°S-N. The higher sensitivity of GPM core instruments to light rain and snowfall, extended coverage (compared to 35°S-N for TRMM), and improvements in precipitation retrieval methods provide unprecedented opportunities to take on the challenges of quantifying light rain and falling snow. The W-band radar on CloudSat has snow detection thresholds more than an order of magnitude lower than the GPM radars [Skofronick-Jackson et al., 2013], suggesting that CloudSat is highly complementary to the existing suite of spaceborne sensors, especially over high latitudes where light precipitation is dominant. The occurrence of a battery anomaly in April 2011 significantly reduced CloudSat’s battery capacity. The issue was mitigated by reconfiguring the spacecraft’s operations to what is referred to as the Daylight-Only Operations (DO-Op) mode in which CloudSat makes radar measurements for ~56% of each orbit, while the sensitivity of the radar remains essentially unchanged. Successful operation of the DO-Op mode since 2011 suggests a mission life with reasonable likelihood of operations through 2019 (CloudSat Senior review 2015). Further near-future W-band observations are expected with the future launch and operation of the Earth, Clouds, Aerosols and Radiation Explorer (EarthCARE) mission [Illingworth et al., 2015].
It is also hoped that comparative analysis over short periods at high latitudes using CloudSat such as in this study and soon GPM will enable adjustments or corrections to the remote sensing and analysis techniques utilized to produce long-term global analyses such as GPCP. Thus these recent observations will help enable a more accurate and consistent picture of the long-term precipitation climatology and inter-annual and inter-decadal variations back through the satellite era.
Key points:
ERA-Interim and MERRA agree closely with CloudSat precipitation over high-latitude oceans.
Over Antarctica total snowfall from GPCP and CloudSat is almost identical: about 178 mm/yr.
GPCP likely overestimates snowfall over Eurasia.
Acknowledgments.
Datasets were obtained from various sources: The latest version of monthly GPCP (V2.2) from Goddard Earth Sciences Data and Information Services Center (GES DISC), CMAP from NOAA Earth System Laboratory http://www.esrl.noaa.gov/psd/data/gridded/data.cmap.html, GPCC Full Data Reanalysis Version 7.0 at 2.5°×2.5° resolution from ftp://ftp.dwd.de/pub/data/gpcc/html/download_gate.html, GRACE total water storage from http://gracetellus.jpl.nasa.gov/, Era-Interim daily precipitation from http://apps.ecmwf.int/datasets/, MERRA precipitation (V 5.2) from GES DISC, NCEP precipitation from NOAA-ESRL at http://www.esrl.noaa.gov/psd/, and all CloudSat products from http://www.cloudsat.cira.colostate.edu. Some of the datasets used in this manuscript is also available through the Arctic Observation and Reanalysis Integrated System (Christensen et al. 2016). Evapotranspiration and runoff are obtained from GLDAS Noah Land Surface Model L4 monthly 0.25 × 0.25 degree Version 2.0 (GLDAS_NOAH025_M) product available from GES DISC. We thank Norm Wood and Tristan L’Ecuyer at University of Wisconsin-Madison for the discussion about the CloudSat snow product. The research described in this paper was carried out at the Jet Propulsion Laboratory, California Institute of Technology, under a contract with the National Aeronautics and Space Administration. Financial support is also made available from NASA New Investigator Program (NNH13ZDA001N-NIP) and NASA Energy and Water Cycle Study (NNH13ZDA001N-NEWS) awards. Government sponsorship is acknowledged.
Contributor Information
Ali Behrangi, Jet Propulsion Laboratory, California Institute of Technology, Pasadena, California, USA.
Matthew Christensen, Science and Technology Facilities Council, Rutherford Appleton Laboratory, Didcot, UK Atmospheric, Oceanic and Planetary Physics, University of Oxford, Oxford, UK.
Mark Richardson, Jet Propulsion Laboratory, California Institute of Technology, Pasadena, California, USA.
Matthew Lebsock, Jet Propulsion Laboratory, California Institute of Technology, Pasadena, California, USA.
Graeme Stephens, Jet Propulsion Laboratory, California Institute of Technology, Pasadena, California, USA.
George J. Huffman, NASA Goddard Space Flight Center, Greenbelt, Maryland, USA
David Bolvin, NASA Goddard Space Flight Center, Greenbelt, Maryland, USA.
Robert F. Adler, Earth System Science Interdisciplinary Center, University of Maryland, College Park, Maryland, USA
Alex Gardner, Jet Propulsion Laboratory, California Institute of Technology, Pasadena, California, USA.
Bjorn Lambrigtsen, Jet Propulsion Laboratory, California Institute of Technology, Pasadena, California, USA.
Eric Fetzer, Jet Propulsion Laboratory, California Institute of Technology, Pasadena, California, USA.
References:
- Adler RF, Kidd C, Petty G, Morissey M, and Goodman HM (2001), Intercomparison of global precipitation products: The third Precipitation Intercomparison Project (PIP-3), Bulletin of the American Meteorological Society, 82(7), 1377–1396. [Google Scholar]
- Adler RF, Gu G, and Huffman GJ (2012), Estimating Climatological Bias Errors for the Global Precipitation Climatology Project (GPCP), Journal of Applied Meteorology and Climatology, 51(1), 84–99. [Google Scholar]
- Adler RF, Huffman GJ, Chang A, Ferraro R, Xie PP, Janowiak J, Rudolf B, Schneider U, Curtis S, Bolvin D, Gruber A, Susskind J, Arkin P, and Nelkin E (2003), The version-2 global precipitation climatology project (GPCP) monthly precipitation analysis (1979-present), Journal of Hydrometeorology, 4(6), 1147–1167. [Google Scholar]
- Alley R, et al. (2007), Summary for policymakers, in Climate Change, The Physical Science Basis, Contribution of W.G. I to the Forth Assessment Report of the IPCC, edited by Solomon S et al. , pp. 1–18, Cambridge Univ. Press, Cambridge, U. K. [Google Scholar]
- Andrews T, Forster PM, and Gregory JM (2009), A Surface Energy Perspective on Climate Change, Journal of Climate, 22(10), 2557–2570. [Google Scholar]
- Bales RC, Guo Q, Shen D, McConnell JR, Du G, Burkhart JF, Spikes VB, Hanna E, and Cappelen JCD (2009), Annual accumulation for Greenland updated using ice core data developed during 2000–2006 and analysis of daily coastal meteorological data, Journal of Geophysical Research: Atmospheres, 114(D6). [Google Scholar]
- Becker A, Finger P, Meyer-Christoffer A, Rudolf B, Schamm K, Schneider U, and Ziese M (2013), A description of the global land-surface precipitation data products of the Global Precipitation Climatology Centre with sample applications including centennial (trend) analysis from 1901-present, Earth Syst. Sci. Data, 5(1), 71–99. [Google Scholar]
- Behrangi A, Stephens G, Adler RF, Huffman GJ, Lambrigtsen B, and Lebsock M (2014a), An Update on the Oceanic Precipitation Rate and Its Zonal Distribution in Light of Advanced Observations from Space, Journal of Climate, 27(11), 3957–3965. [Google Scholar]
- Behrangi A, Tian Y, Lambrigtsen BH, and Stephens GL (2014b), What does CloudSat reveal about global land precipitation detection by other spaceborne sensors?, Water Resources Research, 50, 4893–4905. [Google Scholar]
- Behrangi A, Lebsock M, Wong S, and Lambrigtsen B (2012), On the quantification of oceanic rainfall using spaceborne sensors, J. Geophys. Res, 117(D20), D20105. [Google Scholar]
- Bolvin DT, Adler RF, Huffman GJ, Nelkin EJ, and Poutiainen JP (2009), Comparison of GPCP Monthly and Daily Precipitation Estimates with High-Latitude Gauge Observations, Journal of Applied Meteorology and Climatology, 48(9), 1843–1857. [Google Scholar]
- Bosilovich MG, Robertson FR, and Chen J (2011), Global Energy and Water Budgets in MERRA, Journal of Climate, 24(22), 5721–5739. [Google Scholar]
- Bromwich DH, Nicolas JP, and Monaghan AJ (2011), An Assessment of Precipitation Changes over Antarctica and the Southern Ocean since 1989 in Contemporary Global Reanalyses*, Journal of Climate, 24(16), 4189–4209. [Google Scholar]
- Chen L, Johannessen O, Wang H, and Ohmura A (2011), Accumulation over the Greenland Ice Sheet as represented in reanalysis data, Advances in Atmospheric Sciences, 28(5), 1030–1038. [Google Scholar]
- Christensen MW, Behrangi A, L’Ecuyer T, Wood NB, Lebsock MD, and Stephens GL (2016), Arctic Observation and Reanalysis Integrated System: A New Data Product for Validation and Climate Study, Bulletin of the American Meteorological Society, doi: http://dx.doi.Org/10.1175/BAMS-D-14-00273.1 [Google Scholar]
- Dee DP, Uppala SM, Simmons AJ, Berrisford P, Poli P, Kobayashi S, Andrae U, et al. (2011), The ERA-Interim reanalysis: configuration and performance of the data assimilation system, Q.J. R. Meteorol. Soc, 137(656), 553–597. [Google Scholar]
- Dingman SL, 2008: Physical Hydrology, 2nd ed., Waveland Press, Long Grove, IL, 646pp. [Google Scholar]
- Dyurgerov ΜB, and Carter CL (2004), Observational Evidence of Increases in Freshwater Inflow to the Arctic Ocean, Arctic, Antarctic, and Alpine Research, 36(1), 117–122. [Google Scholar]
- Fuchs T, Rapp J, Rubel F, and Rudolf B (2001), Correction of synoptic precipitation observations due to systematic measuring errors with special regard to precipitation phases, Physics and Chemistry of the Earth, Part B: Hydrology, Oceans and Atmosphere, 26(9), 689–693. [Google Scholar]
- Goodison BE, Louie PYT, and Yang D, 1998: WMO solid precipitation measurement intercomparison, Rept. 67, 212 pp., World Meteorological Organization, Geneva. [Google Scholar]
- Haynes JM, L’Ecuyer TS, Stephens GL, Miller SD, Mitrescu C, Wood NB, and Tanelli S (2009), Rainfall retrieval over the ocean with spaceborne W-band radar, Journal of Geophysical Research: Atmospheres, 114(D8), D00A22. [Google Scholar]
- Hou AY, Kakar RK, Neeck S, Azarbarzin AA, Kummerow CD, Kojima M, Oki R, Nakamura K, and Iguchi T (2014), The Global Precipitation Measurement Mission, Bulletin of the American Meteorological Society, 95(5), 701–722. [Google Scholar]
- Huffman GJ, and Bolvin DT (2012), GPCP version 2.2 SG combined precipitation data set documentation. 46 pp. [Available online at ftp://precip.gsfc.nasa.gov/pub/gpcp- v2.2/ doc/V2.2_doc.pdf.]
- Huffman GJ, Adler RF, Bolvin DT, and Gu G (2009), Improving the global precipitation record: GPCP Version 2.1, Geophys. Res. Lett, 36(17), L17808. [Google Scholar]
- Illingworth AJ, Barker HW, Beljaars A, Ceccaldi M, Chepfer H, Clerbaux N, Cole J, et al. (2015), The EarthCARE Satellite: The Next Step Forward in Global Measurements of Clouds, Aerosols, Precipitation, and Radiation, Bulletin of the American Meteorological Society, 96(8), 1311–1332. [Google Scholar]
- Kanamitsu M, Ebisuzaki W, Woollen J, Yang S-K, Hnilo JJ, Fiorino M, and Potter GL (2002), NCEP-DOE AMIP-II Reanalysis (R-2), Bulletin of the American Meteorological Society, 83(11), 1631–1643. [Google Scholar]
- Lammers RB, Shiklomanov AI, Vörösmarty CJ, Fekete BM, and Peterson BJ (2001), Assessment of contemporary Arctic river runoff based on observational discharge records, Journal of Geophys. Research: Atmospheres, 106(D4), 3321–3334. [Google Scholar]
- Landerer FW, and Swenson SC (2012), Accuracy of scaled GRACE terrestrial water storage estimates, Water Resources Research, 48(4), W04531. [Google Scholar]
- Landerer FW, Dickey JO, and Güntner A (2010), Terrestrial water budget of the Eurasian pan-Arctic from GRACE satellite measurements during 2003–2009.Journal of Geophysical Research: Atmospheres, 115(D23), D23115. [Google Scholar]
- Lau WKM, Wu HT, and Kim KM (2013), A canonical response of precipitation characteristics to global warming from CMIP5 models, Geophys. Res. Lett, 40(12), 3163–3169. [Google Scholar]
- Lebsock MD, and L’Ecuyer TS (2011), The retrieval of warm rain from CloudSat, J. Geophys. Res, 116(D20), D20209. [Google Scholar]
- L’Ecuyer TS, Beaudoing HK, Rodell M, Olson W, Lin B, Kato S, Clayson CA, Wood E, et al. (2015), The Observed State of the Energy Budget in the Early 21st Century, Journal of Climate. [Google Scholar]
- Matrosov SY (2014), Intercomparisons of CloudSat and Ground-Based Radar Retrievals of Rain Rate over Land, Journal of Applied Meteorology and Climatology, 53(10), 2360–2370. [Google Scholar]
- McClelland JW, Déry SJ, Peterson BJ, Holmes RM, and Wood EF (2006), A panarctic evaluation of changes in river discharge during the latter half of the 20th century, Geophys. Res. Lett, 33(6), L06715. [Google Scholar]
- Mitrescu C, L’Ecuyer T, Haynes J, Miller S, and Turk J (2010), CloudSat Precipitation Profiling Algorithm-Model Description, Journal of Applied Meteorology and Climatology, 49(5), 991–1003. [Google Scholar]
- Niu G-Y, Seo K-W, Yang Z-L, Wilson C, Su H, Chen J, and Rodell M (2007), Retrieving snow mass from GRACE terrestrial water storage change with a land surface model, Geophys. Res. Lett, 34(15), L15704. [Google Scholar]
- Palerme C, Kay JE, Genthon C, L’Ecuyer T, Wood NB, and Claud C (2014), How much snow falls on the Antarctic ice sheet?, The Cryosphere Discuss, 8(1), 1279–1304. [Google Scholar]
- Rienecker ΜΜ, Suarez ΜJ, Gelaro R, Todling R, Bacmeister J, Liu E, Bosilovich MG, S.D. et al. (2011), MERRA: NASA’s Modern-Era Retrospective Analysis for Research and Applications, Journal of Climate, 24(14), 3624–3648. [Google Scholar]
- Rignot E, Mouginot J, and Scheuchl B (2011), Ice Flow of the Antarctic Ice Sheet, Science, 333(6048), 1427–1430. [DOI] [PubMed] [Google Scholar]
- Rodell M, Beaudoing HK, L’Ecuyer TS, Olson WS, Famiglietti JS, Houser PR, Adler R, Bosilovich MG, et al. (2015), The Observed State of the Water Cycle in the Early Twenty-First Century, Journal of Climate, 28(21), 8289–8318. [Google Scholar]
- Rodell M, Houser PR, Jambor U, Gottschalck J, Mitchell K, Meng CJ, Arsenault K, Cosgrove B, Radakovich J, Bosilovich M, Entin JK*, Walker JP, Lohmann D, and Toll D (2004), The Global Land Data Assimilation System, Bulletin of the American Meteorological Society, 85(3), 381–394. [Google Scholar]
- Sakumura C, Bettadpur S, and Bruinsma S (2014), Ensemble prediction and intercomparison analysis of GRACE time-variable gravity field models, Geophys. Res. Lett, 41(5), 1389–1397. [Google Scholar]
- Udo Schneider; Andreas Becker; Peter Finger; Anja Meyer-Christoffer; Bruno Rudolf; Markus Ziese (2015), GPCC Full Data Reanalysis Version 7.0 at 2.5°: Monthly Land-Surface Precipitation from Rain-Gauges built on GTS-based and Historic Data, doi: 10.5676/DWD_GPCC/FD_M_V7_250 [DOI] [Google Scholar]
- Schneider U, Becker A, Finger P, Meyer-Christoffer A, Ziese M, and Rudolf B (2014), GPCC’s new land surface precipitation climatology based on quality-controlled in situ data and its role in quantifying the global water cycle, Theoretical and Applied Climatology, 115(1–2), 15–40. [Google Scholar]
- Serreze M, and Francis J (2006), The Arctic Amplification Debate, Climatic Change, 76(3–4), 241–264. [Google Scholar]
- Simmons AJ, Poli P, Dee DP, Berrisford P, Hersbach H, Kobayashi S, and Peubey C (2014), Estimating low-frequency variability and trends in atmospheric temperature using ERA-Interim, Q.J. R Meteorol Soc ., 140(679), 329–353. [Google Scholar]
- Skofronick-Jackson GM, Johnson BT, and Munchak SJ (2013), Detection Thresholds of Falling Snow From Satellite-Borne Active and Passive Sensors, Geoscience and Remote Sensing, IEEE Transactions on, 51(7), 4177–4189. [Google Scholar]
- Smith LC, Sheng Y, MacDonald GM, and Hinzman LD (2005), Disappearing Arctic Lakes, Science, 308(5727), 1429. [DOI] [PubMed] [Google Scholar]
- Solomon S, et al. (2007), Technical summary, in Climate Change 2007: The Physical Science Basis. Contribution of Working Group I to the Fourth Assessment Report of the Intergovernmental Panel on Climate Change, edited by Solomon S et al. , pp. 20– 91, Cambridge Univ. Press, Cambridge, U. K. [Google Scholar]
- Stephens GL, Li JL, Wild M, Clayson CA, Loeb N, Kato S, L’Ecuyer T, Stackhouse PW, Lebsock M, and Andrews T (2012), An update on Earth’s energy balance in light of the latest global observations, Nat. Geosci, 5(10), 691–696. [Google Scholar]
- Stephens GL, L’Ecuyer T, Forbes R, Gettlemen A, Golaz J-C, Bodas-Salcedo A, Suzuki K, Gabriel P, and Haynes J (2010), Dreary state of precipitation in global models, J. Geophys. Res, 115(D24), D24211. [Google Scholar]
- Stephens GL, and Ellis TD (2008), Controls of Global-Mean Precipitation Increases in Global Warming GCM Experiments, Journal of Climate, 21 (23), 6141–6155. [Google Scholar]
- Susskind J, Piraino P, Rokke L, Iredell L, and Mehta A (1997), Characteristics of the TOVS Pathfinder Path A Dataset, Bulletin of the American Meteorological Society, 78(7), 1449–1472. [Google Scholar]
- Swenson S (2010), Assessing High-Latitude Winter Precipitation from Global Precipitation Analyses Using GRACE, Journal of Hydrometeorology, 11(2), 405–420. [Google Scholar]
- Swenson S, and Wahr J (2007), Multi-sensor analysis of water storage variations of the Caspian Sea, Geophys. Res. Lett, 34(16), L16401. [Google Scholar]
- Swenson S, Yeh PJF, Wahr J, and Famiglietti J (2006), A comparison of terrestrial water storage variations from GRACE with in situ measurements from Illinois, Geophys. Res. Lett, 33(16), L16401. [Google Scholar]
- Tapley BD, Bettadpur S, Ries JC, Thompson PF, and Watkins MM (2004), GRACE Measurements of Mass Variability in the Earth System, Science, 305(5683), 503–505. [DOI] [PubMed] [Google Scholar]
- Taylor KE (2001), Summarizing multiple aspects of model performance in a single diagram, Journal of Geophysical Research: Atmospheres, 106(D7), 7183–7192. [Google Scholar]
- Trenberth KE, Smith L, Qian TT, Dai A, and Fasullo J (2007), Estimates of the global water budget and its annual cycle using observational and model data, Journal of Hydrometeorology, 8(4), 758–769. [Google Scholar]
- Trenberth KE, Dai A, Rasmussen RM, and Parsons DB (2003), The Changing Character of Precipitation, Bulletin of the American Meteorological Society, 84(9), 1205–1217. [Google Scholar]
- Vaughan DG, Bamber JL, Giovinetto M, Russell J, and Cooper APR (1999), Reassessment of Net Surface Mass Balance in Antarctica, Journal of Climate, 12(4), 933–946. [Google Scholar]
- Wilheit T, Kummerow CD, and Ferraro R (2003), NASDARainfall algorithms for AMSR-E, IEEE Trans. Geosci. Remote Sens, 41(2), 204–214. [Google Scholar]
- Wood NB, L’Ecuyer TS, Heymsfield AJ, Stephens GL, Hudak DR, and Rodriguez P (2014), Estimating snow microphysical properties using collocated multisensor observations, Journal of Geophysical Research: Atmospheres, 119(14), 8941–8961. [Google Scholar]
- Wood NB, L’Ecuyer TS, Bliven FL, and Stephens GL (2013), Characterization of video disdrometer uncertainties and impacts on estimates of snowfall rate and radar reflectivity, Atmos. Meas. Tech, 6(12), 3635–3648. [Google Scholar]
- Xie P and Arkin PA, 1997: Global Precipitation: A 17-Year Monthly Analysis Based on Gauge Observations, Satellite Estimates, and Numerical Model Outputs. Bulletin of the American Meteorological Society, 78, 2539–2558. [Google Scholar]
- Yang D, Kane DL, Hinzman LD, Zhang X, Zhang T, and Ye H (2002), Siberian Lena River hydrologic regime and recent change, Journal of Geophysical Research: Atmospheres, 107(D23), 4694. [Google Scholar]
- Yang D, Kane D, Zhang Z, Legates D, and Goodison B (2005), Bias corrections of longterm (1973–2004) daily precipitation data over the northern regions, Geophys. Res. Lett, 32(19), L19501. [Google Scholar]
- Ye H, Fetzer EJ, Wong S, Behrangi A, Olsen ET, Cohen J, Lambrigtsen BH, and Chen L (2014), Impact of increased water vapor on precipitation efficiency over northern Eurasia, Geophys. Res. Lett, 41(8), 2014GL059830. [Google Scholar]