

Abstract
A noninvasive method to estimate muscle mass based on creatine (methyl-d3) (D3-creatine) dilution using fasting morning urine was evaluated for accuracy and variability over a 3- to 4-mo period. Healthy older (67- to 80-yr-old) subjects (n = 14) with muscle wasting secondary to aging and four patients with chronic disease (58–76 yr old) fasted overnight and then received an oral 30-mg dose of D3-creatine at 8 AM (day 1). Urine was collected during 4 h of continued fasting and then at consecutive 4- to 8-h intervals through day 5. Assessment was repeated 3–4 mo later in 13 healthy subjects and 1 patient with congestive heart failure. Deuterated and unlabeled creatine and creatinine were measured using liquid chromatography–tandem mass spectrometry. Total body creatine pool size and muscle mass were calculated from D3-creatinine enrichment in urine. Muscle mass was also measured by whole body MRI and 24-h urine creatinine, and lean body mass (LBM) was measured by dual-energy X-ray absorptiometry (DXA). D3-creatinine urinary enrichment from day 5 provided muscle mass estimates that correlated with MRI for all subjects (r = 0.88, P < 0.0001), with less bias [difference from MRI = −3.00 ± 2.75 (SD) kg] than total LBM assessment by DXA, which overestimated muscle mass vs. MRI (+22.5 ± 3.7 kg). However, intraindividual variability was high with the D3-creatine dilution method, with intrasubject SD for estimated muscle mass of 2.5 kg vs. MRI (0.5 kg) and DXA (0.8 kg). This study supports further clinical validation of the D3-creatine method for estimating muscle mass.
NEW & NOTEWORTHY Measurement of creatine (methyl-d3) (D3-creatine) and D3-creatinine excretion in fasted morning urine samples may be a simple, less costly alternative to MRI or dual-energy X-ray absorptiometry (DXA) to calculate total body muscle mass. The D3-creatine enrichment method provides estimates of muscle mass that correlate well with MRI, and with less bias than DXA. However, intraindividual variability is high with the D3-creatine method. Studies to refine the spot urine sample method for estimation of muscle mass may be warranted.
Keywords: creatine, creatinine, muscle mass, dual-energy X-ray absorptiometry, lean mass
the estimation of muscle mass is increasingly recognized as an important parameter for clinical assessments of the degree of muscle wasting (4, 7, 10). Muscle wasting occurs as a component of frailty in aging and in chronic illnesses such as cancer, chronic obstructive pulmonary disease (COPD), renal insufficiency, and congestive heart failure (CHF). Several European-based pharmaceutical companies are collaborating with an academic consortium to conduct a large multicenter study on the prevalence and consequences of muscle wasting and frailty in older individuals under the Innovative Medicines Initiative (19).
Current methods to estimate muscle mass in clinical populations are limited by accessibility and cost. These methods include computed tomography (CT), magnetic resonance imaging (MRI), dual-energy X-ray absorptiometry (DXA), deuterated water (D2O), and bioelectric impedance (BIA) (2, 24). These methods are expensive (MRI, CT, and DXA), have limited accuracy (BIA and D2O), and may be difficult to perform in a clinical trial with a large sample size (CT, MRI, and DXA). On the basis of serial cross sections, MRI can provide a very good measure of total muscle mass, but it is very expensive, the analysis is time-consuming, and its use is limited to smaller studies. Moreover, CT scans are expensive, have limited accessibility, and are associated with significant radiation exposure. While DXA has a much lower cost and is more accessible, total lean mass measured by DXA is affected by body water and includes the soft tissue organs such as liver, lungs, and intestinal tract, leading to a significant overestimate of actual muscle mass. Biochemical methods include the classic measurement of 24-h urinary creatinine excretion (24-h UCrn), which has been shown to correlate well with muscle mass (17). This method can be subject to variability, as it is dependent on accurate collection of urine and a stable diet, especially for protein intake, and uses a formula based on muscle mass (17–22 kg) per gram of urinary creatinine.
We previously reported on the use of a creatine (methyl-d3) (D3-creatine) dilution method to estimate muscle mass in a rat model and in humans (9, 29). Unique aspects of creatine and creatinine biology provide the basis for this method (1). Because the body reserve of creatine is located almost exclusively in muscle (95%), it comprises a key component of muscle energetics. Creatine, in the phosphocreatine form, is critical for regeneration of ATP from ADP via the phosphocreatine pathway, as well as for slow (endurance) and fast (acute high-level activity) muscle fiber energy needs (1, 15, 27, 32). The primary sources for creatine are synthesis in the liver and kidney and diet. Circulating creatine is transported against a concentration gradient into muscle. In muscle, ~2% of creatine per day is converted to creatinine by an irreversible nonenzymatic reaction. The daily excretion rate of creatinine has been used as a metric of whole body creatine pool size.
Based on rodent studies, which demonstrated precision and repeatability of the D3-creatine dilution method in the animal model (28, 29), we evaluated the D3-creatine dilution method in a pilot study in humans (9). In this study, healthy young and elderly men and postmenopausal women with a range of muscle masses were evaluated at an inpatient unit for 5 days with continuous urine collections and serial plasma samples. A single 30-mg oral dose of D3-creatine was determined to be the optimal tracer dose. Total body creatine pool size and muscle mass were calculated from D3-creatinine enrichment in urine, which was determined using liquid chromatography-tandem mass spectrometry (LC-MS/MS). Isotopic steady-state D3-creatinine enrichment in the urine (mean ± SD) was achieved by 30.7 ± 11.2 h. Mean steady-state enrichment in urine provided muscle mass estimates that correlated well with MRI estimates for all subjects (r = 0.868, P < 0.0001), with less bias than total lean body mass (LBM) assessment by DXA, which overestimated muscle mass by approximately twofold compared with MRI. This is expected, as DXA assessment of total LBM is not specific for muscle and includes viscera in the chest and abdominal cavities and extracellular fluid. This pilot study demonstrated the feasibility of dilution of an oral D3-creatine dose determined by urine D3-creatinine enrichment to estimate total body muscle mass in humans.
The key objectives of the current study were to compare estimates of total body muscle mass using the deuterated D3-creatine dilution method with estimates using MRI and DXA in elderly subjects and subjects with chronic diseases, including CHF and COPD. The goals included 1) evaluation of the accuracy of the method using only a fasting morning urine sample and 2) assessment of repeatability (precision) over a 3- to 4-mo period.
MATERIALS AND METHODS
Study Design and Assessments
This study was performed at a single site, Pennington Biomedical Research Center (PBRC), Baton Rouge, LA. The study protocol and informed consent form were approved by the PBRC Institutional Review Board. A written, signed informed consent was obtained from each subject. Subjects were instructed by a certified dietitian to follow a stable weight-maintenance diet with specified protein intake and to avoid creatine supplements during the week before admission. Subjects were also instructed to maintain usual physical activity and avoid changes in activity or heavy exertion. Subjects were housed on the inpatient unit for the full 5-day study at initial and repeat admissions. Subjects were admitted on day −1 for baseline evaluation and acclimation. After an overnight fast, subjects were given a single oral tracer dose of D3-creatine (30 mg) at 8 AM on day 1 and continued to fast for 4 h while urine was collected (0–4 h). Subsequently, two meals [at noon (12 PM) and 6 PM] and two snacks (at 3 and 9 PM) were provided daily, with 40% of daily calories included in each meal and 20% of daily calories in snacks. Each meal had a consistent macronutrient content of 45% carbohydrate, 30% fat, and 25% protein (80% animal and 20% vegetable) to maintain stable ingestion of creatine and creatinine during the in-house portion of the study. Urine was continuously collected at consecutive 4- to 8-h intervals through day 5, with 8 AM as time 0 for each day. Fasting plasma samples were taken predose and at 24, 48, 72, and 96 h postdose.
For the primary objective, evaluation of the D3-creatine dilution method for measurement of muscle mass, healthy older (65- to 85-yr-old) subjects and patients with CHF or COPD (50–85 yr old) were evaluated at baseline admission. For evaluation of repeatability, the second assessment was performed 3–4 mo after baseline in 13 of the older subjects and in 1 patient with CHF.
Plasma D3-creatine, urinary D3-creatine, urinary D3-creatinine, and unlabeled creatine and creatinine were measured by LC-MS/MS with a validated, accurate, and precise assay conforming to industry standards, as described previously (23, 28, 29). The respective coefficients of variation (CVs) were 10.3% at lower limit of quantitation (LLOQ) (5 ng/ml) and <5% at all other quantitation levels for D3-creatine and 3.7% at LLOQ (10 ng/ml) and <1.3% at all other concentration levels. The signal-to-noise ratio was adequate to high, >10 at the LLOQ for both assays. Total body creatine pool size and muscle mass were calculated from D3-creatinine enrichment in urine. Total body muscle mass was measured by MRI (serial cross sections), whereas total LBM and appendicular lean mass (ALM) were measured by DXA (18, 20, 21) during the subjects’ stay on the inpatient unit. A GE Lunar iDXA (GE Healthcare, Chicago, IL) with a software system validated for both bone density and body composition measurements (CV ± 0.5%) was used. Muscle mass was also estimated from 24-h UCrn (17) based on the complete 24-h urine samples collected on the inpatient unit.
Urine Pharmacokinetic Methods
Urine pharmacokinetic analyses were performed as previously described (9).
Statistical Methods
This study was designed to estimate the time to isotopic steady state, creatine pool size, and total muscle mass using the D3-creatine dilution method. No formal statistical hypothesis testing was planned. Point estimates and corresponding confidence intervals were constructed for parameters of interest. The sample size was based, in part, on feasibility. If it is assumed that muscle mass estimates are normally distributed with constant variance, a sample size of 24 would provide ~90% power to detect a correlation of 0.6 using a one-sided t-test with α = 0.05. Correlations of this magnitude were observed previously (9).
The data were analyzed using SAS v9.3 (SAS Institute, Cary, NC), and graphs were produced in SAS or Tibco Spotfire Clinical Graphics. Data are summarized by dosing occasion, where applicable. Results are means ± SD, unless noted otherwise. Results from the first and repeat dosing occasions were consistent. results and discussion focus on the first dosing occasion because of the larger sample size, unless specified otherwise. There were no adjustments for multiplicity.
The cumulative amount of D3-creatine in urine represents the amount of the dose not taken up in the body creatine pool. For calculation of creatine pool size and muscle mass, it is important to know the amount of D3-creatine excreted, because an error in the estimate of the amount of D3-creatine taken up in the body creatine pool translates directly to the estimate of muscle mass. The cumulative amount and the percentage of dose excreted over 100 h postdose were calculated.
Total creatinine for each urine collection interval was calculated from the sum of unlabeled creatinine and D3-creatinine after conversion of results to molar units. The D3-creatinine enrichment ratio was calculated as D3-creatinine ÷ total creatinine, where both D3 and total creatinine were in molar units. For the repeat-dose part of the study, measurable D3-creatinine enrichment predose was subtracted from enrichment at all subsequent postdose time points. To allow for complete distribution of the D3-creatine dose and for the enrichment ratio to reach its maximum, the first 24 h of urine collections postdose were excluded from assessment of steady state. Linear regression of the enrichment ratio at the midpoint of the urine collection interval was performed separately for each subject. If the slope was statistically significantly different from 0 using α = 0.10, the earliest time point was dropped and the regression was performed again. This process was repeated until the slope was not statistically significantly different from 0. The earliest time point included in the final regression was defined as the time to achieve steady state (9).
Creatine pool size (g) for each subject was calculated as indicated below, where 131.1/134.1 is the ratio of the molecular weights of u D3-creatine.
Muscle mass was then estimated by dividing the creatine pool size estimate by 4.3 g/kg, which represents the concentration of creatine in whole wet muscle mass (22).
On the basis of observations from our previous study, prediction of D3-creatine excretion from the ratio of unlabeled creatine to creatinine appeared feasible. An exploratory analysis was performed to examine the relationship between the cumulative amount of D3-creatine excreted in urine and the ratio of unlabeled creatine to creatinine. A linear model was fit to cumulative excretion, including terms for 96- to 100-h ratio of urine unlabeled creatine to creatinine (Cr/Crn), sex, and sex × Cr/Crn. The 96- to 100-h sample time is of most interest, because it represents a time by which steady-state D3-creatinine enrichment was achieved and is the final sample for assessment of cumulative excretion of D3-creatine. It also represents a “single-sample” test, taken in the morning [0–4 h (8:00 am–12:00 pm) on day 5] after an overnight fast.
Muscle mass for each individual was calculated using the following methods: 1) mean urine D3-creatinine enrichment during steady state and actual cumulative D3-creatine excretion, 2) urine D3-creatinine enrichment from a single fasted (0–4 h) sample during steady state and actual cumulative D3-creatine excretion, 3) urine D3-creatinine enrichment from a single fasted (0–4 h) sample during steady state and cumulative D3-creatine excretion predicted from Cr/Crn from the same urine collection interval, and 4) fasted plasma D3-creatinine enrichment and cumulative D3-creatine excretion predicted from Cr/Crn from the same plasma sampling time. Muscle mass was also estimated from 24-h UCrn, as described previously (9).
Linear regression and Pearson’s product-moment correlation coefficients were used to examine linear relationships between methods of estimating muscle mass and the strength of the relationship. To assess the agreement between MRI, the reference standard, and each of the other methods, scatterplots of the difference between the two methods vs. the mean of the two methods were produced using Bland-Altman plot (5) methodology to ascertain agreement.
The inter- and intrasubject variability were estimated separately for each method using mixed-effects models, including data from the first and repeat assessments, and repeatability was assessed using Bland-Altman (5) methodology.
RESULTS
Subject Demographics
A total of 18 subjects were enrolled: 10 healthy older men and 4 postmenopausal women (67–80 yr old) plus 4 men (58–76 yr old) with chronic health conditions (2 with CHF and 2 with COPD). Demographics of the subjects are shown in Table 1. All subjects received a single oral dose of 30 mg of D3-creatine. All 18 subjects completed the first part of the study; however, only 13 (10 men and 3 women) of the healthy older subjects and 1 CHF patient finished the second repeat assessment part of the study. Of the four subjects who did not finish, one experienced a serious adverse event of retinal detachment, which the investigator considered was most likely due to the subject’s underlying medical conditions. The subject completed his follow-up visits for the first part only. The other three subjects declined the second part of the study due to investigator discretion, loss to follow-up, or study termination.
Table 1.
Subject disposition and demographics
| HV | CHF | COPD | Total | |
|---|---|---|---|---|
| No. of subjects | 14 | 2 | 2 | 18 |
| Planned, N | 14 | 14 | 14 | 42 |
| Entered, N | 14 | 2 | 2 | 18 |
| Completed, n (%) | 13 (93%) | 1 (50%) | 0 | 14 (78%) |
| Total no. of subjects withdrawn, N (%) | 1 (7%) | 1 (50%) | 2 (100%) | 4 (22%) |
| Adverse events, n (%) | 0 | 1 (50%) | 0 | 1 (6%) |
| Other reasons, n (%) | 1 | 0 | 2 | 3 (17%) |
| Demographics | ||||
| Females:males | 4:10 | 0:2 | 0:2 | 4:14 |
| Mean age, yr (SD) | 74.4 (4.83) | 75.0 (1.41) | 64.5 (9.19) | 73.3 (5.77) |
| Ethnicity, n (%) | ||||
| African heritage | 2 (14%) | 0 | 0 | 2 (11%) |
| White | 12 (86%) | 2 (100%) | 2 (100%) | 16 (89%) |
HV, healthy volunteer; CHF, congestive heart failure; COPD, chronic obstructive pulmonary disease; N, total group size; n, number of subjects who provided data used to calculate mean; SD, standard deviation.
Pharmacokinetics of D3-Creatine
D3-creatine excretion.
The majority of D3-creatine excretion in urine was achieved by 24 h after dosing, with continued excretion over the following 3 days. Median cumulative percentage of the D3-creatine dose excreted in urine after the first dose was 3.5% (range 0.1–25.0%) in the men and 25.6% (range 21.5–35.5%) in the postmenopausal women. The mean cumulative percentage of the D3-creatine dose excreted over time is plotted by population in Fig. 1.
Fig. 1.
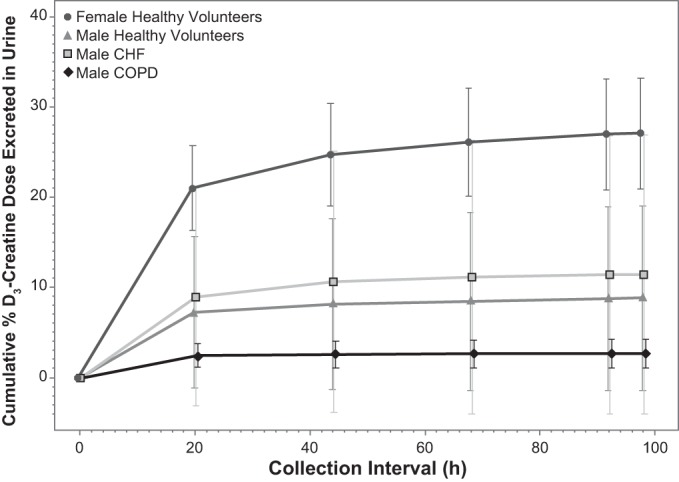
Cumulative percentage of D3-creatine dose excreted in urine by population: healthy men (n = 10), healthy women (n = 4), congestive heart failure (CHF) patients (n = 2 men), and chronic obstructive pulmonary disease (COPD) patients (n = 2 men). Values are means ± SD.
Prediction of D3-creatine excretion.
The relationship between cumulative excretion of D3-creatine and Cr/Crn from the 96- to 100-h sample was examined and plotted with fitted lines overlaid in Fig. 2. The linear model fitted to the data is displayed in Table 2. The sex × Cr/Crn interaction term was not significant and was dropped from the model. Sex was significant in the model (P = 0.02), resulting in separate lines for male and female subjects.
Fig. 2.
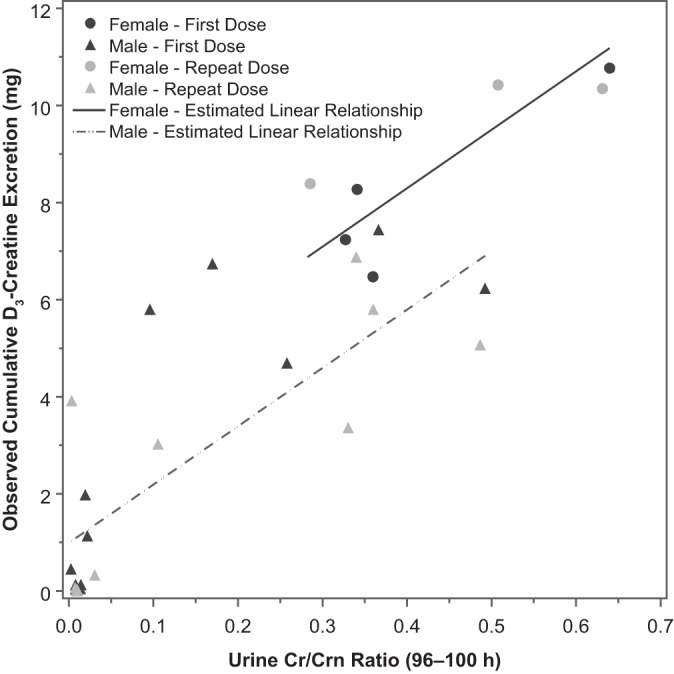
Observed cumulative D3-creatine excretion vs. 96- to 100-h ratio of urine unlabeled creatine to creatinine (Cr/Crn) with fitted lines by sex.
Table 2.
Parameter estimates from linear model for cumulative excretion of D3-creatine
| Model Term | Parameter Estimate | SE | df | P Value | Intersubject Variance | Residual Variance |
|---|---|---|---|---|---|---|
| Intercept | 0.9891 | 0.4232 | 16.3 | 0.0325 | 0.6554 | 1.7739 |
| Cr/Crn | 12.0216 | 1.9437 | 17.4 | <0.0001 | ||
| Sex | ||||||
| Female | 2.4922 | 0.9616 | 15.6 | 0.0200 | ||
| Male | 0 |
Cr/Crn, creatine-to-creatinine ratio.
The predicted vs. observed amounts of D3-creatine excreted are plotted in Fig. 3. The fit appears to be better in the female than male subjects. This is likely due to the greater variability in cumulative D3-creatine excretion in male subjects. This analysis is limited by the small sample size overall and in female subjects in particular.
Fig. 3.
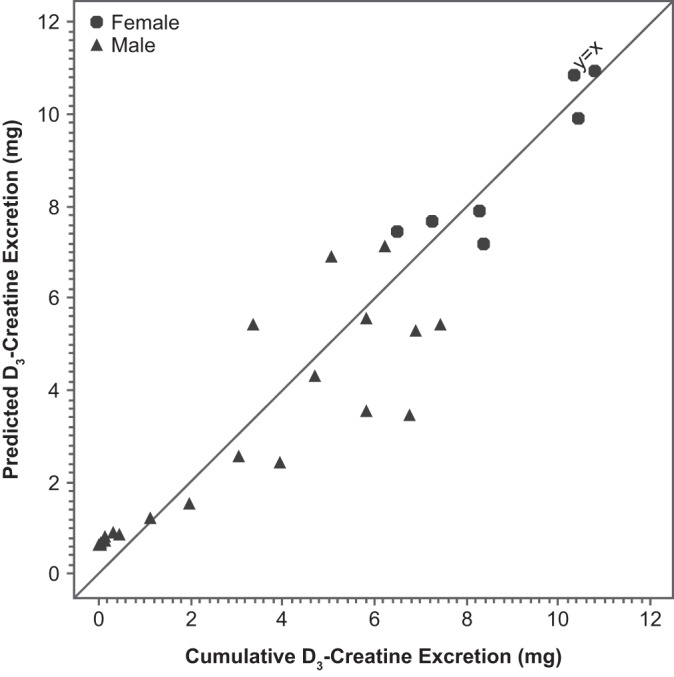
Predicted vs. observed cumulative D3-creatine excretion with reference line at y = x (n = 14 males and 4 females).
Isotopic Enrichment in Urine and Plasma
Steady state.
Median time to steady-state D3-creatinine enrichment in urine in the healthy older subjects was 30 h (range 26–62 h) (Fig. 4). In general, the time to achieve steady state was longer in the women than the men (median 52 vs. 26 h).
Fig. 4.
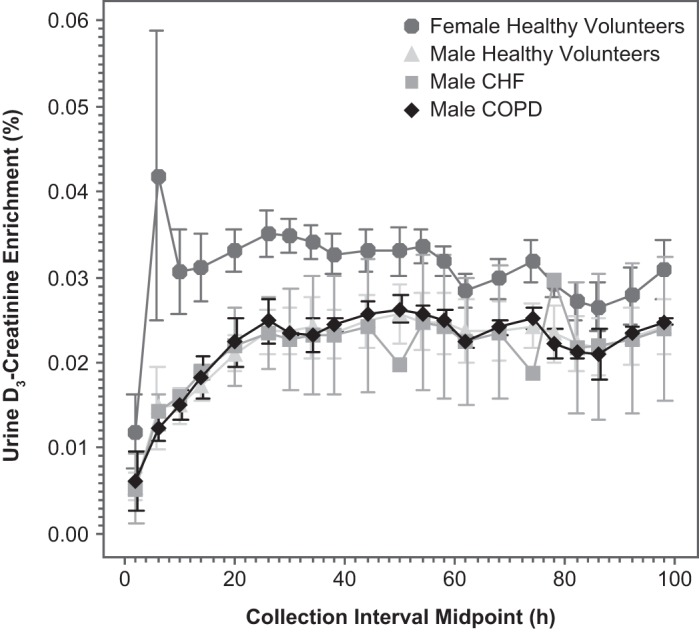
Urine D3-creatinine enrichment vs. time by population: healthy men (n = 10), healthy women (n = 4), CHF patients (n = 2 men), and COPD patients (n = 2 men). Values are means ± SD.
An apparent diurnal variation was observed for urinary creatinine enrichment (Fig. 4). The enrichment in urine varied in a wave pattern with a ~24-h periodicity, with the highest values at the overnight fasted time points and lower values during the daytime. These findings are consistent with dilution of urinary creatinine by dietary (unlabeled) creatinine (25).
Visual inspection of D3-creatinine enrichment from fasted plasma samples indicated that achievement of steady state was consistent with urine results (data not shown).
Comparison of Methods
Estimates of muscle mass or LBM from all methods are summarized by population in Table 3. The correlation between MRI and each of the other methods was strong (Table 4, Fig. 5). The correlation between MRI and the urine D3-creatine methods was 0.884–0.913 and was lower with the plasma D3-creatine method (r = 0.815; Table 4). The highest correlations were observed between MRI and DXA assessment of total LBM and ALM (r = 0.976 and r = 0.977, respectively). However, the magnitude of the bias was greater with the DXA measures than with any of the D3-creatine methods. Estimates of the bias (mean difference between MRI and each method) and limits of agreement (bias ± 2 SD) are presented in Table 5. The D3-creatine method using steady-state enrichment in urine (method 1) underestimated muscle mass relative to MRI by 2.26 ± 5.86 kg. The other two urine D3-creatine methods (methods 2 and 3) produced similar results, underestimating muscle mass relative to MRI. The D3-creatine method using plasma enrichment (method 4) and DXA assessment of total LBM overestimated muscle mass relative to MRI by 1.21 ± 7.06 and 22.49 ± 7.42 kg, respectively. The lowest estimates of muscle mass were produced by DXA assessment of ALM and the 24-h UCrn method, which underestimated muscle mass relative to MRI by 4.62 ± 3.58 and 8.02 ± 5.96 kg, respectively.
Table 3.
Summary of muscle mass or LBM estimates
| First Dosing Occasion |
Repeat Dosing Occasion |
|||||||
|---|---|---|---|---|---|---|---|---|
| N | n | Mean | SD | N | n | Mean | SD | |
| D3-creatine | ||||||||
| Method 1 (urine) | ||||||||
| HV female | 4 | 4 | 16.94 | 1.111 | 3 | 3 | 15.64 | 0.347 |
| HV male | 10 | 10 | 26.47 | 3.494 | 10 | 10 | 27.74 | 4.029 |
| CHF male | 2 | 2 | 26.82 | 5.007 | 1 | 1 | 35.37 | |
| COPD male | 2 | 2 | 28.00 | 0.688 | ||||
| Method 2 (urine) | ||||||||
| HV female | 4 | 4 | 16.31 | 1.245 | 3 | 3 | 14.71 | 0.802 |
| HV male | 10 | 10 | 25.98 | 3.581 | 10 | 10 | 27.14 | 3.510 |
| CHF male | 2 | 2 | 25.99 | 5.279 | 1 | 1 | 32.48 | |
| COPD male | 2 | 2 | 26.70 | 0.002 | ||||
| Method 3 (urine) | ||||||||
| HV female | 4 | 4 | 16.09 | 1.201 | 3 | 3 | 14.98 | 0.313 |
| HV male | 10 | 10 | 26.07 | 3.027 | 10 | 10 | 27.12 | 4.068 |
| CHF male | 2 | 2 | 27.79 | 8.576 | 1 | 1 | 30.00 | |
| COPD male | 2 | 2 | 26.48 | 0.211 | ||||
| Method 4 (plasma) | ||||||||
| HV female | 4 | 2 | 18.95 | 0.584 | 3 | 3 | 19.42 | 0.777 |
| HV male | 10 | 10 | 31.83 | 3.879 | 10 | 4 | 32.26 | 4.817 |
| CHF male | 2 | 2 | 27.48 | 6.832 | 1 | 1 | 28.99 | |
| COPD male | 2 | 2 | 26.42 | 0.189 | ||||
| MRI | ||||||||
| HV female | 4 | 4 | 18.41 | 1.897 | 3 | 3 | 17.22 | 0.701 |
| HV male | 10 | 10 | 30.24 | 4.719 | 10 | 10 | 29.77 | 4.753 |
| CHF male | 2 | 1 | 23.24 | |||||
| COPD male | 2 | 2 | 25.43 | 0.988 | ||||
| DXA | ||||||||
| Total LBM | ||||||||
| HV female | 4 | 4 | 36.39 | 2.674 | 3 | 3 | 35.88 | 1.576 |
| HV male | 10 | 10 | 54.61 | 7.285 | 10 | 10 | 54.03 | 7.418 |
| CHF male | 2 | 2 | 49.96 | 4.562 | 1 | 1 | 52.26 | |
| COPD male | 2 | 2 | 47.07 | 0.350 | ||||
| ALM | ||||||||
| HV female | 4 | 4 | 15.84 | 1.570 | 3 | 3 | 15.27 | 1.091 |
| HV male | 10 | 10 | 24.85 | 3.871 | 10 | 10 | 24.77 | 4.110 |
| CHF male | 2 | 2 | 21.86 | 3.569 | 1 | 1 | 22.99 | |
| COPD male | 2 | 2 | 20.21 | 0.264 | ||||
| 24-h UCrn (mean of 3 days) | ||||||||
| HV female | 4 | 4 | 12.43 | 1.470 | 3 | 3 | 12.97 | 1.234 |
| HV male | 10 | 10 | 20.62 | 3.216 | 10 | 10 | 22.03 | 3.366 |
| CHF male | 2 | 2 | 15.23 | 3.496 | 1 | 1 | 14.60 | |
| COPD male | 2 | 2 | 20.10 | 1.399 | ||||
Values are expressed in kg. LBM, lean body mass; N, total group size; n, number of subjects who provided data used to calculate mean; ALM, appendicular lean mass; SD, standard deviation; MRI, magnetic resonance imaging; DXA, dual-energy X-ray absorptiometry; 24-h UCrn; 24-h urinary creatinine excretion.
Table 4.
Correlation between MRI and other methods
| N | SQRT (MSE) | R | P Value | |
|---|---|---|---|---|
| MRI vs. D3-creatine | ||||
| Method 1 (urine) | 17 | 2.98 | 0.888 | <0.0001 |
| Method 2 (urine) | 17 | 2.64 | 0.913 | <0.0001 |
| Method 3 (urine) | 17 | 3.02 | 0.884 | <0.0001 |
| Method 4 (plasma) | 15 | 3.50 | 0.815 | 0.0002 |
| MRI vs. DXA | ||||
| LBM | 17 | 1.41 | 0.976 | <0.0001 |
| ALM | 17 | 1.39 | 0.977 | <0.0001 |
| MRI vs. 24-h UCrn (mean of 3 days) | 17 | 2.75 | 0.905 | <0.0001 |
SQRT, square root; MSE, mean square error.
Fig. 5.

Scatterplots of magnetic resonance imaging (MRI) vs. alternate methods with reference lines at y = x. A: MRI vs. D3-creatine method 1 estimate of muscle mass. B: MRI vs. D3-creatine method 2 estimate of muscle mass. C: MRI vs. D3-creatine method 3 estimate of muscle mass. D: MRI vs. dual-energy X-ray absorptiometry (DXA) total lean body mass. E: MRI vs. DXA appendicular lean mass. F: MRI vs. 24-h urinary creatinine excretion estimate of muscle mass.
Table 5.
Bias and limits of agreement between MRI and other methods
| Limits of Agreement |
|||||
|---|---|---|---|---|---|
| N | Mean of Difference | SD of Difference | Lower | Upper | |
| MRI vs. D3-creatine | |||||
| Method 1 (urine) | 17 | 2.26 | 2.93 | –3.60 | 8.11 |
| Method 2 (urine) | 17 | 2.91 | 2.63 | –2.36 | 8.17 |
| Method 3 (urine) | 17 | 3.00 | 2.75 | –2.50 | 8.51 |
| Method 4 (plasma) | 17 | –1.21 | 3.53 | –8.28 | 5.85 |
| MRI vs. DXA | |||||
| LBM | 17 | –22.49 | 3.71 | –29.92 | –15.07 |
| ALM | 17 | 4.62 | 1.79 | 1.04 | 8.21 |
| MRI vs. 24-h UCrn (mean of 3 days) | 17 | 8.02 | 2.98 | 2.07 | 13.97 |
Values are expressed in kg.
Repeatability or Test-Retest Reliability
The estimates of the bias or mean difference between repeat assessments was low (<0.5 kg) for all methods, with the exception of urine D3-creatine method 1 (1.08 kg) and method 2 (0.78 kg) and 24-h UCrn (1.38 kg). All subjects who returned for the repeat assessment had measurable D3-creatinine enrichment at the day −1, 16- to 24-h interval before the repeat dose (Table 6). This value was subtracted from all subsequent estimates of enrichment before estimation of muscle mass. The limits of agreement (Table 7) for the mean difference between repeat assessments (mean ± 2 SDs) were wider for all D3-creatine methods than for DXA and MRI. For example, for urine D3-creatine method 3, the limits of agreement were −6.78 to 7.37 kg compared with DXA assessment of total LBM (−2.44 to 1.80 kg) and MRI (−1.99 to 1.10 kg). This means that ~95% of the differences in repeat assessments for urine D3-creatine method 3 would be expected to fall within −6.78 to 7.37 kg. These limits encompass differences of a magnitude that would be clinically meaningful and indicate poor repeatability compared with DXA and MRI.
Table 6.
Urine D3-creatinine enrichment before repeat dose
| Population | n | Mean | SD |
|---|---|---|---|
| HV | |||
| Females | |||
| Day −1, 0–4 h | 3 | 0.004 | 0.0014 |
| Day −1, 16–24 h | 3 | 0.003 | 0.0014 |
| Males | |||
| Day −1, 0–4 h | 10 | 0.002 | 0.0020 |
| Day −1, 16–24 h | 10 | 0.006 | 0.0074 |
| CHF | |||
| Males | |||
| Day −1, 0–4 h | 1 | 0.004 | |
| Day −1, 16–24 h | 1 | 0.0024 |
Values are percentages.
Table 7.
Assessment of repeatability
| Parameter | n | Mean of Difference* | SD of Difference* | Limits of Agreement* | 95% CI† | IntraSubject SD† | InterSubject SD† |
|---|---|---|---|---|---|---|---|
| D3-creatine | |||||||
| Method 1(urine) | 14 | 1.08 | 3.15 | –5.23 to 7.38 | –0.75, 2.90 | 2.231 | 6.078 |
| Method 2 (urine) | 14 | 0.78 | 3.03 | –5.28 to 6.84 | –0.97, 2.53 | 2.143 | 5.950 |
| Method 3 (urine) | 14 | 0.30 | 3.54 | –6.78 to 7.37 | –1.74, 2.34 | 2.501 | 6.027 |
| Method 4 (plasma) | 6 | –0.14 | 3.39 | –6.92 to 6.63 | –3.70, 3.41 | 2.396 | 6.666 |
| MRI | 14 | –0.45 | 0.77 | –1.99 to 1.10 | –0.92, 0.02 | 0.546 | 6.891 |
| DXA | |||||||
| Total LBM | 14 | –0.32 | 1.06 | –2.44 to 1.80 | –0.93, 0.29 | 0.749 | 10.059 |
| ALM | 14 | –0.11 | 0.60 | –1.31 to 1.09 | –0.46, 0.24 | 0.425 | 5.268 |
| 24-h UCrn (mean of 3 days) | 14 | 1.38 | 1.34 | –1.30 to 4.07 | 0.61, 2.16 | 0.95 | 4.906 |
CI, confidence interval.
Difference between first and repeat assessments.
Estimates from mixed-effects ANOVA models.
Estimates of intrasubject variability are considerably higher for the D3-creatine methods than for MRI (3.9- to 4.6-fold), DXA assessment of total LBM (2.9- to 3.3-fold), or DXA assessment of ALM (5.0- to 5.9-fold) (Table 7). The intrasubject variability was also higher for the D3-creatine methods than for the 24-h UCrn method, but it should be noted that the muscle mass estimate from the 24-h UCrn method uses the mean from 3 days of 24-h urine collections, which would be expected to reduce the variability relative to a single 24-h urine collection.
DISCUSSION
This study further explores the feasibility of an accurate estimation of muscle mass in human subjects based on determination of the creatine pool size using D3-creatine dilution. We previously reported the use of D3-creatine dilution in our initial study (9), in which all urine was collected to allow accurate determination of deuterated and unlabeled creatine and creatinine amounts in urine samples. This allowed the estimation of the creatine pool size based on D3-creatine dilution in the body creatine pool and subsequent D3-creatinine enrichment in urine. Muscle mass was estimated by dividing the estimated creatine pool size using an estimate of creatine content in whole muscle (13, 22). The initial method was based on continuous urine collection over 5 days postdosing. As such, this method could be used in a research study but would not be practical for population studies or clinical trials with significant outpatient visits. In this study we explored whether a fasting morning urine sample would suffice to estimate muscle mass, both as a single measurement and for longitudinal evaluation, allowing a simple urine test that could be clinically applied. Thus we expanded the study population beyond our initial study by enrolling elderly, healthy men and postmenopausal women and a small sample of patients with the chronic conditions COPD and CHF. In addition to broadening our study population, our key objectives were 1) to determine the accuracy of the method using only a single, fasting morning urine sample and 2) to determine the precision (repeatability) of the method over a 3- to 4-mo interval.
We used three approaches to estimate the creatine pool size based on urine samples to estimate muscle mass and compared these with established methods [cross-sectional MRI (total body muscle mass) and DXA (total LBM and ALM)] and 24-h UCrn. We also assessed the use of plasma samples (method 4), which did not perform as well as the urine-based methods, and therefore we have not reported the full findings.
Compared with MRI, D3-creatine dilution methods 1–3 underestimated muscle mass by 2.26–3.0 kg, with correlation coefficients ranging from 0.884 to 0.913. In comparison, DXA showed correlations of 0.976 for total LBM and 0.977 for ALM but showed marked bias, with an overestimate of 22.49 kg for total LBM and an underestimate of 4.62 kg for ALM. The 24-h urinary creatinine content also underestimated lean mass by 8.02 kg. These differences in bias are important to consider in attempts to assess the severity of muscle wasting. DXA has become a standard method to determine muscle mass, and some groups have stressed the use of DXA assessment of ALM as a more consistent method than DXA assessment of LBM and one that is more closely related to key limb muscle groups critical for physical function (3, 6, 8). However, the total LBM obtained by DXA could lead to misinterpretation, with values that are nearly twice the total muscle mass as measured by MRI. This is known and expected, however, since LBM values obtained by DXA include abdominal and thoracic viscera and extracellular fluid.
The differences in the urinary excretion of the dose of D3-creatine between men and women are not well understood. In men, we found markedly lower D3-creatine excretion values, some of which were minimal, ranging from 0.1 to 25.0% (median 3.46%); in women, the range was much higher [21.5–35.5% (median 25.63%)]. In association with this finding, women required a much longer time to reach steady state. These sex differences were also observed in our initial clinical study on the D3-creatine method (9), but not in the rodent study (29). Several factors can impact muscle creatine content, especially diet (e.g., vegan vs. meat-eating) and creatine supplementation, in either sex, while a decline with age and a greater muscle mass in men are more consistent across groups (1, 14, 16, 25, 26). Information on chronic diseases that are stable suggest that the muscle creatine content seems unaffected (11, 30, 31), except in exacerbations (1) and in muscle diseases such as muscular dystrophy (12). The small sample of four subjects with chronic disease was inadequate to allow any meaningful comparison with the healthy, older subjects.
Conclusions
D3-creatine enrichment based on fasted urine samples on day 5 (0–4 h), when corrected for observed D3-creatine excretion (method 2) and predicted D3-creatine excretion (method 3), provided estimates of muscle mass that strongly correlated with the muscle mass estimate by MRI for all subjects (r = 0.91, P < 0.0001 and r = 0.884, P < 0.0001) and provided estimates of muscle mass with less bias than assessment by DXA. DXA also showed a strong correlation with MRI, but the measure of total LBM as a surrogate for muscle mass provides a significant overestimate. Likewise, ALM provides a measure of limb muscle mass not confounded by viscera or fluid but is an underestimate of total muscle mass. Noteworthy is the possibility that the D3-creatine method may reflect the amount of active muscle mass, as it would not include other common tissues in muscle, such as fibrotic tissue, fat, and intramyocellular lipids. There was greater intraindividual variability with the D3-creatine method (intrasubject SD = 2.5 kg for method 3) than MRI (intrasubject SD = 0.55 kg) or DXA (intrasubject SD = 0.75 kg for total LBM and 0.43 kg for ALM).
The relationships between urinary excretion of D3-creatine and fasted Cr/Crn in both urine and plasma were explored. A linear model was fit to the data. Estimation of muscle mass from a 4-h urine sample appears feasible by correction of predicted urine loss of the D3-creatine tracer using an estimation derived from Cr/Crn (method 3). However, the ability to accurately model the relationship between D3-creatine excretion and Cr/Crn based on the results of this study is limited by the small sample size for the study as a whole and among women and patients with chronic illness in particular. Extrapolation of these results should be undertaken only with an understanding of these limitations. This study supports the need for further clinical studies in a diverse population for model development, assessment of repeatability, and assessment of the clinical application of the D3-creatine method for estimation of muscle mass using a single urine sample.
GRANTS
Funding for this study was provided by GlaxoSmithKline. The research leading to these results has received support from the Innovative Medicines Initiative Joint Undertaking under Grant Agreement 115621, resources of which are composed of financial contribution from the European Union's Seventh Framework Programme (FP7/2007–2013) and European Federation of Pharmaceutical Industries and Association companies' in-kind contribution (http://www.imi.europa.eu) as part of the SPRINTT (Sarcopenia and Physical Frailty in Older People: Multicomponent Intervention Strategies) Consortium. This work was also partially supported by National Institute of Diabetes and Digestive and Kidney Diseases Nutrition Obesity Research Center Grant P30-DK-072476.
DISCLOSURES
R. V. Clark has recently retired from and is a stockholder of GlaxoSmithKline (GSK). A. C. Walker is an employee and stockholder of GSK. R. R. Miller was an employee of GSK at the time of the study and holds stock in GSK; he is currently an employee of and stockholder in Novartis. R. L. O’Connor-Semmes was an employee of GSK at the time of the study and holds stock in GSK; she is currently an employee of PAREXEL, which has received funding from GSK in relation to other work. E. Ravussin has no conflict of interest to report. W. T. Cefalu is supported in part by National Institute of General Medical Sciences Grant 1U54-GM-104940, which funds the Louisiana Clinical and Translational Science Center; he has also received financial support from AstraZeneca, Janssen, MannKind, Sanofi, Lexicon Pharmaceuticals, and he has received consulting fees from Intarcia Therapeutics and Sanofi.
AUTHOR CONTRIBUTIONS
R.V.C., A.C.W., R.R.M., R.L.O.S., E.R., and W.T.C. conceived and designed research; R.V.C., R.R.M., E.R., and W.T.C. performed experiments; R.V.C., A.C.W., R.R.M., R.L.O.S., E.R., and W.T.C. analyzed data; R.V.C., A.C.W., R.R.M., R.L.O.S., and W.T.C. interpreted results of experiments; R.V.C. and A.C.W. drafted manuscript; R.V.C., A.C.W., R.R.M., R.L.O.S., E.R., and W.T.C. edited and revised manuscript; R.V.C., A.C.W., R.R.M., R.L.O.S., E.R., and W.T.C. approved final version of manuscript; A.C.W. and R.L.O.S. prepared figures.
ACKNOWLEDGMENTS
All listed authors meet the criteria for authorship set forth by the International Committee for Medical Journal Editors. Editorial support (assembling tables and figures, collating author comments, copyediting, fact checking, and referencing) and graphic services were provided by Elizabeth Rosenberg and Nancy Price (AOI Communications) and were funded by GlaxoSmithKline.
REFERENCES
- 1.Balsom PD, Söderlund K, Ekblom B. Creatine in humans with special reference to creatine supplementation. Sports Med 18: 268–280, 1994. doi: 10.2165/00007256-199418040-00005. [DOI] [PubMed] [Google Scholar]
- 2.Baracos V, Caserotti P, Earthman CP, Fields D, Gallagher D, Hall KD, Heymsfield SB, Müller MJ, Rosen AN, Pichard C, Redman LM, Shen W, Shepherd JA, Thomas D. Advances in the science and application of body composition measurement. JPEN J Parenter Enteral Nutr 36: 96–107, 2012. doi: 10.1177/0148607111417448. [DOI] [PMC free article] [PubMed] [Google Scholar]
- 3.Batsis JA, Mackenzie TA, Lopez-Jimenez F, Bartels SJ. Sarcopenia, sarcopenic obesity, and functional impairments in older adults: National Health and Nutrition Examination Surveys 1999–2004. Nutr Res 35: 1031–1039, 2015. doi: 10.1016/j.nutres.2015.09.003. [DOI] [PMC free article] [PubMed] [Google Scholar]
- 4.Bianchi L, Ferrucci L, Cherubini A, Maggio M, Bandinelli S, Savino E, Brombo G, Zuliani G, Guralnik JM, Landi F, Volpato S. The predictive value of the EWGSOP definition of sarcopenia: results from the InCHIANTI study. J Gerontol A Biol Sci Med Sci 71: 259–264, 2016. doi: 10.1093/gerona/glv129. [DOI] [PMC free article] [PubMed] [Google Scholar]
- 5.Bland JM, Altman DG. Statistical methods for assessing agreement between two methods of clinical measurement. Lancet 327: 307–310, 1986. doi: 10.1016/S0140-6736(86)90837-8. [DOI] [PubMed] [Google Scholar]
- 6.Cawthon PM. Assessment of lean mass and physical performance in sarcopenia. J Clin Densitom 18: 467–471, 2015. doi: 10.1016/j.jocd.2015.05.063. [DOI] [PubMed] [Google Scholar]
- 7.Cawthon PM, Fox KM, Gandra SR, Delmonico MJ, Chiou CF, Anthony MS, Sewall A, Goodpaster B, Satterfield S, Cummings SR, Harris TB; Health, Aging and Body Composition Study . Do muscle mass, muscle density, strength, and physical function similarly influence risk of hospitalization in older adults? J Am Geriatr Soc 57: 1411–1419, 2009. doi: 10.1111/j.1532-5415.2009.02366.x. [DOI] [PMC free article] [PubMed] [Google Scholar]
- 8.Cawthon PM, Peters KW, Shardell MD, McLean RR, Dam TT, Kenny AM, Fragala MS, Harris TB, Kiel DP, Guralnik JM, Ferrucci L, Kritchevsky SB, Vassileva MT, Studenski SA, Alley DE. Cutpoints for low appendicular lean mass that identify older adults with clinically significant weakness. J Gerontol A Biol Sci Med Sci 69: 567–575, 2014. doi: 10.1093/gerona/glu023. [DOI] [PMC free article] [PubMed] [Google Scholar]
- 9.Clark RV, Walker AC, O’Connor-Semmes RL, Leonard MS, Miller RR, Stimpson SA, Turner SM, Ravussin E, Cefalu WT, Hellerstein MK, Evans WJ. Total body skeletal muscle mass: estimation by creatine (methyl-d3) dilution in humans. J Appl Physiol (1985) 116: 1605–1613, 2014. doi: 10.1152/japplphysiol.00045.2014. [DOI] [PMC free article] [PubMed] [Google Scholar]
- 10.Drescher C, Konishi M, Ebner N, Springer J. Loss of muscle mass: current developments in cachexia and sarcopenia focused on biomarkers and treatment. J Cachexia Sarcopenia Muscle 6: 303–311, 2015. doi: 10.1002/jcsm.12082. [DOI] [PMC free article] [PubMed] [Google Scholar]
- 11.Fiaccadori E, Del Canale S, Vitali P, Coffrini E, Ronda N, Guariglia A. Skeletal muscle energetics, acid-base equilibrium and lactate metabolism in patients with severe hypercapnia and hypoxemia. Chest 92: 883–887, 1987. doi: 10.1378/chest.92.5.883. [DOI] [PubMed] [Google Scholar]
- 12.Fitch CD, Sinton DW. A study of creatine metabolism in diseases causing muscle wasting. J Clin Invest 43: 444–452, 1964. doi: 10.1172/JCI104929. [DOI] [PMC free article] [PubMed] [Google Scholar]
- 13.Flear CT, Carpenter RG, Florence I. Variability in the water, sodium, potassium, and chloride content of human skeletal muscle. J Clin Pathol 18: 74–81, 1965. doi: 10.1136/jcp.18.1.74. [DOI] [PMC free article] [PubMed] [Google Scholar]
- 14.Forsberg AM, Nilsson E, Werneman J, Bergström J, Hultman E. Muscle composition in relation to age and sex. Clin Sci (Lond) 81: 249–256, 1991. doi: 10.1042/cs0810249. [DOI] [PubMed] [Google Scholar]
- 15.Greenhaff PL, Bodin K, Soderlund K, Hultman E. Effect of oral creatine supplementation on skeletal muscle phosphocreatine resynthesis. Am J Physiol Endocrinol Metab 266: E725–E730, 1994. [DOI] [PubMed] [Google Scholar]
- 16.Harris RC, Söderlund K, Hultman E. Elevation of creatine in resting and exercised muscle of normal subjects by creatine supplementation. Clin Sci (Lond) 83: 367–374, 1992. doi: 10.1042/cs0830367. [DOI] [PubMed] [Google Scholar]
- 17.Heymsfield SB, Arteaga C, McManus C, Smith J, Moffitt S. Measurement of muscle mass in humans: validity of the 24-hour urinary creatinine method. Am J Clin Nutr 37: 478–494, 1983. [DOI] [PubMed] [Google Scholar]
- 18.Heymsfield SB, Wang J, Lichtman S, Kamen Y, Kehayias J, Pierson RN Jr. Body composition in elderly subjects: a critical appraisal of clinical methodology. Am J Clin Nutr 50 Suppl: 1167–1175, 1989. [DOI] [PubMed] [Google Scholar]
- 19.Innovative Medicines Initiative (IMI) Sarcopenia and Physical Frailty in Older People: Multi-Component Treatment Strategies (Online). http://www.imi.europa.eu/projects-results/project-factsheets/sprintt [8 Jan 2017].
- 20.Kim J, Heshka S, Gallagher D, Kotler DP, Mayer L, Albu J, Shen W, Freda PU, Heymsfield SB. Intermuscular adipose tissue-free skeletal muscle mass: estimation by dual-energy X-ray absorptiometry in adults. J Appl Physiol (1985) 97: 655–660, 2004. doi: 10.1152/japplphysiol.00260.2004. [DOI] [PubMed] [Google Scholar]
- 21.Kim J, Wang Z, Heymsfield SB, Baumgartner RN, Gallagher D. Total-body skeletal muscle mass: estimation by a new dual-energy X-ray absorptiometry method. Am J Clin Nutr 76: 378–383, 2002. [DOI] [PubMed] [Google Scholar]
- 22.Kreisberg RA, Bowdoin B, Meador CK. Measurement of muscle mass in humans by isotopic dilution of creatine-14C. J Appl Physiol 28: 264–267, 1970. [DOI] [PubMed] [Google Scholar]
- 23.Leonard M, Dunn J, Smith G. A clinical biomarker assay for the quantification of d3-creatinine and creatinine using LC-MS/MS. Bioanalysis 6: 745–759, 2014. doi: 10.4155/bio.13.323. [DOI] [PubMed] [Google Scholar]
- 24.Lustgarten MS, Fielding RA. Assessment of analytical methods used to measure changes in body composition in the elderly and recommendations for their use in phase II clinical trials. J Nutr Health Aging 15: 368–375, 2011. doi: 10.1007/s12603-011-0049-x. [DOI] [PMC free article] [PubMed] [Google Scholar]
- 25.Persky AM, Brazeau GA, Hochhaus G. Pharmacokinetics of the dietary supplement creatine. Clin Pharmacokinet 42: 557–574, 2003. doi: 10.2165/00003088-200342060-00005. [DOI] [PubMed] [Google Scholar]
- 26.Safdar A, Yardley NJ, Snow R, Melov S, Tarnopolsky MA. Global and targeted gene expression and protein content in skeletal muscle of young men following short-term creatine monohydrate supplementation. Physiol Genomics 32: 219–228, 2008. doi: 10.1152/physiolgenomics.00157.2007. [DOI] [PubMed] [Google Scholar]
- 27.Sahlin K, Tonkonogi M, Söderlund K. Energy supply and muscle fatigue in humans. Acta Physiol Scand 162: 261–266, 1998. doi: 10.1046/j.1365-201X.1998.0298f.x. [DOI] [PubMed] [Google Scholar]
- 28.Stimpson SA, Leonard MS, Clifton LG, Poole JC, Turner SM, Shearer TW, Remlinger KS, Clark RV, Hellerstein MK, Evans WJ. Longitudinal changes in total body creatine pool size and skeletal muscle mass using the D3-creatine dilution method. J Cachexia Sarcopenia Muscle 4: 217–223, 2013. doi: 10.1007/s13539-013-0110-1. [DOI] [PMC free article] [PubMed] [Google Scholar]
- 29.Stimpson SA, Turner SM, Clifton LG, Poole JC, Mohammed HA, Shearer TW, Waitt GM, Hagerty LL, Remlinger KS, Hellerstein MK, Evans WJ. Total-body creatine pool size and skeletal muscle mass determination by creatine-(methyl-d3) dilution in rats. J Appl Physiol (1985) 112: 1940–1948, 2012. doi: 10.1152/japplphysiol.00122.2012. [DOI] [PubMed] [Google Scholar]
- 30.Weber MA, Krakowski-Roosen H, Schröder L, Kinscherf R, Krix M, Kopp-Schneider A, Essig M, Bachert P, Kauczor HU, Hildebrandt W. Morphology, metabolism, microcirculation, and strength of skeletal muscles in cancer-related cachexia. Acta Oncol 48: 116–124, 2009. doi: 10.1080/02841860802130001. [DOI] [PubMed] [Google Scholar]
- 31.Willer B, Stucki G, Hoppeler H, Brühlmann P, Krähenbühl S. Effects of creatine supplementation on muscle weakness in patients with rheumatoid arthritis. Rheumatology (Oxford) 39: 293–298, 2000. doi: 10.1093/rheumatology/39.3.293. [DOI] [PubMed] [Google Scholar]
- 32.Wyss M, Kaddurah-Daouk R. Creatine and creatinine metabolism. Physiol Rev 80: 1107–1213, 2000. [DOI] [PubMed] [Google Scholar]