Abstract
The fluid mechanics of whistling involve the instability of an air jet, resultant vortex rings, and the interaction of these rings with rigid boundaries (see http://www.canal-u.tv/video/cerimes/etude_radiocinematographique_d_un_siffleur_turc_de_kuskoy.13056 and Meyer J. Whistled Languages. Berlin, Germany: Springer, 2015, p. 74–774). Experimental models support the hypothesis that the sound in human whistling is generated by a Helmholtz resonator, suggesting that the oral cavity acts as a resonant chamber bounded by two orifices, posteriorly by raising the tongue to the hard palate, and anteriorly by pursed lips (Henrywood RH, Agarwal A. Phys Fluids 25: 107101, 2013). However, the detailed anatomical changes in the vocal tract and their relation to the frequencies generated have not been described in the literature. In this study, videofluoroscopic and simultaneous audio recordings were made of subjects whistling with the bilabial (i.e., “puckered lip”) technique. One whistling subject was also recorded, using magnetic resonance imaging. As predicted by theory, the frequency of sound generated decreased as the size of the resonant cavity increased; this relationship was preserved throughout various whistling tasks and was consistent across subjects. Changes in the size of the resonant cavity were primarily modulated by tongue position rather than jaw opening and closing. Additionally, when high-frequency notes were produced, lateral chambers formed in the buccal space. These results provide the first dynamic anatomical evidence concerning the acoustic production of human whistling.
NEW & NOTEWORTHY We establish a new and much firmer quantitative and physiological footing to current theoretical models on human whistling. We also document a novel lateral airflow mechanism used by both of our participants to produce high-frequency notes.
Keywords: whistling, aerodynamic whistle, acoustics, radiography, magnetic resonance imaging
the physics of sound generation by mechanical aerodynamic whistles has been described in the literature (3); however, the anatomical mechanism underlying human whistling remains obscure. One of the first descriptions of the physics of sound generation during hole-tone whistling was by Lord Rayleigh in 1896 (7). In The Theory of Sound, he described how the whistling sound was produced by the disruption of jet flow through a narrow aperture (7). Wilson et al. (8) proposed a model of human whistling that follows the hole-tone mechanism, requiring a resonant cavity and two nonvibrating orifices. In this model, frequency is generated by Helmholtz resonance, whereby resonant frequency is inversely proportional to the square root of the volume of the resonant chamber. Frequency also increases as orifice area increases and decreases with increasing orifice tube length. The resulting sound is produced within a limited range of jet flow velocities at the orifice, and the frequency range is proportional to the minimum and maximum operating velocities.
Whistled languages have sparked anthropological interest in the acoustic and anatomical mechanisms underlying whistling and how they facilitate communication across long distances (4). The frequencies generated by whistling (2–4 kHz) are resistant to degradation and can be intelligible at a distance 10 times greater than shouted speech (6). Busnel (2) described videofluoroscopic images of spoken and whistled phrases in a Turkish language; the observed changes in vocal tract configuration support the model of an oral resonant cavity with changes in frequency modulated by the anteroposterior movement of the tongue.
The current study examined how anatomical changes within the vocal tract may correspond to the production of distinct frequencies during different whistling tasks. Real-time radiography (videofluoroscopy) provided a dynamic measure of kinematic changes in the oral cavity, pharynx, and larynx during whistling. Additionally, static MRI provided three-dimensional (3D) reconstructions of the vocal tract. We hypothesized that the changes in the size of the oral cavity would correlate with the frequency produced during whistling and that this relationship will follow a Helmholtz resonator model, in which increasing volume of the oral cavity will be associated with a decrease in whistle frequency.
METHODS
Participants.
This study included two subjects with considerable whistling experience: a 38-yr-old Caucasian male (subject 1) and a 28-yr-old Asian female (subject 2). Subjects presented with healthy voices and oral examinations, and they had no history of major medical illness or head and neck surgery. The Institutional Review Board of Johns Hopkins University approved the study, and each subject provided written informed consent to participate.
Radiographic data collection.
Videofluoroscopic (VF) data were acquired at 30 frames per second in both lateral and sagittal planes. Video output was viewed on a monitor in real time and exported to an image-processing system (BR-S610U, JVC America, Fairfield, NJ) for archival and digitization. The field of view included the oral cavity, pharynx, laryngeal vestibule, subglottal air column, and upper esophagus (including the upper esophageal sphincter). A simultaneously recorded time code facilitated frame-by-frame data analysis. For the purpose of scaling, a calibration grid of 1-inch squares was recorded with VF before positioning each subject. The grid was perpendicular to the X-ray beam at the midsagittal plane of the subject in the lateral view. Throughout the study, the position of the image intensifier in relation to the X-ray tube and the magnification mode of the fluoroscope remained fixed.
Subjects sat in the lateral projection while performing three whistling tasks during VF. Pudding barium contrast was ingested before each recording to create a radiopaque lining of the lips, oral cavity, and pharynx. First, subjects whistled ascending and descending scales. In the second trial, they whistled ascending and descending continuous glissandos (sweeps). Finally, they whistled the opening melody of “Jesu, Joy of Man’s Desiring” by Johann Sebastian Bach (see Fig. 2).
Fig. 2.
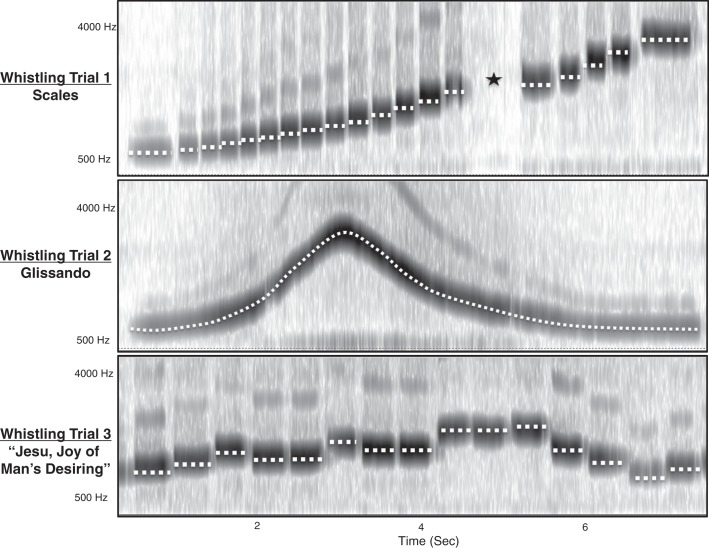
Samples of audio spectrogram and pitch analysis output from Praat software for each of the three whistling task trials. The white dotted lines represent fundamental frequencies. The black star marks a period of inhalation.
Magnetic resonance imaging data.
Three-dimensional images were acquired using a 3-tesla Prisma MR scanner (Siemens, Erlangen, Germany) and a Siemens 64-channel combined head and neck coil. For the anatomical registration, a high-resolution T1-weighted two-dimensional FLASH sequence was used (parameters: TR/TE = 200 ms/2.46 ms, flip-angle = 70°, iPat = 2, FOV 230 × 230, in-plane resolution of 0.8 × 0.8). Altogether, 25 sagittal slices of 4-mm thickness, with a distance factor of 30% covering the full oral cavity, were collected over 30 s. Three-tone frequencies from across the human whistling frequency range (musical notes C5, C6, and C7 with frequencies of 523, 1,046, and 2,093 Hz, respectively) were played on a synthetic keyboard and then whistled at about that frequency (adjusted by ear); the corresponding vocal tract positions were held throughout volume acquisition. The resulting anatomical images were manually segmented using Osirix (http://www.osirix-viewer.com), and the volume of the oral cavity between the tongue and palate was calculated.
Analysis of dynamic data.
Each VF trial was cropped to a single video file. Frame-by-frame analysis was conducted with ImageJ (5). Cartesian coordinates were obtained for the upper and lower incisors, the apex of the distal cusp of the upper second molar, and the anterosuperior margin of the ossified hyoid image.
Coordinates were corrected for head movement during VF recording (Microsoft Excel, Microsoft, Redmond, WA). The x-axis was defined by the line between the upper incisor and upper molar reference points (see Fig. 1). This line approximates the occlusal plane of the upper dentition. The tongue tip (C) to incisor (A) distance (TID) was measured as a linear surrogate of the volume of the oral cavity (resonant chamber size). The interincisor distance (distance between A and D) was used as an estimate of jaw opening. The distance between the superior incisor and the antero-inferior border of the hyoid body were used as a proxy for changes in the lower vocal tract.
Fig. 1.
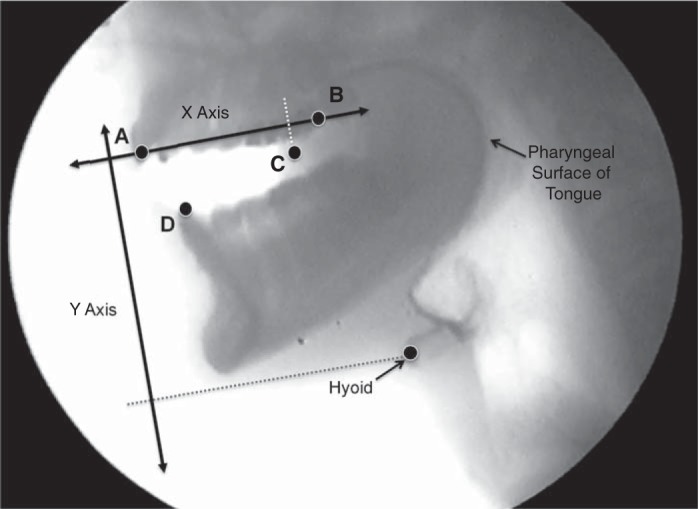
Cartesian coordinates of anatomical landmarks obtained for analysis. A: upper incisor. B: second molar. C: anterior edge of tongue. D: lower incisor, and the hyoid as labeled. The x-axis was used as reference to correct for head movements.
Audio was extracted from the digitized videos with Final Cut Pro X Software 20.2.2 Apple, Cupertino, CA). Spectral and pitch analysis of audio was performed with Praat software (version 6.0.09; Amsterdam, The Netherlands) (1). The fundamental frequency of each note was extracted and matched by the time point to the structural movements. Because these notes were nearly pure tones, with very weak harmonics, this variable is termed “frequency”. During the glissando whistling trials, frequency was recorded in 0.25-s intervals and was synchronized to the corresponding coordinates (Fig. 2).
Finally, to quantify the relationship between oral cavity area and whistle frequency, we used the lateral radiographs of one subject (the male) whistling a scale of two octaves from C5 to C7. One still radiograph was extracted for each whistled note. To get the corresponding areas of the oral cavity, the oral cavity in each of these images was then manually outlined using Bezier curves in Adobe Illustrator. These pixel-based oral areas were than saved as black-and-white images for further analysis. Pixel areas were subsequently scaled to centimeters, based on the reference X-ray with a 1 inch × 1 inch metal grid and half inch metal ball held between the teeth of the subject, using the “set scale” function in Fiji (https://fiji.sc/, image processing package for scientific image analysis), and all areas were exported to a CSV file for further analysis.
Statistics.
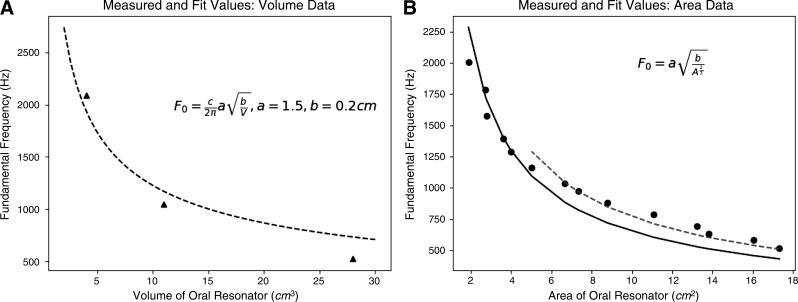
To gain quantitative insights into our data, the relationship between whistle frequency and both oral cavity volume (from MRI data), oral cavity area, and tongue to incisor distance (from lateral radiographs) was analyzed. We fit models of the appropriate form to both our volume (MRI) data and the area (X-ray) data, using the “curve_fit” routine in the optimization toolbox of SciPy (custom code written in Python v 2.7.11, https://www.python.org). This function uses least-squares minimization to provide an optimal fit of model free parameters to the data. A Helmholtz resonator model involves four free variables (three shape parameters: orifice area, tube length, and cavity volume V, plus the speed of sound c). Because we had only three data points for the volume analysis, we input c as 350 m/s (approximating the speed of sound in warm humid air) for the volume analysis, yielding the equation f = 350/(2·pi)·a·sqrt(b/V), with only two free parameters to be fit (a and b). For the area fit, although we had 14 data points matching area A with frequency, a dimensional transformation was required of the appropriate form to convert area to volume (raising area to the 3/2 power, equivalent to taking the square root and then cubing this value), yielding the model f = a* sqrt[b/power(A, 3/2.0)], again fitting two free parameters. Attempting to fit all three free parameters (c, L, and orifice area) led to numerical instabilities and erratic results.
Remaining analyses were qualitative in nature.
RESULTS
Oral cavity.
The oral cavity acted as a resonant chamber with anterior (pursed lips) and posterior (dorsal tongue approximating the hard palate) orifices during whistling. During normal low-frequency whistling, exhaled air flowed through the posterior orifice to excite this resonant chamber.
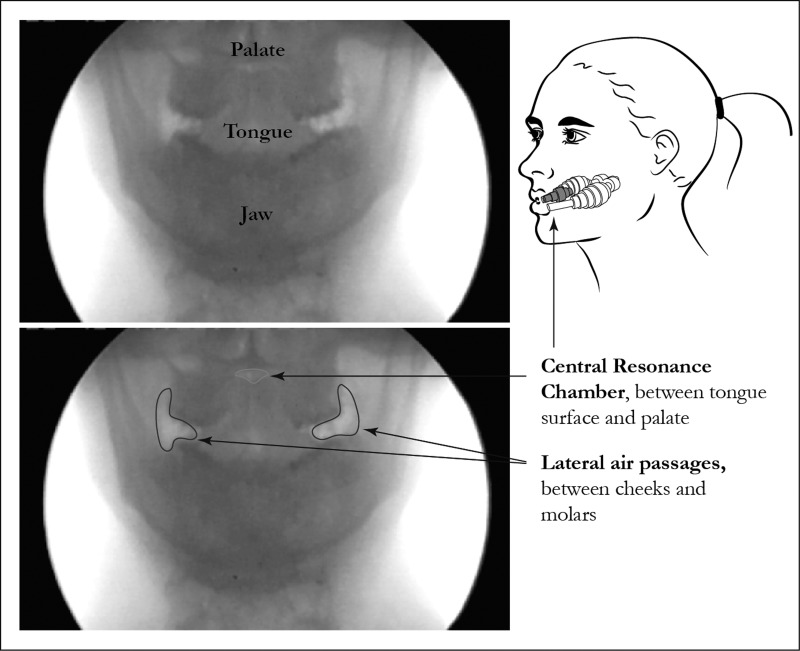
During the production of the highest-frequency notes, both subjects formed buccal space chambers by puffing out the cheeks away from the teeth (Fig. 3). During these highest-frequency whistles, the Helmholtz resonator appears to potentially include these spaces, as the volume between the tongue tip and incisors becomes too small (see Fig. 4B).
Fig. 3.
Lateral air passages are used to generate high-frequency whistles. Bottom: the buccal space chambers are outlined, while the central oral resonance chamber is identified in top.
Fig. 4.
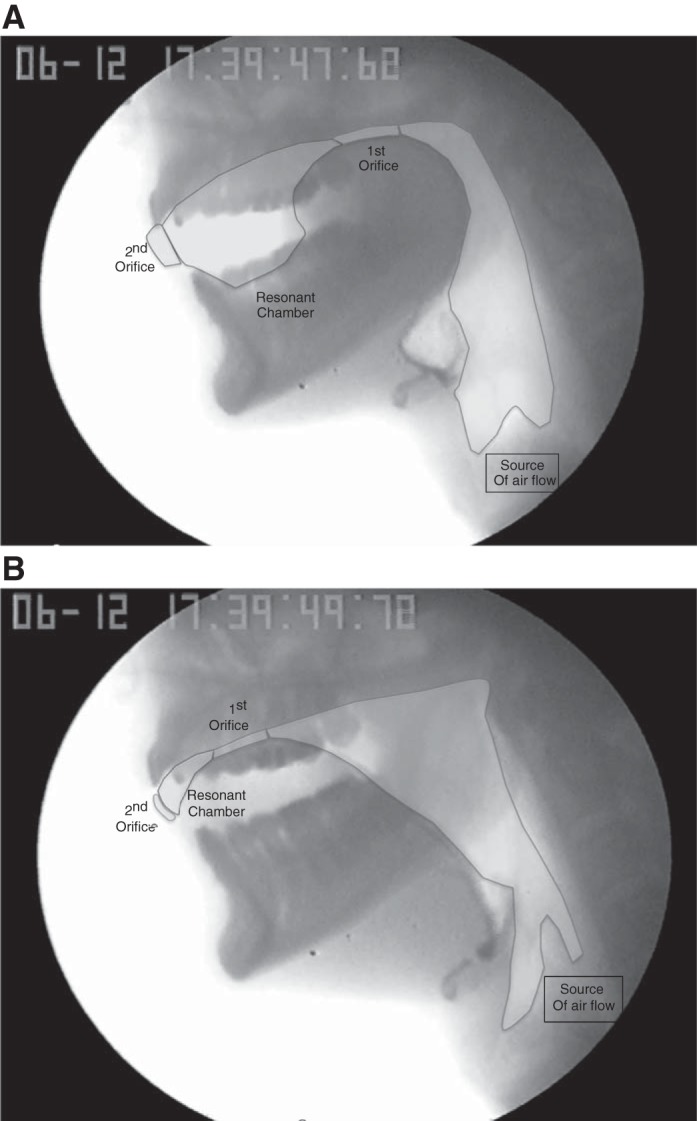
A: conformation of a low-frequency, approximately 500-Hz tone. B: still radiographic image of subject 1 whistling a high-frequency, ~2,500-Hz tone.
This additional “lateral” whistling configuration for high-frequency whistles may not be practiced by all whistlers. Both of our subjects (who considered themselves well-practiced whistlers) independently discovered it for themselves and were not formally taught this mode.
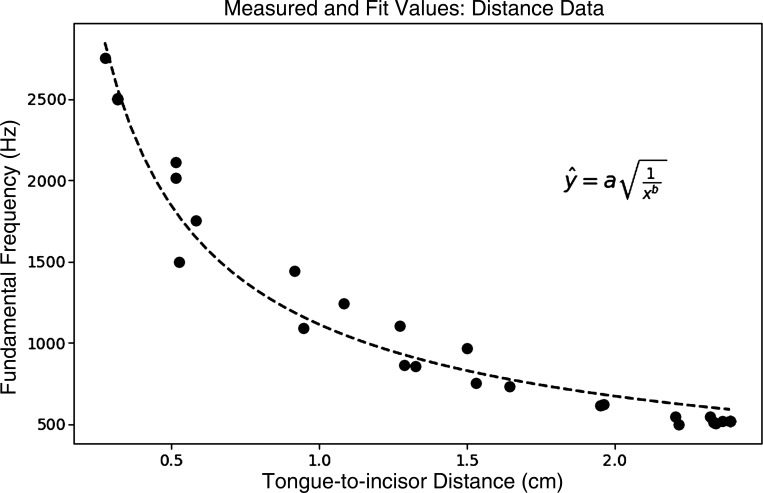
Observationally, the distance between the anterior tongue tip and the incisors increased as the recorded frequency decreased in both subjects during all whistling trials. The TID is a surrogate of the resonant chamber size, and smaller distance corresponds to smaller chamber volumes, and, thus, higher frequencies (see Fig. 5).
Fig. 5.
Relationship between tongue-incisor distance and whistle frequency for subject 1 during whistling trial 2. The variable a is a constant that is proportional to speed of sound, and b is the exponent that would convert a length to the volume in a Helmholtz resonator. The fitted values for these variables are a = 1113 and b = 1.45.
Statistical analysis of the interincisor distance (jaw opening) as a predictor of frequency did not yield consistent results between the two subjects. In subject 1, the r2 values ranged from 0.0027 to 0.16, and there was no defined relationship between variables. However, in subject 2, there was a stronger relationship with r2 values of 0.65 and 0.79.
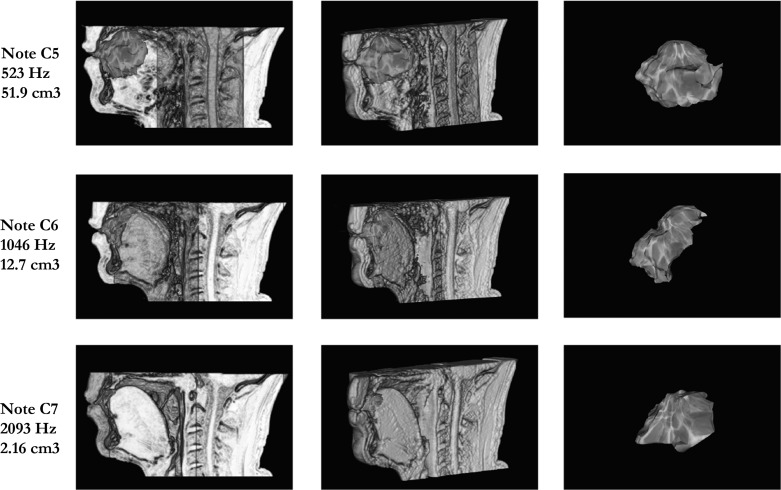
Using manually segmented MRI images, we calculated approximate resonance chamber volume for each note (see Fig. 6). The calculated volumes were ~52 cm3 for the lowest note (C5, 523 Hz), ~13 cm3 for the intermediate note (C6, 1,046 Hz), and ~2 cm3 for the highest note (C7, 2,093 Hz). These values are approximate due to the blurring of the border between tissues and air typical of MRI.
Fig. 6.
MRI images of the oral resonance chamber for three different whistle frequencies. For each frequency (see row labels), the left panel shows a midsagittal view, with the oral cavity outlined, the middle panel shows the three-dimensional reconstruction of the resonance chamber shown in situ, and the right panel shows the oral resonance chamber volume extracted. In all images, the air-filled oral resonance chamber is indicated by a marbled dark-gray shading and body tissues in shades of brown.
To gain more quantitative insights into our data, we fit models of the appropriate form to both our volume (MRI) data and the area (X-ray) data. The precise equations used as models for these two analyses, and the fitted parameter values obtained, are given in Fig. 7 (see methods for explanation). The results of these analyses are shown in Fig. 7.
Fig. 7.
Volume (A) and area (B) data with fit to Helmholtz model. A: empirical fit (dashed line) to our three MRI-derived volumes and the corresponding whistled frequencies (approximate values). B: two empirical fits, using the two-parameter version of a Helmholtz model, shown in inset. The solid curve represents the fit to all data points, while the dashed line shows a fit to only whistles produced by the low-frequency mode, which is clearly different, indicating that fitted parameters (orifice area and/or tube length) vary between the two modes.
Figure 7A shows the results for the volume data from the MRI, which fit the requirements of the Helmholtz equation best, but for which we have only three data points. These show a reasonable but imperfect fit between theoretical predictions and our measurements. This point is clearer and more convincing with the area data (Fig. 7B), where we had 14 area/frequency pairs. When all points from the full frequency range are fit (shown in black), the resulting model fit is poor in the low range; but if only the low-frequency values (made without the lateral channel configuration) are analyzed, the fit is much better (shown in red).
This analysis suggests that one or more of the key parameters of the Helmholtz equation (e.g., lip orifice area or lip tube length) are changed in the transition between low- and high-frequency whistles. Informally, it does appear that lip area decreases during higher whistles, but we have no data documenting this during X-ray or MRI data acquisition.
Pharynx.
The velopharyngeal isthmus appeared closed during whistling, except during inhalations, and, thus, played little, if any, role in whistling generation. In contrast, changes in the oropharynx were prominent and were associated with the anteroposterior changes in tongue position. As the tongue moved anteriorly during generation of higher frequencies, the space between the base of the tongue and posterior pharyngeal wall increased. As frequency decreased and the tongue moved posteriorly, the volume of the oropharyngeal space decreased.
During the generation of low frequencies, the volume of the hypopharynx appeared to increase secondary to the superior excursion of the hyoid and larynx. As the frequency increased, the hyoid and larynx moved inferiorly, and the epiglottic petiole and arytenoids approximated.
DISCUSSION
Our findings are consistent with previous theories of the acoustic and anatomical mechanisms of human whistling. The relationship between anterior tongue position and frequency supports the theory that the oral cavity acts as a Helmholtz resonator. Although the volume of the oral cavity chamber may be influenced by a myriad of factors, the TID seems to play the main role, as evidenced by the strong relationship between TID and frequency. The shift in relationship between frequency and TID during high and low frequency can be attributed to the effect the TID on the total volume of the chamber. When the chamber is smaller, increases on the TID have a greater impact on the total volume; hence, a greater change in the frequency produced is observed. Once the chamber becomes larger, the changes in TID have a lesser effect on total volume of the chamber and, thus, on the changes to the frequency generated. Jaw opening may also modulate resonant chamber size with variable effects across subjects. The pharynx and larynx may also modify the velocity of the air jet that enters the first orifice created by the dorsal tongue and palate to alter the acoustics of generated sound. Further studies of additional human whistling components (i.e., jet flow, orifice size, and thickness) and their contribution to generated frequencies are needed.
Our volume and area analyses suggest that additional key parameters of the Helmholtz equation (e.g., lip opening area or lip tube length) are changed in the transition between low and high-frequency whistling. Observationally, the lip area decreases during higher whistles, but we have no data documenting this during X-ray or MRI data acquisition. Understanding these issues would require high-resolution measurements of these parameters and would be an excellent topic for future research.
Our observations support Busnel’s argument (2) that the physiological mechanisms of speech and whistling output are similar. Given that this study involved purely musical output, and was not meaningful “whistled language,” these results broaden the scope of Busnel’s observation to include bilabial whistling. Unlike singing, which relies primarily on control of vocal fold length and laryngeal tension, the frequency of whistling depends on controlled movements of the lips, jaw, and tongue. These mechanisms are similar to manipulation of the vocal tract to produce formant frequencies in speech.
Conclusions.
The results of this study indicate that the acoustic mechanism in human pursed lip whistling follows a Helmholtz resonator model; the oral cavity acts as the resonant chamber and the anteroposterior movements of the tongue play a major role in changing the volume and, thus, the whistle frequency produced. Further studies performed with high-resolution measurements may help elucidate the contribution of changes to other parameters of the Helmholtz equation.
GRANTS
This study was supported by National Institute of Child Health and Human Development Grant 5 T32HD007414-22 to A. M. Azola.
DISCLOSURES
No conflicts of interest, financial or otherwise, are declared by the authors.
AUTHOR CONTRIBUTIONS
J.P. and W.T.F. conceived and designed research; A.M.A., R.M., R.H., F.F., and W.T.F. analyzed data; A.M.A., J.P., R.H., and W.T.F. interpreted results of experiments; A.M.A., R.H., F.F., and W.T.F. prepared figures; A.M.A., J.P., R.M., and W.T.F. drafted manuscript; A.M.A., J.P., R.M., R.H., F.F., and W.T.F. edited and revised manuscript; A.M.A., J.P., R.M., R.H., F.F., and W.T.F. approved final version of manuscript; J.P. and W.T.F. conceived and designed research; J.P., R.H., and W.T.F. performed experiments.
REFERENCES
- 1.Boersma P, Weenink D. Praat: Doing Phonetics By Computer [Computer program]. Version 6.0.22, accessed 15 November 2016 from http://www.praat.org/, 2016.
- 2.Busnel RG. Etude Radiocinémathographique d’un Riffleur Turc de Kusköy. Paris: SFRS; http://www.canal-u.tv/video/cerimes/etude_radiocinematographique_d_un_siffleur_turc_de_kuskoy.13056, 1968. [Google Scholar]
- 3.Henrywood RH, Agarwal A. The aeroacoustics of a steam kettle. Phys Fluids 25: 107101, 2013. doi: 10.1063/1.4821782. [DOI] [Google Scholar]
- 4.Meyer J. Whistle production and physics of the signal. In: Whistled Languages. Berlin, Germany: Springer, 2015, p. 74–77. [Google Scholar]
- 5.Rasband WS. ImageJ. Bethesda, MD: National Institutes of Health, https://imagej.nih.gov/ij/, 1997–2016. [Google Scholar]
- 6.Shadle CH. Experiments on the acoustics of whistling. Phys Teach 21: 148–154, 1983. doi: 10.1119/1.2341241. [DOI] [Google Scholar]
- 7.Strutt JW. The Theory of Sound (2nd ed). New York: Macmillan, 1896, vol. 2. [Google Scholar]
- 8.Wilson TA, Beavers GS, DeCoster MA, Holger DK, Regenfuss MD. Experiments on the fluid mechanics of whistling. J Acoust Soc Am 1, 50: 366–372, 1971. doi: 10.1121/1.1912641. [DOI] [Google Scholar]


