Abstract
Spiral waves propagating in Saturn's rings have wavelengths that vary with radial position within the disc. The best-quality observations of these waves have the form of radial profiles centred on a particular azimuth. In that context, the wavelength of a given spiral wave is seen to change substantially with position along the one-dimensional profile. In this paper, we review the use of Morlet wavelet analysis to understand these waves. When signal to noise is high and the cause of the wave is well understood, wavelet analysis has been used to solve for wave parameters that are diagnostic of local disc properties. Waves that are not readily perceptible in the spatial domain signal can be clearly identified. Furthermore, filtering in wavelet space, followed by the reverse wavelet transform, has been used to isolate the part of the signal that is of interest. When the cause of the wave is not known, comparing the phases of the complex-valued wavelet transforms from many profiles has been used to determine wave parameters that cannot be determined from any single profile. When signal to noise is low, co-adding wavelet transforms while manipulating the phase has been used to boost a wave's signal above detection limits.
This article is part of the theme issue ‘Redundancy rules: the continuous wavelet transform comes of age’.
Keywords: planetary rings, Saturn system, wavelet transform
1. Introduction
Saturn's ring system is a disc characterized by a wide array of structures over a wide array of length scales. A prominent form of structure in some parts of the rings are spiral waves, which follow the same basic physical processes that give rise to spiral arms of galaxies [1–3], but which are much more tightly wound due to the much higher mass ratio between the central mass (i.e. Saturn) and the disc [3].
Spiral density waves (SDWs) and spiral bending waves (SBWs) are, respectively, caused by in-plane and vertical perturbations of ring particle orbits by periodic forcing. Most commonly, the forcing is due to one of the moons of Saturn, though some spiral waves have been linked to mass anomalies within the planet Saturn [4–6]. Spiral waves occur at locations in the rings where the forcing frequency is in resonance with the orbital frequency of ring particles. The wave propagates away from the resonance in one direction, with a wavelength that decreases downstream. Some aspects of the linear theory of SDWs are reviewed in §2.
The variation of the spatial frequency with location makes it difficult to analyse spiral waves with classical Fourier analysis. Other phenomena in Saturn's rings, such as ‘moonlet wakes’ [7], also have spatial frequencies that vary with location. Horn and co-workers [8,9] employed a somewhat ad hoc form of localized Fourier analysis to interrogate these structures, an approach that culminated in the most comprehensive pre-Cassini survey of spiral waves in Saturn's rings [10].
Tiscareno et al. [11] were the first to approach this problem using Morlet wavelet analysis [12–15] as an optimized method of ‘localized Fourier analysis’, able to pinpoint the dominant wavelength(s) at a given location and the locations at which a given wavelength predominates. We review some aspects of wavelet theory, as we used it, in §3, and we outline the method of Tiscareno et al. [11] for analysing an SDW with wavelet analysis in §4a.
The work [11] was an analysis of images from the Cassini ISS camera [16], which we reduced to radial profiles by summing pixels in the azimuthal direction. We used filtering of the wavelet power spectrum, followed by a reverse wavelet transform, to isolate distinct waves in the frequency dimension, even when they overlap in the spatial dimension. Furthermore, we used the wavelet phase to trace the linear increase in the spatial wavenumber of well-sampled waves, which proved the key to fitting such waves to a five-parameter theory that yields information regarding the local ring surface mass density, the local ring viscosity, the precise resonance location, and the longitude and mass of the perturbing moon (or other forcing mass) [11]. The results of this work, along with those of some follow-up papers [17,18] are described in §§4b through 4d.
Stellar occultations, in which a star's brightness is repeatedly measured as it passes behind the rings, were observed in substantial numbers by the Cassini Ultraviolet Imaging Spectrograph (UVIS), and Visual and Infrared Mapping Spectrometer (VIMS) instruments [19,20]. Each occultation provides a one-dimensional cut across the ring, rather than a two-dimensional image. This makes it more difficult within an individual occultation observation to distinguish radial ring structure from stochastic optical depth variations. Furthermore, the radial sampling frequency changes depends on the occultation geometry and can vary over the course of a single observation depending on the path the star appears to take behind the rings. However, occultations typically have much finer spatial resolution than images, and their spatial geometry is much more tightly controlled, enabling data from multiple occultations to be combined in very productive ways.
Several analyses of UVIS occultations [21,22] employed a ‘weighted wavelet Z’ (WWZ) transform [23] to co-add multiple occultations together, despite differences in their sampling and in their signal to noise in order to reveal several weak wave signatures. This work and its results are discussed in §5. Further advances were achieved by Hedman & Nicholson [4,5] and French et al. [6], who used the phase information encoded in the real and imaginary parts of the wavelet transform to ascertain the number of arms and rotation rates of spiral patterns whose origins were not clear. That group also developed a method that used wavelet phase information when combining data from multiple occultations to isolate signals from specific waves that would otherwise would be lost among the noise in each profile [24]. This work and its results are discussed in §6.
2. Theory of spiral density and spiral bending waves
The linear theory of spiral waves in discs has been described in several classic publications (for review, see [25]). At the location of a Lindblad resonance,1 the forcing frequency forms a simple ratio with the radial (epicyclic) frequency of ring particle orbits, amplifying their eccentricity. The coherent excitation of ring particles gives rise to compression and rarefaction, initiating a SDW that propagates through the disc.
The density wave can be described as a density variation Δσ on the background surface density σ0. At orbital radius r greater than the resonance location rL, we have
| 2.1 |
where the dimensionless radial parameter is
 |
2.2 |
and further terms are defined below.
Assuming Saturn's gravity is well described as a point mass plus a J2 harmonic, the factor  is given in [26,27]
 |
2.3 |
where the second term is a small correction except for m = 1.
The Lindblad resonance occurs at rL. The local mean motion is nL, which must be calculated accounting for the higher order moments of Saturn's gravity field [28]. Saturn's radius rS = 60 330 km by convention [29]. The resonance's azimuthal parameter is m, an integer that is positive when the perturbing moon orbits outside the rings, but can be negative for resonances involving the planet. In either case, |m| is equal to the number of spiral arms. The amplitude AL is related to the mass of the perturbing satellite, while the damping constant ξD describes the ring's viscous response (see §2c).
(a). Initial phase
For a given longitude on the rings, λ, the initial phase of a density wave generated by an exterior satellite is given by
| 2.4 |
where λs and ϖs are the mean longitude and longitude of periapse of the perturbing satellite. The integers m and  describe the resonance—a (
 +1)th-order Lindblad resonance is commonly labelled (m+
 ):(m − 1). A third integer p describes resonances linked to the perturbing satellite's inclination, but no such resonances are discussed in this paper.
The above expression can be generalized to cases when the wave is generated by a resonance with a structure inside the planet. In those situations, a more useful expression for the initial wave phase is
| 2.5 |
where Ωp is the rotation rate of the planetary structure and ϕ00 is the orientation of this structure at the epoch time t = 0.
(b). Local wavenumber and phase
The integral in equation (2.1) is a Fresnel integral, which significantly modulates the result near the wave's generation point, but oscillates about unity for higher values of ξ. Downstream, then, the dominant component of equation (2.1) has the form of a sinusoid with constantly decreasing wavelength (as well as modulating amplitude), such that the wavenumber, k = 2π/λ, increases linearly with distance from rL [3]:
| 2.6 |
Since the wavenumber increases linearly with r, the accumulating phase naturally increases quadratically. Indeed, making use of  , the instantaneous phase of the sinusoid far from ξ = 0 (i. e. r = rL), as a function of radial location ξ(r), asymptotically approaches [3]
| 2.7 |
It is important to note the term of π/4 (or 45°) added to this quantity. This asymptotic limit is a good approximation only for ξ ≳ 1 [30].
(c). Ring viscosity and vertical scale height
When the damping constant ξD≫1 (i.e. when damping is inefficient enough to allow at least several wavecycles), the local ring kinematic viscosity ν can be estimated as [3,31]
 |
2.8 |
where, for this purpose, the radial frequency κL is approximately equal to the orbital frequency ΩL.
The viscosity ν is directly related to the rms random velocity c [32]
 |
2.9 |
where τ is the local optical depth. Equation (2.9) assumes that ring particle interactions are isolated two-particle collisions; it is not valid when the ring particle density is high enough that particle size becomes important [33]. This assumption is probably valid for the A Ring.
Under the assumption that random velocities are isotropic, the ring's vertical scale height can be estimated as H∼c/Ω. However, this assumption is violated in much of the A Ring.
(d). Summary
The density wave equation (equation (2.1)) contains five parameters that may vary from wave to wave (not counting the azimuthal parameter m, which is fixed by the identity of the resonance), and which are sensitive to physical quantities concerning the ring or the perturbing moon.
(i) The background surface density of the ring, σ0, governs the rate at which the wavenumber increases with distance from resonance.
(ii) The resonance location, rL, fixes the wave against translation in the radial direction.
(iii) The initial phase, ϕ0, is fixed by the moon's orbital phase relative to the location at which the wave is observed.
(iv) The damping parameter, ξD, governs the location at which the wave's amplitude ceases to grow and begins to decay; it is sensitive to the dynamical viscosity of the ring.
(v) The amplitude, AL, governs the overall strength of the perturbation (irrespective of its shape); it is sensitive to the mass of the perturbing moon.
3. Wavelet theory
Here we review the properties of the continuous wavelet transform (CWT), emphasizing aspects that are relevant to our purposes. For more detailed information on the wavelet transform and its applications, see [15] and references therein.
(a). The Morlet wavelet
The mother wavelet governs the way in which the wavelet transform transfers spatial information into the frequency domain. The mother wavelet we use is the Morlet wavelet, which is optimally suited for identifying oscillatory components of a signal.
A wavelet transform using the Morlet mother wavelet can be thought of as a localized Fourier transform. As with standard Fourier analysis, components of the input signal are separated in the frequency domain, but wavelet analysis additionally pinpoints the locations in the signal at which a given frequency is important. This is particularly useful when the signal's dominant frequency changes with location (as it does in a density wave propagating through a disc). The advantage of wavelet analysis over other time-frequency methods (such as the windowed Fourier transform) lies in the automatic scaling of the window along with the interrogating waveform, yielding optimal simultaneous detection of both high- and low-frequency signal components.
The Morlet wavelet is simply a complex sinusoid within a Gaussian envelope:
 |
3.1 |
The wavelet's central frequency, ω0, is selected beforehand by the user (see §3c).
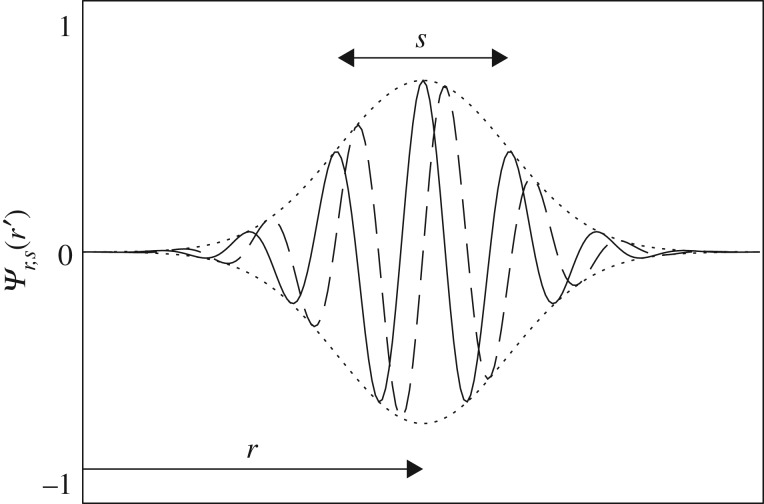
Wavelet analysis is carried out by translating and dilating the mother wavelet (figure 1), and convolving these daughter wavelets with the input signal (see equations (3.4) and (3.5)). At a given location r and spatial scale s, the daughter wavelet is given by [15]
 |
3.2 |
and the daughter of the Fourier-transformed mother wavelet is given by
 |
3.3 |
Figure 1.
The Morlet wavelet with ω0 = 6. The solid line shows the real part, the dashed line the imaginary part. For ease of viewing, the Gaussian envelope within which the wavelet oscillates is shown as a dotted line. The wavelet translates and dilates in order to interrogate the signal at all scales (s) and locations (r). Figure from Tiscareno et al. [11].
(b). The wavelet transform
For an evenly sampled radial signal, x(r), the CWT is given in [14,15]
| 3.4 |
where* denotes the complex conjugate. In practice, the wavelet transform is more efficiently calculated in terms of the product of the Fourier transforms
| 3.5 |
For more discussion, see [13,14], the latter of whose software2 we use for this purpose.
(c). Choosing the central frequency
Wavelet analysis follows a form of the Heisenberg uncertainty principle, in that an increase in spatial resolution comes only at the cost of decreased frequency resolution and vice versa [15]. Classical Fourier analysis can be seen as an end-member in this trade-off, providing the optimum possible frequency resolution, but at the cost of having no spatial resolution at all. For the Morlet wavelet, this trade-off is governed by the central frequency ω0 in equations (3.1)–(3.3). Higher values of ω0 cause the Gaussian envelope to contain more oscillations of the sinusoid, and consequently yield higher spectral resolution at the expense of lower spatial resolution (e.g. figure 13). In this paper, unless otherwise specified, we use a value of ω0 = 6 (although there is nothing intrinsically special about any particular value of ω0, which need not even be an integer). A typical Morlet wavelet can be seen in figure 1.
Figure 13.
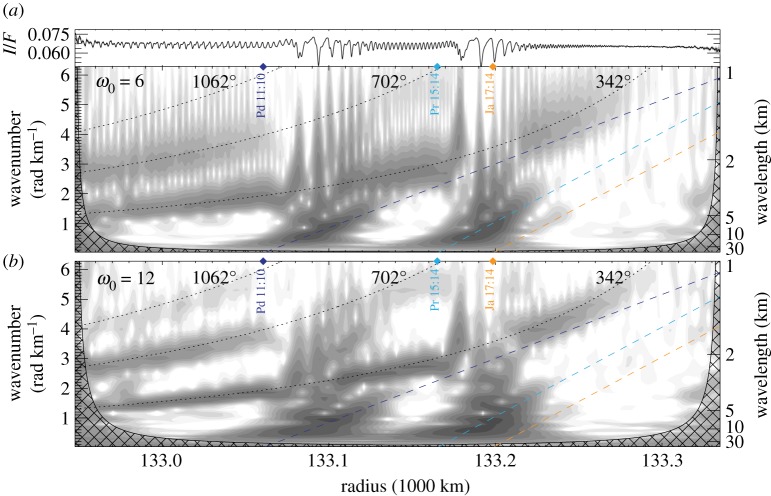
Radial scan and two wavelet transforms from Cassini image N1467346329 (figure 12), showing wakes excited by Pan along with several density waves. (a) The wavelet plot, like all others in this paper, uses a central frequency ω0 = 6; (b) uses ω0 = 12, resulting in increased resolution in the spectral (y)-dimension at the expense of smearing in the radial (x)-dimension (see §3c). Density waves are clearer in (a), including the strong Pandora 11:10 and Prometheus 15:14 waves, but also the weak third-order Janus 17:14. Dashed lines indicate model density wave traces, assuming a background surface density σ0 = 40 g cm−2. Moonlet wakes excited by Pan are clearer in (b). The three dotted lines denote the frequency profiles [7] of wakes that have travelled 342°, 702° or 1062° in synodic longitude since their last encounters with Pan. Figure from Tiscareno et al. [11]. (Online version in colour.)
We should note that the expression for the Morlet wavelet given in equations (3.1) to (3.3) is only valid for ω0 ≳ 5. For smaller central frequencies, one cannot ignore the addition of a real-valued constant to the sinusoid, which is necessary to ensure compliance with the requirement that an admissible wavelet must have zero mean [13,15].
(d). Wavelength and wavenumber
The scale parameter, s, is directly proportional to the more familiar Fourier wavelength, λF. For the Morlet wavelet, this relationship is given in [14]
| 3.6 |
The wavelet plots in this paper are shown with a y-axis that increases linearly with the wavenumber k = 2π/λF (and thus inversely with s), as the trace of a density wave appears linear in that representation (see equation (2.6)).
(e). Inverse wavelet transform
The wavelet transform can be inverted, recovering the input signal to good accuracy. Before inverting, a powerful method of filtering can be implemented by setting undesired elements in the transform array to zero. The inverse wavelet transform can be written [13]
| 3.7 |
The normalization constant is
| 3.8 |
where  is given by equation (3.3) with r = 0 and s = 1. If the original input signal x(r) was real, simply take the real part of equation (3.7).
The constant Cδ is calculated only once for a given mother wavelet (i.e. in the case of the Morlet, for a given value of ω0). The discretized form of Torrence & Compo [14] includes a different method of calculating Cδ, which we will not restate here. Using their method, we find empirically for ω0≥6,
| 3.9 |
with the uncertainty in the last decimal place. This result allows the inverse wavelet transform to be calculated with software in [14], even when ω0≠6.
(f). Wavelet energy and phase
Because our wavelet transform is complex-valued, it can be expressed in terms of two two-dimensional arrays: the wavelet energy spectrum (or ‘scalogram’)
| 3.10 |
and the wavelet phase
| 3.11 |
Most plots of wavelet transforms in this paper will show only the energy scalogram, which gives the relative importance of different frequencies at a given location.
The two-dimensional array of wavelet phases can be more usefully reduced to the average wavelet phase,  , weighted by the modulus, over all scales s at a single location r. For a quasi-sinusoidal signal,
  gives the local proximity to peaks and troughs, even when the sinusoid's wavelength is inconstant (as it is for density waves), and can be compared to a density wave's instantaneous phase (equation (2.7)). As with the filtering method described above, selected values of
  can be set to zero before performing this calculation, in order to isolate a desired component of the signal.
Considering each complex element of  as a vector in the real–imaginary plane,
  can be calculated by finding the average vector, then taking its phase. This is done by separately summing the real and imaginary parts of
  over the desired scales:
| 3.12 |
keeping in mind that  if the real part is less than 0.
(g). Wavelet ridges
It can be useful to plot local maxima in the two-dimensional representation of wavelet information. Wavelet ridges are those locations in the (r, s) plane for which
| 3.13 |
and are useful for pinpointing important scales (and thus frequencies, from equation (3.6)) at a given location r [34].
(h). The cone of influence
The cone of influence (COI) is the region in the wavelet transform within which edge effects may contaminate the signal. The size of the COI varies with the scale s, as a consequence of the dilation of the mother wavelet. It is up to the user to define a COI with which they are comfortable [15]. We follow [14] in using the distance over which the wavelet energy contributed by the edge discontinuity decreases by a factor of e, which is  for the Morlet wavelet.
This form of the COI is, more generally, the interval over which the wavelet signal from any localized feature would be expected to spread. For example, the wavelet transforms of many density waves in this paper show some signal extending to the left of rL, a smearing effect which is the inevitable consequence of the spatial frequency trade-offs discussed in §3c. The reader can use the COI to visualize the expected spatial resolution along any horizontal line in a transform plot.
For a given Fourier wavelength λF, the COI width  is proportional to the denominator in equation (3.6). Thus, the COI is broader for higher values of ω0 (e.g. figure 2).
Figure 2.
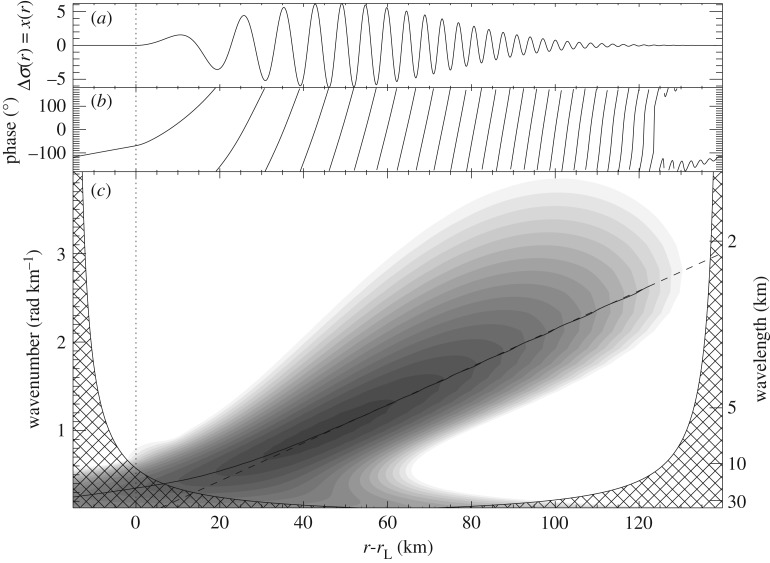
(a) Synthetic density wave radial profile generated by equation (2.1) with the values of table 1, (b) wavelet phase and (c) wavelet energy. As with all wavelet plots in this paper, contours are logarithmic, with three contours to an order of magnitude, and the lowest contour level is at the square of the median error estimate for the scan (here we artificially set σ input = 0.1). The region filled with cross-hatching is the cone of influence. The dashed line is the foreknown wavenumber kDW(r) (equation (2.6)), while the solid line shows the calculated location of a wavelet ridge (equation (3.13)); here, the two diverge visibly only for r − rL < 40 km, corresponding to ξ < 6. Figure from Tiscareno et al. [11].
In all wavelet plots in this paper, the COI is denoted by a region filled with cross-hatching. It is sometimes absent, in cases where the radial scan has been cropped so that true edges are not shown.
(i). Significance levels
When uncertainties in the input signal are characterized by Gaussian white noise (with standard deviation σinput), the normalized wavelet energy EW(r, s)/σ2input is distributed as χ2 with 2 d.f. [14]. For our radial scans, each element is individually calculated as the weighted average of a number of image pixels, and thus possesses a roughly Gaussian error estimate σ input.3 Therefore, in this paper, the lowest level shown in each contour plot corresponds to values of EW(r, s) equal to σ2input. Further contour levels are logarithmic, with three levels per order of magnitude in EW.
4. Application to individual profiles of Cassini ISS images
(a). Wavelet analysis of a synthetic density wave
We here describe a multi-step semi-automated algorithm introduced in [11], using wavelet methods to measure the parameters describing a density wave. To illustrate the utility and limitations of our method, we consider a signal whose characteristics are known beforehand. We use the density wave curve taken from equation (2.1), with parameters set equal to round numbers typical of the mid-A Ring (table 1). We note that these values allow the dimensionless radial parameter to be calculated as ξ = C(r − rL), where C = 0.147 km−1 (equation (2.2)).
Table 1.
| parameter name | symbol | value |
|---|---|---|
| resonance label | m | 10 |
| background surface density | σ0 | 40 g cm−2 |
| resonance location | rL | 130 000 km |
| initial phase | ϕ0 | 0 |
| damping parameter | ξD | 10 |
| amplitude | AL | 1 |
(i). Obtaining the density wave's high-frequency shape.
Figure 2 shows the radial trace of the synthetic density wave, Δσ(r), from equation (2.1) with the values of table 1, along with the phase and energy of its wavelet transform. Note that Δσ(r) as discussed in this section is identical with the generic x(r) discussed in §3. The phase  in figure 2b is 0° at local maxima of Δσ(r), and 180° at local minima, as we would expect. Figure 2c also shows the relationship between the foreknown wavenumber (equation (2.6)) and the wavelet ridge (equation (3.13)). For the first few wavecycles, the ridge is drawn away by non-sinusoidal components in the signal, but farther downstream it agrees with the expected wavenumber. The residual between the two is shown in figure 3b. A linear fit to the portion of the wavelet ridge that is closest to linear can be used to re-obtain the background surface density σ0 and the resonance location rL from equation (2.6); the fitted values are also given in figure 3b, with error estimates taken from the linear regression.
Figure 3.
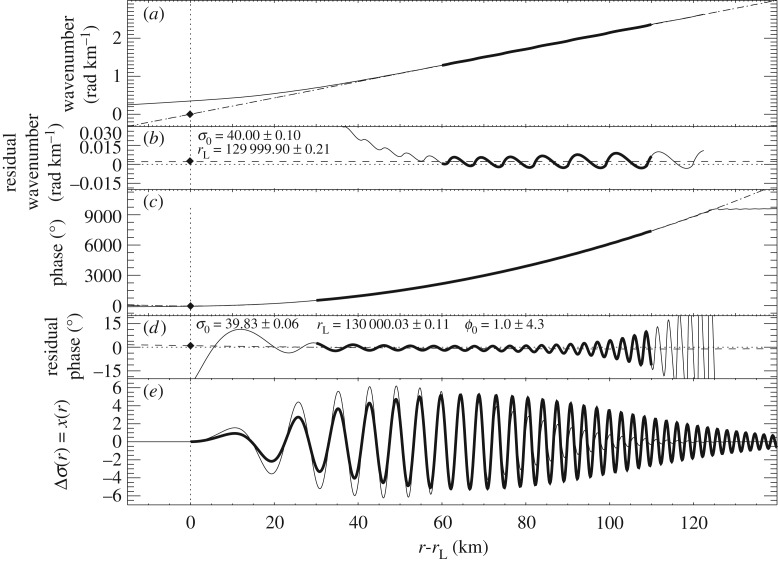
(a) Calculated wavelet ridge (§3g), as in figure 2c (solid line); the expected wavenumber kDW(r) (dotted line). The region of the wavelet ridge plotted in bold was used in a linear fit (dashed line); the y = 0 point is plotted as a solid diamond. (b) All three curves from figure 3a, shown as residuals with the expected wavenumber kDW(r). (c) Calculated wavelet phase  , as in figure 2b, ‘unwrapped’ to show how phase accumulates quadratically (solid line); the expected phase ϕDW(r) (dotted line). The region of
  shown in bold was used in a quadratic fit (dashed line); the zero-derivative point is plotted as a solid diamond. (d) All three curves from figure 3c, shown as residuals with the expected phase ϕDW(r). (e) The input synthetic density wave from figure 2a (solid line); the fitted density wave, after the analysis of §4a(i), but still with randomly chosen values of ξD and AL (bold solid line). Fitted values given in the figure can be compared with the input parameters (table 1) used to generate the wave. Figure from Tiscareno et al. [11].
Figure 3c shows how the wavelet phase  can be ‘unwrapped’ by adding 360° at every successive ‘wraparound’, to reveal a shape very close to quadratic. The residual between the wavelet phase and the expected phase
  (equation (2.7)) is shown in figure 3d. As with the wavelet ridge, the regions closest to rL do not correspond well to the foreknown values. But the phase reaches stable behaviour much sooner (at much lower values of r − rL) than does the ridge. As in the previous case, the portion that is closest to quadratic can be fit to re-obtain the initial phase ϕ0, the background surface density σ0 and the resonance location rL; the fitted values are also given in figure 3d, with error estimates taken from the linear regression.
We use the quadratic fit to the phase, rather than the linear fit to the wavenumber ridge, not only because it obtains all three parameters at once, but also because more of the curve is available for fitting. In practice, it is important to look at the residuals for each individual fit, and judge those portions of the phase curve deviating from quadratic behaviour, in order to exclude them; only portions that conform to quadratic behaviour should be used in the fit.
When this phase of the analysis is completed, the high-frequency behaviour of the wave has been obtained, but the shape and height of the wave's envelope is still unknown, as illustrated in figure 3e.
(ii). Obtaining the shape of the density wave's envelope.
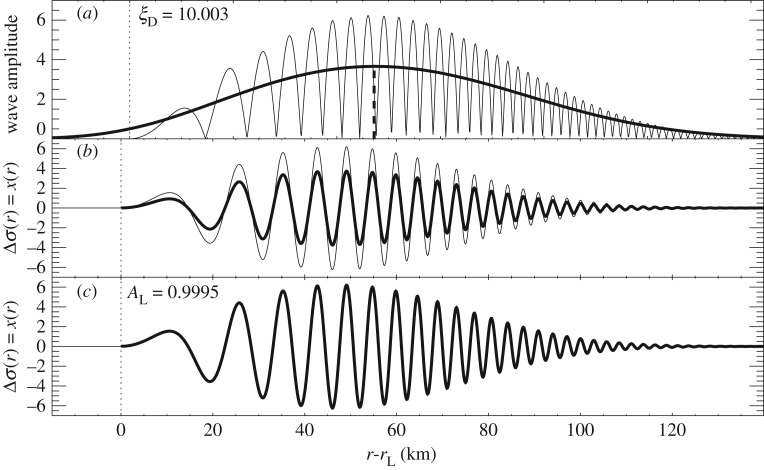
Now that we have determined the three parameters that define the shape of the wave's high-frequency components (σ0, rL and ϕ0), we now accept that shape as given and proceed to fit the two remaining parameters (AL and ξD) that define the wave envelope (i.e. the amplitude and decay of the high-frequency components).
In the absence of other effects, the shape of the amplitude modulation (i.e. the location of the point of maximum amplitude) is governed by the damping parameter ξD. In fact, the non-oscillatory components of equation (2.1) are proportional to ξ e−(ξ/ξD)3. If a reliable representation of the amplitude can be obtained, the best way to fit for ξD is to find the dimensionless radial parameter (equation (2.2)) at which its derivative is zero. Denoting this point as  , we then have
| 4.1 |
Figure 4a shows the result of this calculation, in which we take the absolute value of the input waveform Δσ(r) (after first ensuring that the waveform oscillates about zero) and smooth it three times with a boxcar filter. The boxcar's width should be ≳ 3 times the largest peak-to-peak wavelength in the scan.
Figure 4.
(a) The absolute value of Δσ(r) (solid line); the same curve, smoothed three times with a 22 km boxcar filter, giving the low-frequency shape of the wave envelope (bold solid line); maximum point of the latter (vertical bold dashed line). (b) The input synthetic density wave from figure 2a (solid line); the fitted density wave, after the analysis of §4a(ii), but still with randomly chosen value of AL (bold solid line). (c) The input synthetic density wave from figure 2a (solid line); the final fitted density wave, after the analysis of §4a(iii). Fitted values given in the figure can be compared with the input parameters (table 1) used to generate the wave. Figure from Tiscareno et al. [11].
When this phase of the analysis is completed, only the overall amplitude of the wave remains unknown, as illustrated in figure 4b.
The effects of ξD are observable only in waves that can be described throughout by the linear theory of equation (2.1), and indeed the analysis in this paper is limited to such waves. By contrast, the stronger resonances in Saturn's rings (including nearly all of the waves observed by Voyager) quickly become nonlinear—that is, the oscillations Δσ become comparable to the background surface density σ0, causing the assumptions underlying equation (2.1) to break down [36,37]. Nonlinear density waves are characterized by sharp peaks and flat troughs, though the wavenumber kDW(r) is still fairly well described by linear theory.
Consequently, ξD has sometimes been ignored in previous work. Firstly, Lissauer & Cuzzi [38] discuss and calculate the fractional distance XNL at which a density wave becomes nonlinear, a calculation which assumes that the amplitude grows linearly with no modulation from the ξD term. Secondly, Rosen et al. [39] entirely ignored the e−(ξ/ξD)3 term in equation (2.1) in their fits of density waves, which they justified by noting that they fit only the first few wavecycles of their waves. It is important to recognize that both of these treatments apply only to strongly nonlinear waves and are too simplistic for the myriad of weaker waves observable with Cassini's higher resolution.
(iii). Obtaining the density wave's amplitude.
Finally, we calculate AL using a Levenburg–Marquardt least-squares fit [40] to compare the density wave's radial trace to the shape defined by σ0, rL, ϕ0 and ξD, obtained using the processes described above. Figure 4c shows the fitted curve overlying the original synthetic wave, with the fitted parameter value also given.
We note that it is possible to obtain AL and ξD simultaneously with the least-squares fit, comparing the density wave's radial trace to the shape defined by only σ0, rL and ϕ0. Although this method yields acceptable results, our analysis of the synthetic wave shows that obtaining ξD independently is superior. Still, the two-parameter least-squares fit is occasionally necessary, such as when the wave is truncated by an image edge or by an unrelated nearby radial structure.
When the amplitude AL is given in terms of the perturbation in surface density, the mass of the perturbing moon can in principle be obtained through appropriate coefficients from the disturbing function [2,39,41]. In practice, however, complexities inherent in the dataset have prevented this measurement from being systematically done with Cassini ISS images [11].
(iv). Fitting the parameters of real density waves.
We apply the method described in this section to the SOI imaging data presented in [11], calculating parameter values for many density waves in the rings. Two modifications of the method are required to allow for the differences between our synthetic wave and the real data.
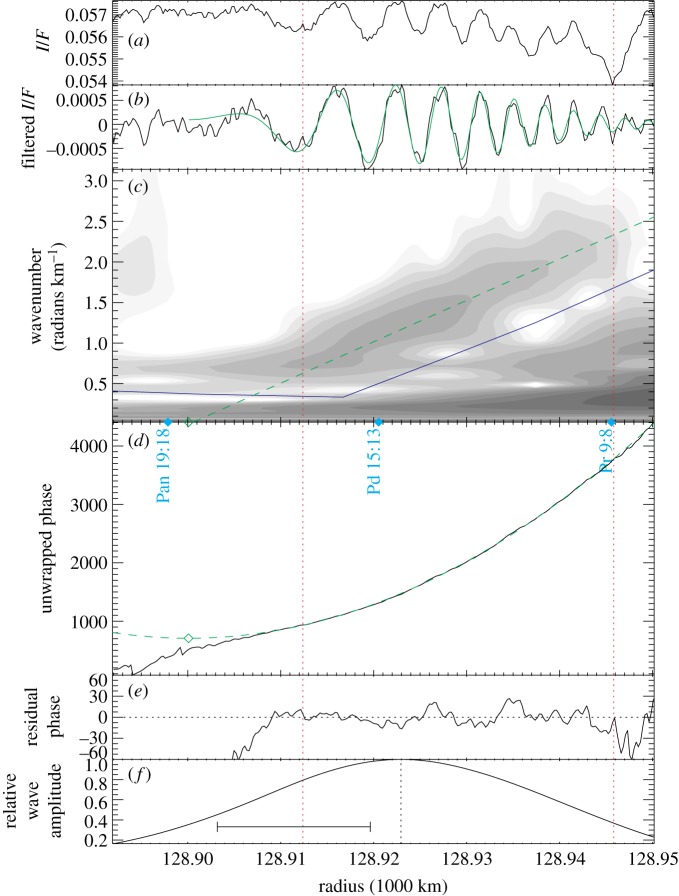
Firstly, we remove low-frequency components of the signal by setting selected elements of  to zero, taking the inverse wavelet transform, and then starting the analysis with this filtered wave. This ensures that waves oscillate about zero (as does equation (2.1)). In most cases, it is easy to draw the dividing line through regions of the wavelet transform with essentially zero energy (e.g. figure 6). More problematic cases are noted in [11]. We do not filter out high-frequency noise, which is difficult to separate quantitatively from the desired signal.
Figure 6.
The density wave fitting process, illustrated using the Pan 19:18 ILR density wave, observed in Cassini image N1467345975. The two red vertical dotted lines indicate the interval used for the quadratic fit. From top to bottom: (a) radial scan, (b) high-pass-filtered radial scan, with the final fitted wave shown in green, and (c) wavelet transform of radial scan, with the blue line indicating the filter boundary, and the green dashed line indicating the fitted wave's wavenumber. (d) Unwrapped wavelet phase, with the green dashed line indicating the quadratic fit and the green open diamond indicating the zero-derivative point. (e) Residual wavelet phase, showing that the interval used for the fit is the interval in which the phase behaves quadratically. (f) Wave amplitude, the local maximum of which (vertical dotted line) gives ξD; scale bar indicates the smoothing length of the boxcar filter. Figure from Tiscareno et al. [11].
In thus filtering the signal, we explicitly assume that variations in the background surface density are either absent or unimportant in determining the wave structure. In practice, we find that even waves with significant variation in background brightness can be well fit to equation (2.1), thus justifying this assumption. Waves for which such brightness variations are significant are noted in [11].
Secondly, we find in practice that fitted values of the initial phase ϕ0 are too uncertain to be useful. They turn out to be highly correlated with rL, as the distances between rL and the peaks of the wave depend linearly on ϕ0 [3]. Furthermore, it is easy enough to calculate the value of ϕ0 from the location of the perturbing moon on its orbit (the uncertainty of which is exceedingly small). Therefore, we constrain ϕ0 to maintain the expected value while fitting for the other parameters.
(v). Error estimates.
Meaningful uncertainties can be obtained for the parameters calculated in §4a(i)—namely σ0, rL and ϕ0—by simply propagating the normalized errors obtained from the quadratic fit to  [40]. However, this treatment assumes that the residuals will have an uncorrelated Gaussian distribution about the fitted curve. In our case this is not true. Because the wavelet transform gives up some radial resolution in order to obtain frequency resolution (see §3c), the effective radial resolution of the wavelet phase
  is lower than that of the original scan. Thus, since we have used the same radial scale for all quantities, we have oversampled the wavelet phase so that adjacent pixels are highly correlated.
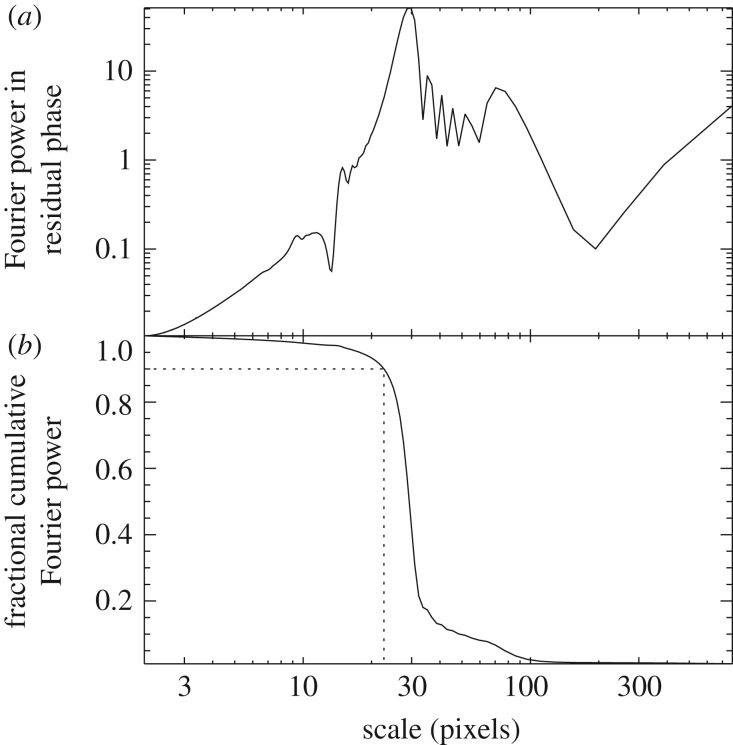
We estimate the oversampling factor by examining the Fourier transform of the residual phase from figure 3d. Indeed, as seen in figure 5, very little power resides at scales within an order of magnitude of the nominal pixel scale. We define the ‘effective pixel scale’ λ90 as the scale above which 90% of the Fourier power resides. Thus, the calculated error estimates must be multiplied by a factor  . This has been done for the synthetic error estimates quoted in figure 3 and will be done throughout this paper.
Figure 5.
(a) The Fourier transform of the residual phase from figure 3d. (b) The fraction of Fourier power at scales λ > λ′, for all λ′. The dotted lines show that, for our synthetic wave, 90% of the Fourier power resides at scales greater than λ90 = 22.7 pixels. Figure from Tiscareno et al. [11].
We estimate the uncertainty in our fitted values of ξD as being comparable to the largest peak-to-trough wavelength in the wave, since it is these wavecycles that are smoothed over in order to estimate the shape of the wave envelope (§4a(ii)). This error estimate is converted from units of km to the dimensionless units of ξ by inserting it in place of the quantity r − rL in equation (2.2).
(vi). Method summary.
The steps used in this paper to fit density waves in Saturn's rings are described above in detail, illustrated in figure 6, and briefly enumerated here:
(i) The wavelet transform
 is taken of the input signal Δσ(r).
(ii) A line is drawn through the two-dimensional wavelet transform, passing through local minima, separating the wave signature from lower-frequency background variations.
(iii) Elements of the wavelet transform with wavenumber below the line are set to zero, yielding the filtered wavelet transform
 .
.(iv) The inverse wavelet transform of
 is taken, yielding a high-pass-filtered signal Δσ′(r).
(v) The average wavelet phase of
 is taken, yielding
  .
.(vi) A radial interval [r1, r2] is defined, and the phase
 on r1 < r < r2 is fit to a quadratic function. The residual between
  and the fit is inspected to verify that [r1, r2] well describes the interval that behaves quadratically.
(vii) If the amplitude of Δσ′(r) has a well-behaved shape (verified by visual inspection), then its maximum is used to determine ξD.
(viii) Taking the parameters fitted heretofore as given, a Levenburg–Marquardt least-squares fit of Δσ′(r) is used to determine the remaining parameters (either AL only, or both AL and ξD).
Note that steps 2 and 6 explicitly require human input, while all steps are visually monitored to ensure that calculated curves are well behaved.
(b). Radial profiles of Cassini ISS images
After navigating each image to precisely determine the location within the rings (see figure 7 for orientation) of the image footprint, a grid in ring coordinates (radius and longitude within Saturn's equatorial plane) can be laid across the image. For each radial location, interpolated values across the longitudes represented in the image are averaged, and these are compiled in order to obtain a one-dimensional ‘radial profile’ of the image (the image shown in figure 8 is represented by the radial profile plotted across the top of figure 9).
Figure 7.
Location within Saturn's main ring system of figures in this paper.
Figure 8.
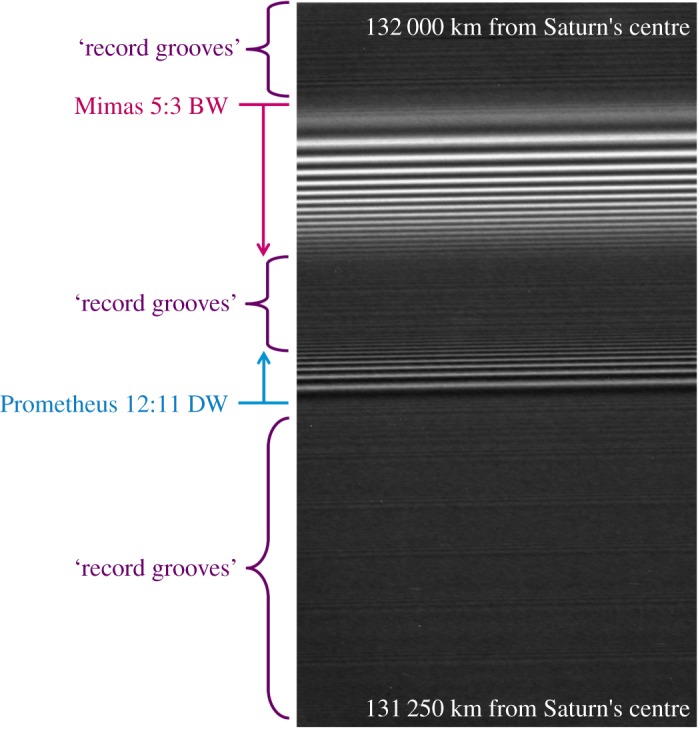
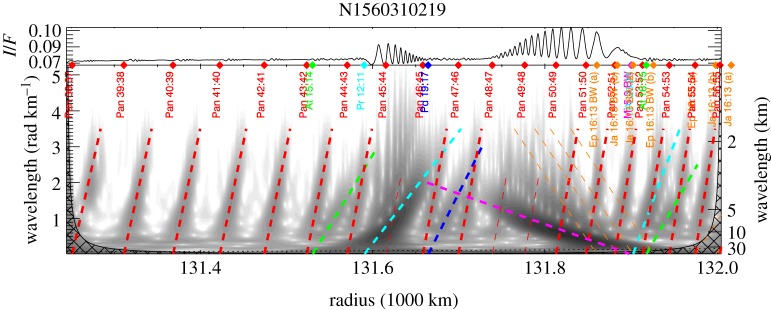
A portion of N1560310219, from the ‘high-resolution radial scan’ 046/RDHRESSCN, shown here as an example (analysis is shown in figure 9). The nominal radial scale for this image is 0.7 km px−1. As indicated by the annotations, the ring radius (i.e. the distance from Saturn's centre) increases from bottom to top. The most prominent features in this image are the outward-propagating Prometheus 12:11 SDW and the inward-propagating Mimas 5:3 SBW. The rest of the image is pervaded by a more subtle structure that resembles the grooves on a vinyl record. Figure from Tiscareno & Harris [18].
Figure 9.
Radial profile and wavelet plot for image N1560310219, continuing the example begun in figure 8. The radial profile extends across the top, and the greyscale shading in the main part of the plot indicates power in the wavelet transform (§4b). The signature of the Prometheus 12:11 SDW hangs downward from the associated cyan dashed line with a concave-up geometry [18], while the signature of the Mimas 5:3 SBW hews more closely to the associated magenta dashed line, because SBWs do not display significant nonlinearity. The ‘record grooves’ mentioned in figure 8 are here revealed to be weaker SDWs, mostly resonance with Pan (red) but some resonances with Atlas (green) and second-order resonances with Prometheus (cyan) and Pandora (dark blue). Wave models shown in bold are judged to appear in the data, while those shown as thin lines (e.g. Pan 49:48, the Janus/Epimetheus 16:13 bending waves) are not perceptible because they are overwritten by other, strong structures. All wave models in this figure use an unperturbed surface mass density σ0 = 32 g cm−2. Figure from Tiscareno & Harris [18].
(c). Evaluating the presence of ring features
A quasi-periodic feature in a radial profile will create a linear or quasi-linear signature in the wavelet plot. A true periodic feature with a constant wavelength λ will produce a horizontal wavelet signature. A feature with a wavenumber k = 2π/λ increasing (decreasing) at a constant rate will create a linear wavelet signature that slants upward (downward): this is expected for a spiral wave that follows the linear theory. A nonlinear spiral wave will create a wavelet signature that curves or is otherwise nonlinear (see [18] for details). A moonlet wake, created when a recently passed nearby moon organizes the streamlines of ring particles, also creates a curved wavelet signature [7,11].
Conversely, bare peaks and sharp edges produce power at all frequencies. Similarly, an aspect of ‘peakiness’ in the wavecrest of a quasi-sinusoidal feature will produce power in frequencies above that of the quasi-sinusoidal frequency. Finally, dappled or speckled wavelet signatures indicate simple noise.
(d). Results
(i). Iapetus nodal bending wave.
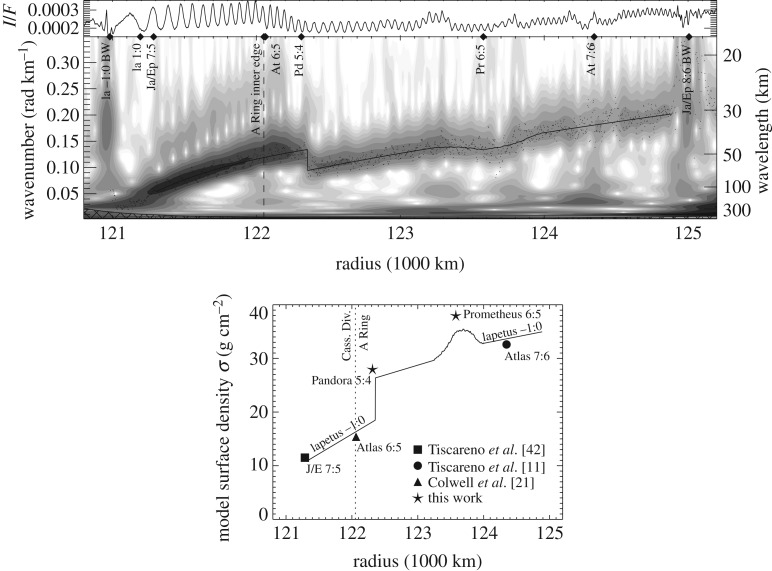
Sometimes, a wave extends across a region in which the ring's unperturbed surface mass density naturally varies. A good example of this is the Iapetus −1:0 SBW [17]. Because this wave results from an m = 1 (see §2) nodal resonance, in which it is ring particle precession frequencies that are commensurate with the orbital frequency of the distant moon Iapetus, its wavelengths are quite long and it extends over several thousand kilometres before it damps away (figure 10a). Thus, plugging the observed series of slopes k(r)/(r − rL) into equation (2.6) yields a complex profile of true unperturbed surface densities σ0(r), which agrees at several points with σ0 values derived from measurements of smaller SDWs (figure 10b). A key factor that makes this possible is that even strong SBWs do not concentrate mass (as their perturbations are perpendicular to the ring plane, rather than within it), so nonlinear effects are negligible.
Figure 10.
Wavelet transform plot (top) and derived unperturbed surface mass density profile (bottom) from the Iapetus −1:0 SBW. Figures from Tiscareno et al. [17].
(ii). Spiral density and bending waves.
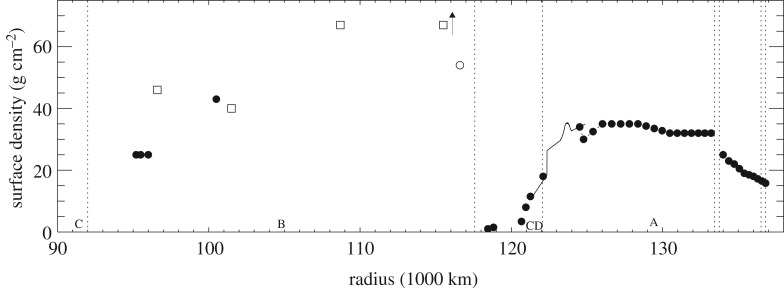
The methods described above have been used to compile a census of spiral waves in Saturn's rings [11,18,21,22]. Using methods like those shown in figures 6 and 9, profiles of the surface mass density (figure 11) and viscosity [11] have been compiled.
Figure 11.
Surface mass density profile including the B ring. The filled circles are derived from the wave model fits to wavelet signatures in [18]. The filled circles in the Cassini Division (CD) correspond to individual SDWs and SBWs, while the filled circles in the A ring correspond to regions fit collectively. The solid line corresponds to the Iapetus −1:0 SBW [17]. The open squares are data points from [24], and the arrow indicates a surface mass density measurement of approximately 130 g cm−2 from the same work. The open circle is a data point from Lissauer [43], as cited in [24]. Figure from Tiscareno & Harris [18].
(iii). Pan wakes.
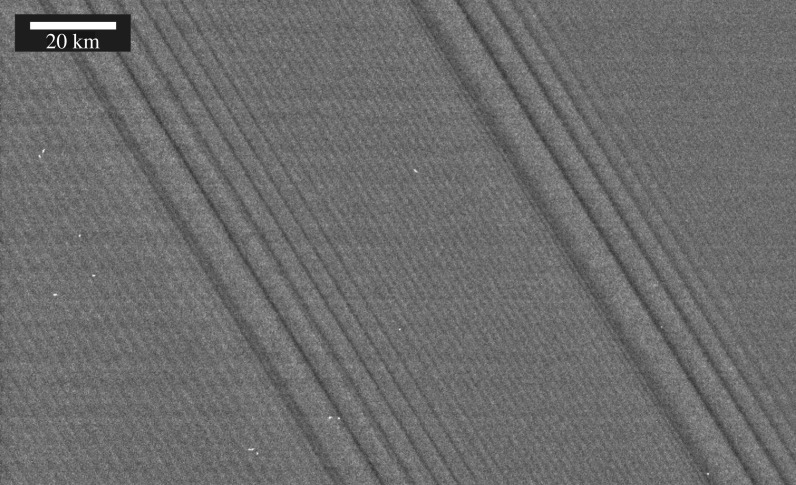
The ‘corduroy’ pattern pervading the image in figure 12 is caused by moonlet wakes excited by Pan. Such wakes (described in detail by [7,8]) are a fundamentally different process from waves in that they do not propagate, but arise from ring particle orbits organized coherently by encounters with nearby Pan.
Figure 12.
A portion of Cassini image N1467346329, showing a ‘corduroy’ pattern caused by moonlet wakes excited by Pan. Also seen are the Pandora 11:10 and Prometheus 15:14 density waves. See figure 13 for analysis. Figure from Tiscareno et al. [11].
Wavelet analysis of the image is shown in figure 13, with two different values of the central frequency ω0 (§3c) bringing out different aspects of the structure. Like previous authors, we note that wake wavelengths in the data tend to be a few percent longer than the model predicts, likely due to mutual gravitation among the ring particles. Also, not only can we verify the existence of a second-order wake (which is simply structure that has survived after more than one synodic period after its creation by Pan), but we also see signs of a third-order wake. Thus, wake structure is seen right down to wavelengths near the resolution limit, indicating that we still cannot place a limit on the remarkable resiliency of wake structures against damping.
5. Multi-profile wavelet analysis with Cassini Ultraviolet Imaging Spectrograph occultations
The first use of wavelets to co-add data from multiple radial ring profiles involved Cassini UVIS stellar occultations [21,22]. Each occultation provides a single one-dimensional profile of the ring's opacity, so there is no opportunity to average over longitude to improve signal to noise. However, these profiles can resolve very fine-scale structures because their spatial resolution is determined by the apparent size of the star as projected on the rings, and by the spatial scale of diffraction, and not by the instrument's instantaneous field of view. Furthermore, the location in the ring probed by an occultation is determined by the position of the spacecraft relative to the rings and the star, and is insensitive to the precise orientation of the spacecraft. This allows the geometry of each occultation to be determined to very high accuracy, enabling data from different occultations to be combined together effectively.
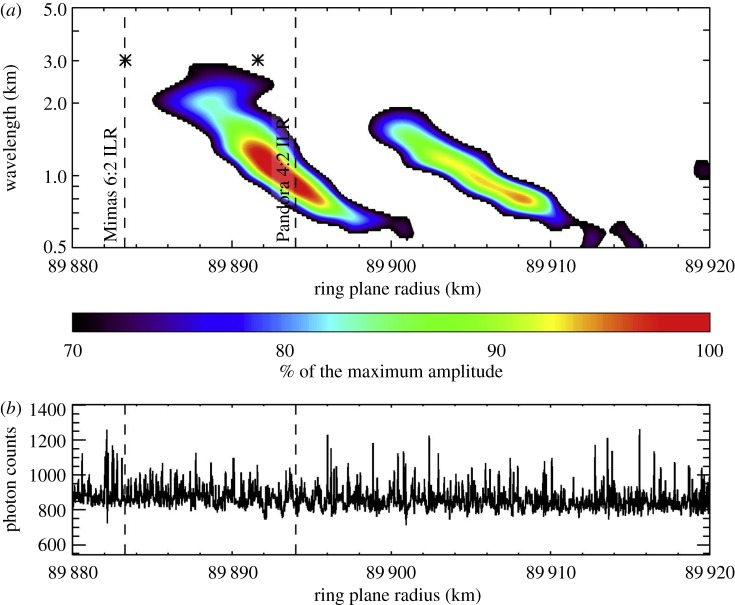
The analysis of UVIS occultations employed the ‘weighted wavelet Z’ technique [23]. A wavelet transform was performed on each individual occultation, and then the wavelet scalograms (equation (3.10)) were co-added together with a weighting based on the quality of each profile in terms of resolution and/or signal to noise. This ‘is equivalent to summing probabilities, which is the best way to treat datasets of different qualities (as opposed to adding raw power)’ [21]. The benefits of this approach are illustrated in figure 14, which shows the detection of two faint SDWs in the C ring despite the fact that neither can be seen by eye in individual occultation profiles. Surface mass density and viscosity measurements were obtained from these profiles in [22].
Figure 14.
(a) Wavelet power profile of the Mimas 6:2 and Pandora 4:2 SDWs in the C ring, derived by co-adding wavelet profiles from UVIS occultations via the WWZ process. The y-axis is wavelength, rather than wavenumber as in other figures in this work. (b) One of the individual UVIS occultations from which the wavelet profile in a was computed, namely β Centauri from Rev 85. The waves are not visible by eye in this profile. Figure from Baillié et al. [22].
6. Multi-profile wavelet analysis with Cassini Visual and Infrared Mapping Spectrometer occultations
The analyses of the UVIS occultations carried out to date (§5) amount to co-adding the real-valued magnitude of the wavelet transforms from the various occultations. This approach effectively beats down noise, as stochastic features in individual profiles are averaged out, while persistent signals at particular wavelengths and locations remain in the averaged power.
Even more powerful methods, which use the phase of the complex-valued  both to characterize waves of unknown origin and to further isolate signals from weak waves, were subsequently devised and applied to occultations observed by the VIMS instrument [4–6,24].
(a). Using wavelets to constrain the properties of unidentified waves
First, consider how wavelet phase information can be used to constrain the number of arms and rotation rates of density waves. For waves generated by satellites, the location of the wave usually provides secure information about both these parameters because the locations of any resonance with a moon can be predicted with a high degree of accuracy. However, there are waves in Saturn's rings that do not fall near any known resonance with any of Saturn's moons. These waves are likely generated by oscillations and asymmetries inside Saturn itself. The frequencies of these oscillations cannot yet be predicted a priori, so we must use data from the waves themselves to determine the appropriate values of m and Ωp in equation (2.5). It turns out that this can be done using the phase information encoded in the wavelet transformations.
(i). Wave phase comparisons as a diagnostic.
The utility of wave phases for constraining density wave properties can be illustrated by examining some particularly informative occultations of the star RS Cancri. These were chord occultations, in which the star cut obliquely through the rings. For such an occultation, the star passes through the same radial range at two very different longitudes as the track enters and then leaves the rings. Comparisons of the wave profiles derived from the ingress and egress parts of these occultations thus provide useful examples of how occultation data can constrain wave parameters. Indeed, even simple visual inspections of these wave profiles indicates that several of the unidentified waves have very similar pattern speeds and likely the same m-numbers.
Figures 15 and 16 show the relevant occultation profiles from the RS Cancri occultations observed during Revs4 80 and 85. Of particular interest are the three waves5 W82.00, W82.06 and W82.21, which are clustered within a region a couple of hundred kilometres wide around 82 100 km from Saturn's centre. In the Rev 80 RS Cancri data, the ingress and egress profiles for each of these waves are almost perfectly anti-correlated, with peaks in one profile corresponding to dips in the other and vice versa. This indicates that the phase difference between these two occultation cuts is close to 180° for all three of these waves. This finding alone might be interpreted as a coincidence, but if we turn our attention to the Rev 85 data, we again find suspicious similarities among these three waves. For all three of the waves, the sharp peaks in the egress data occur about one-third of a cycle exterior to the sharp peaks in the ingress data. This again suggests that the phase difference between the ingress and egress cuts (in this case approximately 240°) is nearly the same for all three of these waves.
Figure 15.
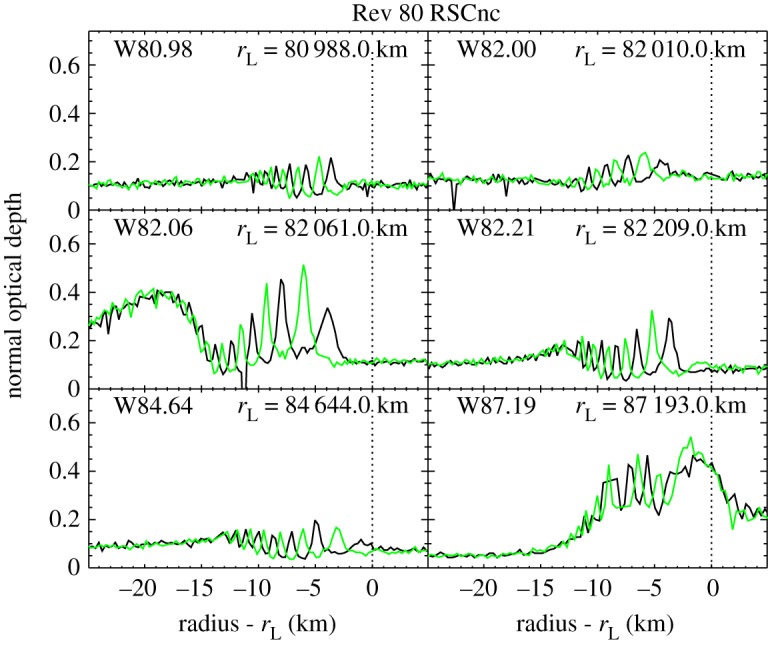
Profiles of six waves in the C ring obtained during the occultation of the star RS Cancri on Rev 80. The black profiles were obtained during ingress, while the green profiles were obtained during egress. The normal optical depth values assume the star's elevation angle above the rings is 29.96°. Note that the phase differences between the waves seen in ingress and egress are the same for the three waves found around 82 000 km. This suggests that all these waves have the same m-numbers. Figure from Hedman & Nicholson[4].
Figure 16.
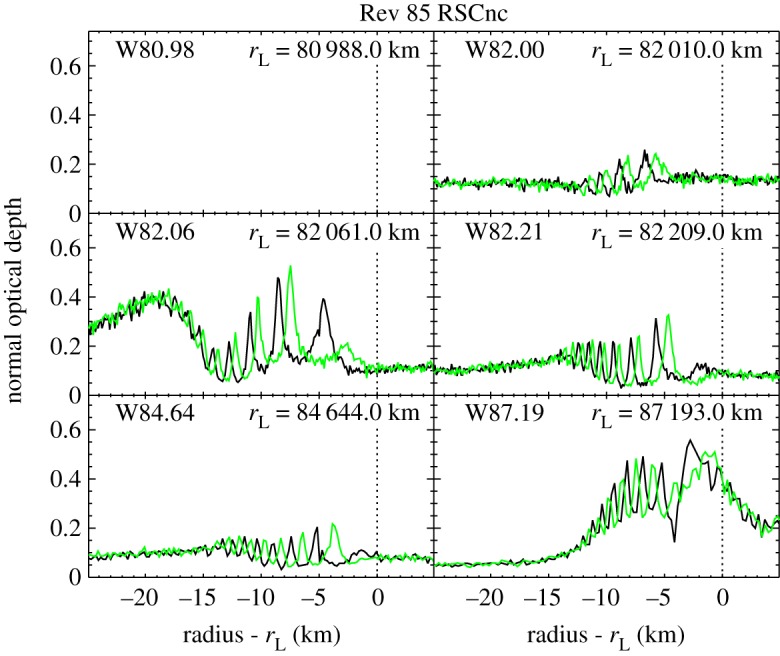
Profiles of six waves in the C ring obtained during the occultation of the star RS Cancri on Rev 85. The black profiles were obtained during ingress, while the green profiles were obtained during egress. Note that the phase differences between the waves seen in ingress and egress are again the same for the three waves found around 82 000 km. This implies that all these waves have the same m-numbers. The two waves found outside 84 000 km also show similar phase differences, indicating that they may have the same m-number as each other. Figure from Hedman & Nicholson [4].
This result is significant because it implies that all three of these waves almost certainly have the same m-number. The waves W82.00, W82.06 and W82.21 are close together in the rings. Hence, for each of these occultations, the ingress cuts for these three waves occurred at nearly the same longitude and time, and similarly the egress cuts are grouped closely in longitude and time. This means the difference in the observed longitudes (δλ) and the observed times (δt) between ingress and egress are almost identical for the three waves. Since the difference in the phase ϕ0 between the waves is given by δϕ = |m|(δλ − ΩPδt), the easiest way for all three waves to have the same phase difference is for them to have the same m-number and nearly identical pattern speeds.
(ii). Using wavelets to compute phase differences.
While simple inspection of the RS Cancri profiles suggests that several of the waves have similar pattern speeds and identical m-numbers, we need quantitative measurements of the phase differences between different occultation cuts to ascertain the actual values of m or Ωp for these waves. Fortunately, wavelet transforms provide a means of estimating the phase difference between any two occultation cuts through a given wave.
Before applying the wavelet transform to the relevant occultation data, we first interpolate the data onto a uniform array of radii with a radial spacing of 50 m. A small part of this re-sampled profile centred on each wave is then fed into the publicly available IDL routine wavelet [14]. The default Morlet mother wavelet with ω0 = 6 is used throughout this analysis. The resulting wavelet is a two-dimensional array of complex numbers as a function of radius and radial wavenumber  . (Note we use the wavenumber k here instead of the scale s.) Let us denote the real and imaginary parts of the wavelet as
  and
and  , respectively, so that the wavelet power is
  and the wavelet phase is
 .
.
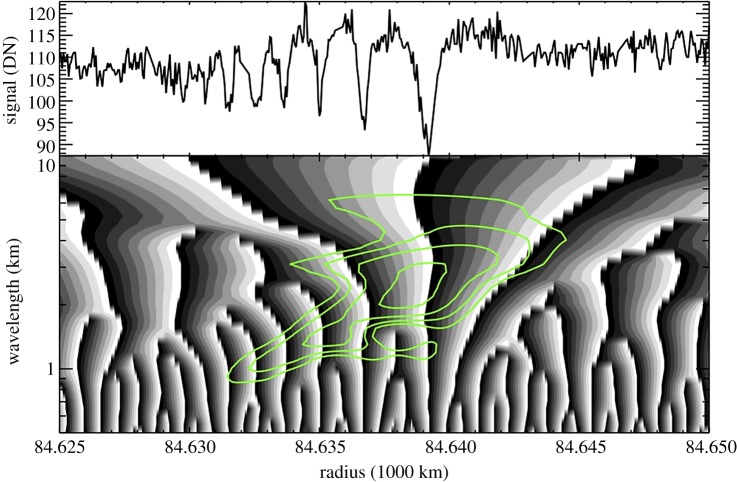
Figure 17 illustrates how the wavelet phase and power vary with position and wavelength across a representative wave. As in figure 6, there is a diagonal ridge in the wavelet power that tracks the observed trends in the wave's wavelength. Furthermore, we can observe that where the wave is strong and the wavelet power is high, the contours of constant phase are nearly vertical, so a well-defined phase can be ascribed to every radius in the wave. The values of the phase in this region are also reasonable given the profile, being near ± 180° at local minima and around 0 at local maxima. Thus, for such waves we can reduce the two-dimensional wavelet to estimates of the wave power and phase as a function of radius by appropriately averaging over a range of spatial wavenumbers.
Figure 17.
Plot showing the wavelet amplitude and phase derived from the W84.64 wave observed by the Rev 106 RCas occultation. The top panel shows the occultation profile (in raw Data Numbers, which is proportional to transmission) as a function of radius. The bottom panel shows the wavelet phase and power as functions of radius and spatial wavelength. The wavelet phase is indicated by greyscale levels (black = − 180°, white = + 180°) while the overlaid green contours are levels of constant wavelet power. The peak wavelet power follows a diagonal ridge that corresponds to the wave's increasing wavelength with radius. Note that where the wavelet power is strong, the contours of wavelet phase are nearly vertical and correspond to the expected phase of the wave (e.g. the phase wraps from −180° to 180° at locations corresponding to sharp minima in the profile). Figure from Hedman & Nicholson [4].
In order to filter out large-scale background variations in the rings' opacity while still capturing most of the wave's power, we include a limited range of wavenumbers in these averages. Specifically, we exclude all wavenumbers less than k1 = 2π/(5 km) and all wavenumbers greater than k2 = 2π/(0.1 km). The effective power of the wave at a given radius is, therefore, defined to be
 |
6.1 |
where  is a normalization constant. Note that since we are only interested in relative power for this analysis, we choose
  so that Eeff is equal to unity at its peak value. Also note that this sum is done over a series of logarithmically spaced values of k.
In order to derive an effective phase for the wave at each radius, we first compute an effective average real part and imaginary part of the wavelet:
| 6.2 |
where the sums are again over all values of k between k1 and k2. Note these averages are weighted by the power, so that the regions with the strongest signals dominate the averages. From these average wavelet components, we can compute the average phase at each radius:
| 6.3 |
Note by computing the average of components  and
and  instead of averaging the wavelet phases themselves, we avoid any difficulties involved in averaging a cyclic quantity. The phase difference between two occultations should then simply be the difference in the two values of ϕ(r).
Figures 18 and 19 show the results of these calculations for two of the waves seen in the RS Cancri occultation from Rev 85. As expected, there is a peak in the wave power Eeff located near the centre of the wave. Also, the difference in the wave phase between the egress and ingress cuts is relatively constant in the region where the wave signal is evident, as desired. Furthermore, the numerical values of these phase differences are consistent with the observed profiles. For the W84.64 wave in figure 19, the phase difference is around 180°, which is what one would expect given that the peaks in the ingress profile occur at the same location as the dips in the egress profile and vice versa. Similarly, the W82.21 data in figure 18 yield a phase difference of around 240°, which is consistent with the dips in the egress profile always lying about  of a cycle exterior to those in the ingress profile.
Figure 18.
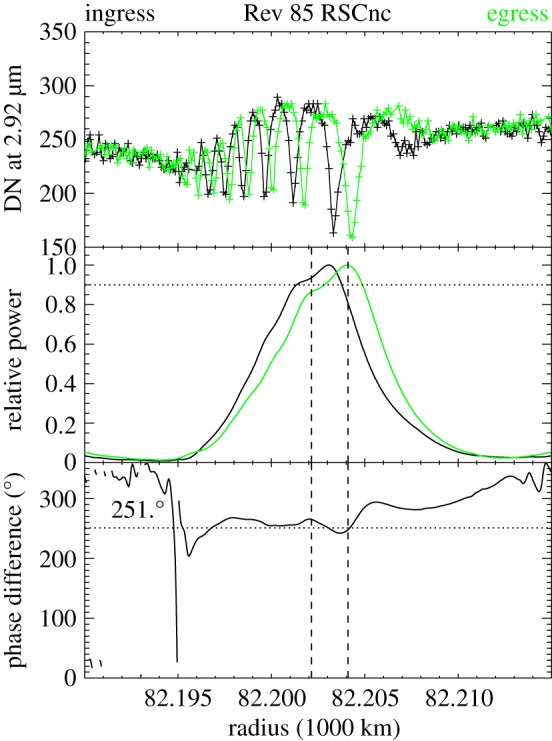
Results of the wavelet calculations of the phase difference in wave W82.21 between the ingress and egress cuts from the Rev 85 RS Cancri occultation. The top panel shows two occultation profiles, while the middle panel shows the integrated wave power Eeff(r) between wavenumbers of 2π/(5 km) and 2π/(0.1 km). The bottom panel shows the phase difference δϕ(r) = ϕegress(r) − ϕingress(r) between these two cuts (see text for explanations of the dashed and dotted lines). Note that the average phase difference is computed using only the data where the average Eeff of the two profiles is above 0.9. The average phase difference is near 240°, which is consistent with the offset between the ingress and egress wave profiles noted in figure 16. Figure from Hedman & Nicholson [4].
Figure 19.
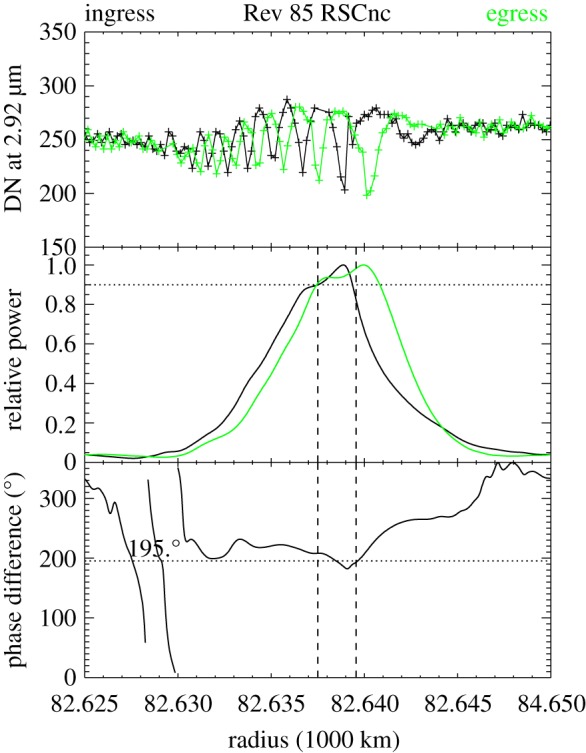
Results of the wavelet calculations of the phase difference in wave W84.64 between the ingress and egress cuts from the Rev 85 RS Cancri occultation, following the same layout as in figure 18. In this case, the average phase difference is near 180°, which is again consistent with the ingress and egress wave profiles. Figure from Hedman & Nicholson [4].
For the purposes of this analysis, we require a single estimate of the average phase difference for any pair of occultation cuts. We estimate this parameter as the weighted average of the phase differences δϕ(r), with each of the individual values weighted by the average of the two Eeff curves in order to ensure that regions with high signal contribute most to the final estimate. In order to further reduce the possibility of contamination in the phase difference estimate, we only consider regions where the average power of the two waves is more than 0.9 (this threshold is indicated by a dotted line in figures 18 and 19, and the averaging region is demarcated by vertical dashed lines). Owing to the weighting, the resulting estimates of the phase differences are not particularly sensitive to the exact value of this threshold. In addition to computing the weighted average phase difference, δϕ between the two cuts (which is shown as a dotted line in the bottom panels of figures 18 and 19), we also compute the standard deviation of the phase difference values in the selected region σϕ, which quantifies the reliability of the phase estimate. Note, however, that σϕ will underestimate the uncertainty in the δϕ because it does not include the effects of uncertainties in the reconstructed geometry. Such geometric uncertainties are difficult to quantify a priori, and will be considered in more detail below.
To recap this procedure, the steps are: (i) compute the wavelet transform,  , for each observation and the corresponding power spectrum, EW(r, k); (ii) compute weighted averages for WR(r) and WI(r), and thence the average phase ϕ(r); (iii) compute the average radial power profile, Eeff(r); and (iv) compute the average phase difference between two wave profiles δϕ, weighted by the average of the two power profiles.
(iii). Using phase differences to constrain m-numbers and pattern speeds.
For any given wave, we can compute the expected pattern speed ΩP for any given value of m at any relevant resonant radii using the known properties of Saturn's gravitational field. Furthermore, for a particular pair of occultation cuts, the difference in the observed ring longitudes δλ and the difference in observation times δt is known. We can, therefore, calculate the expected phase difference between any two occultation cuts, δϕ(predicted) = |m|(δλ − Ωpδt) for each value of m. We can compare these predicted phase differences with the observed phase differences δϕ(observed) and thereby determine which values of m are most consistent with the observations.
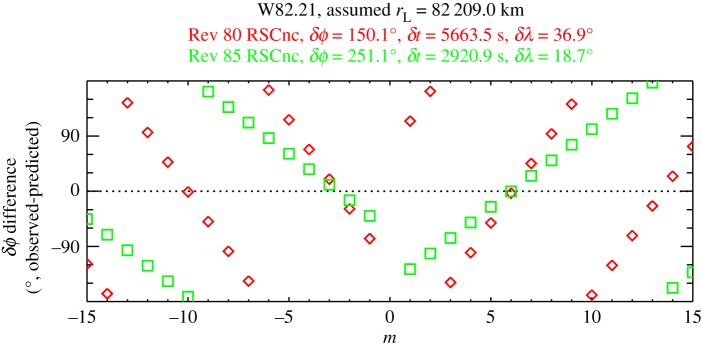
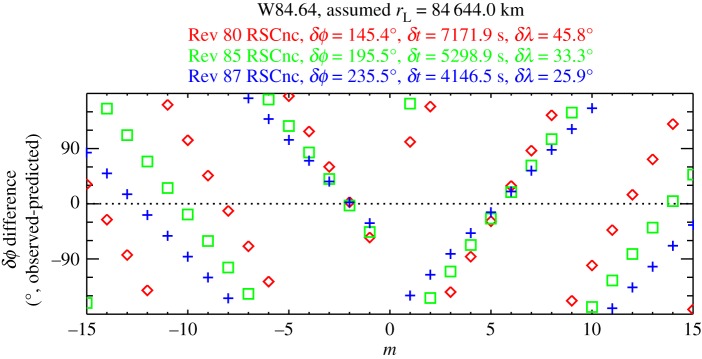
For example, consider the phase differences between the various RS Cancri ingress and egress profiles. Figures 20 and 21 show the differences between the observed and predicted values of δϕ for the waves W82.21 and W84.64 as a function of m. For each observation, the difference δϕ(observed) − δϕ(predicted) cycles repeatedly through 360° with increasing or decreasing m. Hence there are multiple possible m-values that could be consistent with the single observed phase difference. However, different observations have different values of δt and δλ and thus show different trends in these plots. Hence there are relatively few m-values that could be consistent with the two or three observations illustrated in figures 20 and 21. If we conservatively assume a ± 30° uncertainty in the phase determinations (which is consistent with the results of the global analysis described below), then m = − 3, − 2 and +6 are consistent with the RS Cancri observations of the W82.21 wave, and m = − 2, + 5 and +6 are consistent with the observations of the W84.64. The small number of m-values that are consistent with this limited number of δϕ estimates demonstrates that our measurements of δϕ can constrain the symmetry properties and pattern speeds of these waves. However, it is also clear that we cannot uniquely determine the m-value for any of these waves with just two or three phase differences.
Figure 20.
Plot showing the difference between the observed and predicted values of δϕ between the ingress and egress cuts of the RS Cancri occultations for the wave W82.21 as a function of the assumed m-number, given the stipulated δλ and δt values. Different symbols correspond to different pairs of occultation cuts. Note that the residuals for both observations are close to zero when m = − 2, − 3 and +6, so these values of m are the ones most consistent with the observed phase differences. Figure from Hedman & Nicholson [4].
Figure 21.
Plot showing the difference between the observed and predicted values of δϕ between the ingress and egress cuts of the RS Cancri occultations for the wave W84.64 as a function of the assumed m-number. Note that the residuals for all three observations are close to zero when m = − 2, + 5 and +6, so these values of m are the ones most consistent with the observed phase differences. Figure from Hedman & Nicholson [4].
Fortunately, VIMS observed dozens of occultations over the course of the Cassini mission, so in principle hundreds of phase differences could be computed. In practice, some occultation pairs do not yield reliable phase difference estimates. Specifically, in some cases, the average wavelet power for the two cuts never exceeds 0.9 of the peak power in each cut. This implies that the peak wave signal in the two cuts is coming from different parts of the wave (perhaps, because they have different intrinsic resolutions), and so we do not consider such pairs. We also exclude any occultation pairs which yield a RMS phase-difference scatter σϕ greater than 20° because large values of σϕ indicate that the wavelet was unable to identify a consistent phase difference (perhaps due to small gaps or cosmic rays in one of the profiles). Finally, we only consider pairs of occultations where the time difference is less than 300 days. This prevents any aliasing that might occur due to the limited number of observations with larger time separations. After applying these selection criteria, we often have between 100 and 300 δϕ estimates for each of the waves.
As with the RS Cancri data described above, the symmetry properties and pattern speeds of each wave are constrained by computing expected values of δϕ for different combinations of m and Ωp and comparing these numbers with the observed δϕ values. Specifically, we seek values of m and Ωp that minimize the RMS residuals of δϕ(observed) − δϕ(predicted). In principle, we could just compute these RMS variations for each m assuming Ωp is given by the standard expressions for the appropriate resonance. However, given the uncertainties in the planet's gravitational field and the precise locations of the resonant radii for these waves, it is better practice to instead compute the RMS phase difference residuals over a finite range of pattern speeds surrounding the expected Ωp corresponding to each m.
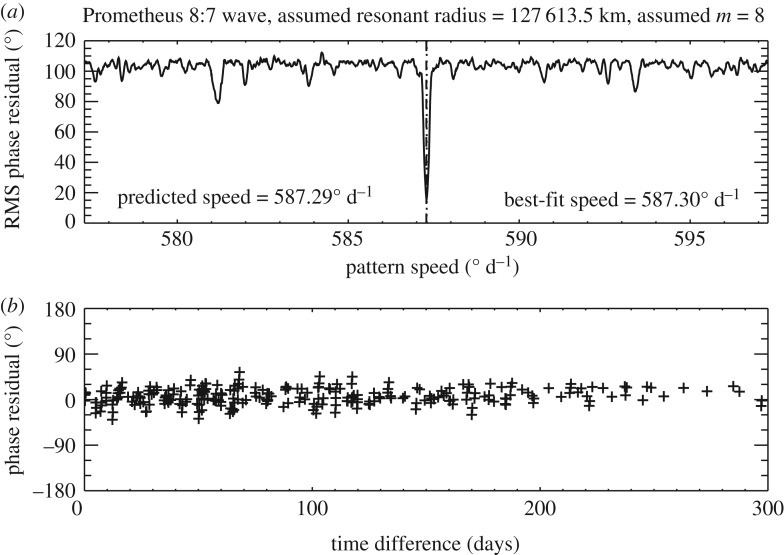
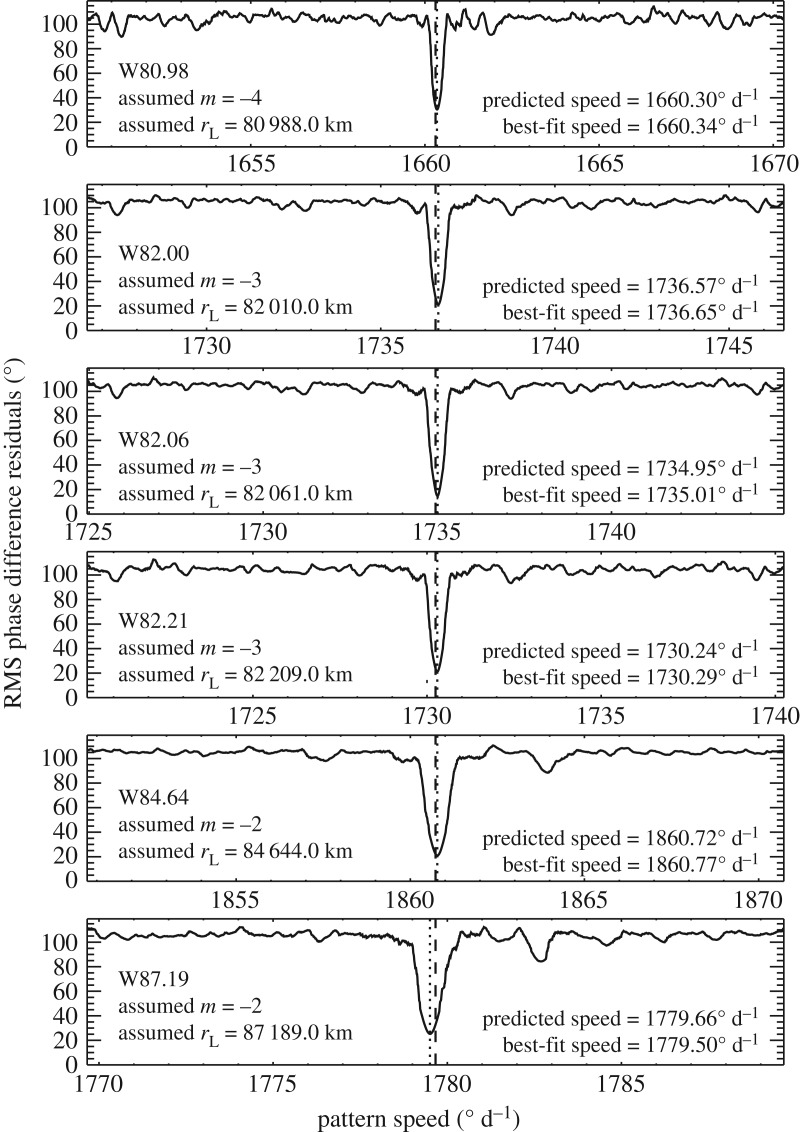
It is important to realize that we are studying patterns that rotate around the planet at hundreds of degrees per day, and we are using occultations separated in time by up to 300 days. Hence one could reasonably ask whether our δϕ calculations are sufficiently accurate to yield meaningful constraints on m and Ωp. This is most easily done by first testing our methods on waves with known pattern speeds, and so we applied the above algorithms to occultation profiles of the Prometheus 8:7 density wave in the outer A ring. Figure 22 shows the RMS phase difference residuals (observed–predicted) for this wave, assuming the pattern has the expected m = 8. These residuals have the sharp dip at 587.30°d−1, which corresponds almost exactly to Prometheus' mean motion and the expected pattern speed for this wave. Thus the pattern speed with the minimum variance in the phase residuals matches the expected perturbation frequency, as desired. Furthermore, no similar dip is seen when other values of m are tried. These results demonstrate that the above procedures can indeed yield reliable estimates for the pattern speeds and m-numbers of even tightly wound density waves.
Figure 22.
A test of our pattern-speed determination algorithms using the Prometheus 8:7 wave in the inner A ring. (a) The RMS phase difference residuals as a function of pattern speed assuming the pattern has an m = 8, as expected for this wave. The dashed line marks the predicted pattern speed for this pattern, while the dotted line marks the pattern speed that gives the minimum variance (in this case, these two lines are almost on top of each other). (b) The residuals in the phase differences from this best-fit solution as a function of time difference between the pairs of observations. The scatter in these data likely represents residual geometrical uncertainties in the various profiles. Figure from Hedman & Nicholson [4].
Figure 22a shows the phase difference residuals as a function of time separation δt. These points are randomly scattered about zero, as desired, but with a ±20° scatter which probably reflects not only statistical uncertainties in the phase estimates themselves but also uncorrected systematic errors in the occultation geometries. As noted above, the latter can shift wave profiles relative to each other, which will produce errors in the phase differences that are hard to model. However, these data demonstrate that these systematic errors do not prevent us from determining the pattern speeds of spiral waves.
Figure 23 shows the same sort of analysis for six waves that could not be attributed to any resonances with any of Saturn's moons. For each of these waves, there was only a single m that yielded a clear minimum in the RMS phase difference residuals that was located close to the expected pattern speed. Note that W82.00, W82.06 and W82.21 all showed this minimum with the same m = − 3, which is consistent with their common phase shifts in figures 18 and 19. Thus far, these techniques have revealed the m-numbers and pattern speeds of about a dozen previously unidentified waves [4–6], yielding precise rotation rates for a variety of structures in Saturn. These measurements are forcing re-evaluations of Saturn's interior [45].
Figure 23.
Plots showing the RMS phase difference residuals as a function of pattern speed for each of the six waves, assuming the pattern has the indicated m-numbers. The dashed line marks the predicted pattern speed for this pattern at the resonant location provided by [22], while the dotted line is the pattern speed that gives the minimum variance in the residuals. Figure from Hedman & Nicholson [4].
(b). Multi-profile wavelet analysis to isolate specific waves
The phase information encoded in wavelet transformations not only permits the m-number and pattern speeds of unidentified waves to be determined, it can also be used to isolate density wave signals from other ring structures. For example, the B ring is the most opaque part of Saturn's rings and was long assumed to contain most of the rings' mass. However, accurately estimating the mass of this ring was challenging because the density waves found in other parts of the rings were difficult to find. While several strong satellite resonances exist in the B ring, the resulting waves were not obvious in individual occultation profiles. This was not only because the ring blocked most of the starlight, but also because this ring contains abundant fine-scale structure that varies stochastically from occultation to occultation. These variations obscure any coherent signal from the relevant density waves. While co-adding the wavelet powers as was done with the UVIS occultations [21,22] does improve the signal to noise for weak waves, this method does not clearly reveal the density wave signals in the central and outer B ring. Fortunately, the waves of interest here have known pattern speeds, enabling us to use a method that is even better at isolating the signatures of density waves.
Again, since the desired density wave patterns have wavelengths that should vary with radius across the ring (see equation (2.6)), these waves are most easily identified using wavelets. For this investigation, we again compute the wavelet transform for each re-sampled profile with the standard wavelet routine in the IDL language [14], using a Morlet mother wavelet with ω0 = 6. This yields a wavelet transform  for each profile i as a function of radius r and wavenumber k. Note that this is a complex function, and so, in general, can be written as
  , where
  and Φi(r, k) are the (real) wavelet amplitude and phase. Note that if we have a pure sinusoidal signal at a given wavevector k0, then Φi(r, k0) is the phase of the wave as a function of position. With this nomenclature, the wavelet power
 .
.
For each occultation cut, the SDW should produce a quasi-sinusoidal opacity variation described by equation (2.1). Depending on the observed longitude and time, each profile will have a different value for the phase parameter ϕ0. The crests and troughs of the wave will therefore appear at different locations in different profiles, and the wavelet phases associated with these patterns will vary from occultation to occultation. Fortunately, the waves considered here are all generated by resonances with known satellites, and so we can compute the expected ϕ0 for each occultation profile and use this information to isolate the desired signal from those specific waves.
Let us denote the calculated value of ϕ0 for the ith occultation profile as ϕi. If the track of the star behind the ring was in the radial direction and the star's apparent radial motion across the ring feature were fast compared with the perturbing moon's orbital motion, then ϕi would have a constant value for the entire profile. However, in reality both the observation time and observed longitude vary slightly as the star passes behind the wave, so that ϕi is a function of radius, albeit a very weak one. In any case, we can use ϕi to compute the phase-corrected wavelet for each profile
| 6.4 |
Recall that Φi is the observed wavelet phase, while ϕi is the expected longitude/time-dependent part of the wavelet phase for a SDW with the selected m-number and pattern speed. Hence for any signal in the wavelet due to the desired density wave, the corrected phase parameter Φi − ϕi will equal ξ2/2 + π/4 (see equation (2.7)). This phase is a function only of radius, and so should have the same value for all occultations. Thus, any signal from such a pattern should persist in the average phase-corrected wavelet
 |
6.5 |
where N is the number of occultations. By contrast, any pattern that does not have the selected Ωp should have different phases in the phase-corrected wavelet and thus should average to zero in  in the limit of large N. The signal to noise for the selected waves should therefore be much better in the average phase-corrected wavelet than it is in wavelets from individual profiles. In fact, we find that the average phase-corrected wavelet can yield a clearer detection of weak waves than even the averaged wavelet powers.
In order to illustrate the utility of the average phase-corrected wavelet, it is useful to consider two distinct wavelet powers. First, we define the average wavelet power
 |
6.6 |
This is independent of the individual wavelet phases and so is equivalent to the average value of wavelet powers from the individual profiles Ei:
 |
6.7 |
and is, therefore, similar to the statistics used in [21,22]. Second, we define the power of the average phase-corrected wavelet as:
 |
6.8 |
Note that in this case we perform the averaging prior to taking the absolute square, while the opposite is true for  . Recall that for any real variable x the difference 〈x2〉 − 〈x〉2 is positive definite and equivalent to the variance of x. The difference between these two quantities
  is similarly a positive quantity determined by the variance in the real and imaginary components of the wavelet among the various occultations. Hence Eϕ must have a value between 0 and
  . In fact, Eϕ can only equal
  when Φi − ϕi is the same for all occultations, as would be the case if the opacity variations are entirely due to a single wave with the specified pattern speed and m-number. For any other signal, Eϕ will be less than
  because of the finite scatter in Φi − ϕi. Indeed, as N approaches infinity, Eϕ should approach zero for these signals (provided we can sample all possible values of Φi − ϕi). The ratio between these two powers
| 6.9 |
should, therefore, vary between 1 and 0 depending on how well the phase shifts of the observed data match those derived for the selected m-number and pattern speed.
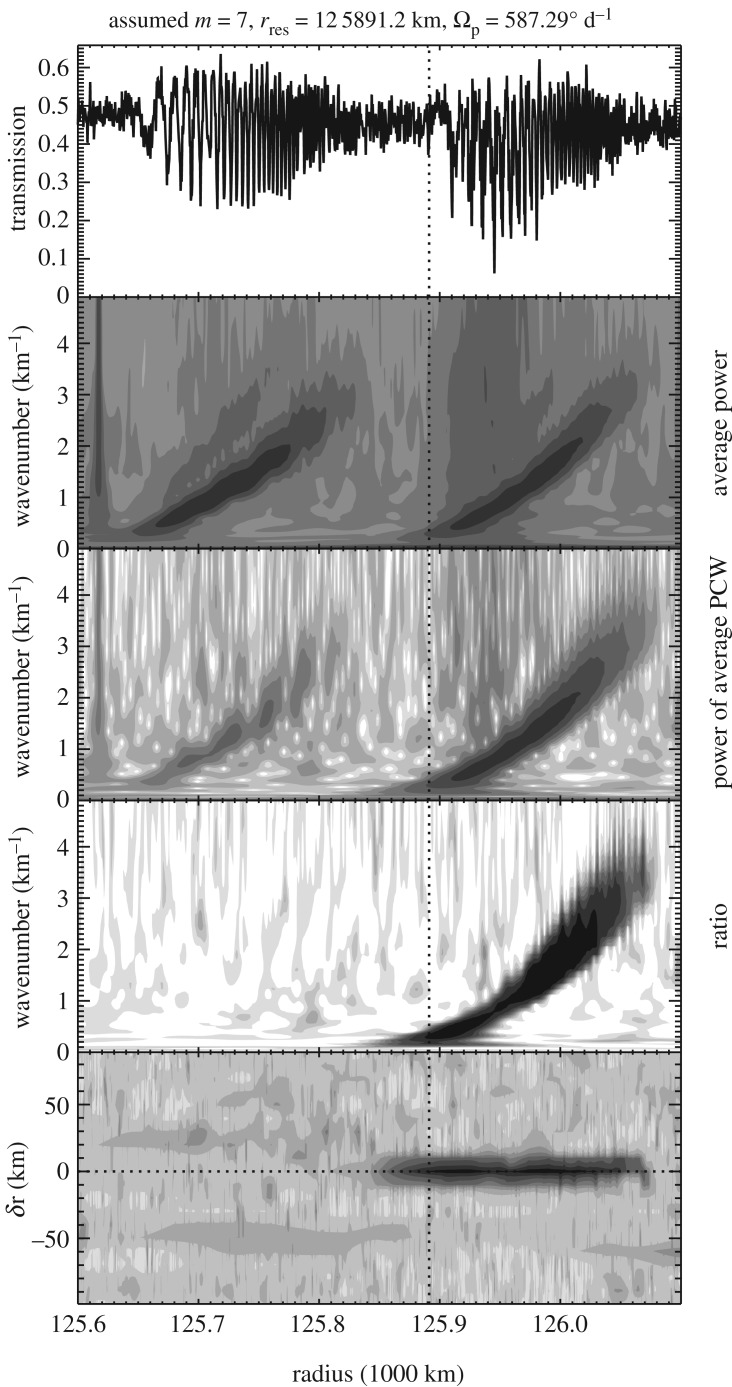
The utility of these parameters is illustrated in figure 24, which shows the results of this sort of analysis for a region of Saturn's A ring occupied by two relatively strong density waves due to the Pandora 6:5 and Prometheus 7:6 resonances. Both of these waves are apparent in the sample profile and can also be seen in the average wavelet power  . However, if we consider the power of the average phase-corrected wavelet Eϕ, then we obtain a different picture. This wavelet power was computed assuming that m = 7 and Ωp = 587.29° d−1, appropriate for the Prometheus 7:6 Lindblad resonance that produces the right-hand wave. As desired, the power of this average phase-corrected wavelet shows a stronger signal from this wave than it does for the wave generated by Pandora. Furthermore, if we consider the power ratio
  , only the signal from the desired Prometheus wave is visible.
Figure 24.
Sample analysis of the Prometheus 7:6 wave in the A ring. The top panel shows the transmission through the A ring as a function of radius from the Rev 89 occultation by γ Crucis. The two density waves clearly visible in this profile are due to the Pandora 6:5 and Prometheus 7:6 resonances. The second panel shows the average wavelet power  for the γ Crucis occultations, with clear diagonal bands associated with both waves. The third panel shows the power of the average phase-corrected wavelet Eϕ, assuming m = 7 and a pattern speed appropriate for the Prometheus 7:6 resonance (the exact resonance location is marked by the vertical dotted line). Note that this highlights the right-hand wave. The fourth panel shows the ratio of the above powers
  , and shows only the signal from that wave. Finally, the bottom panel shows the peak value of
  as a function of radius and assumed pattern speed, parametrized as a displacement δr from the expected Prometheus 7:6 resonance location (marked with a horizontal dotted line). Note that the maps of
  and Eϕ use a common logarithmic stretch, while the maps of
  use a linear stretch. Figure from Hedman & Nicholson [24].
To further validate that this particular wave has the expected pattern speed, we can compute the average phase-corrected wavelet for a range of different pattern speeds Ωp. In practice, we express these pattern speeds in terms of radial displacement δr in the assumed resonance location in the rings. For each assumed δr, we compute the power in the average phase-corrected wavelet and extract the peak power ratio  at each radius (i.e. the maximum value of
  across all wavenumbers). The bottom panel in figure 24 displays this peak
  as a function of both radial location in the ring and assumed resonant location. The highest ratios occur along the δr = 0 line within the radial range occupied by the Prometheus 7:6 wave, thus demonstrating that the desired signal only appears in
  when the assumed pattern speed matches the expected value for this wave.
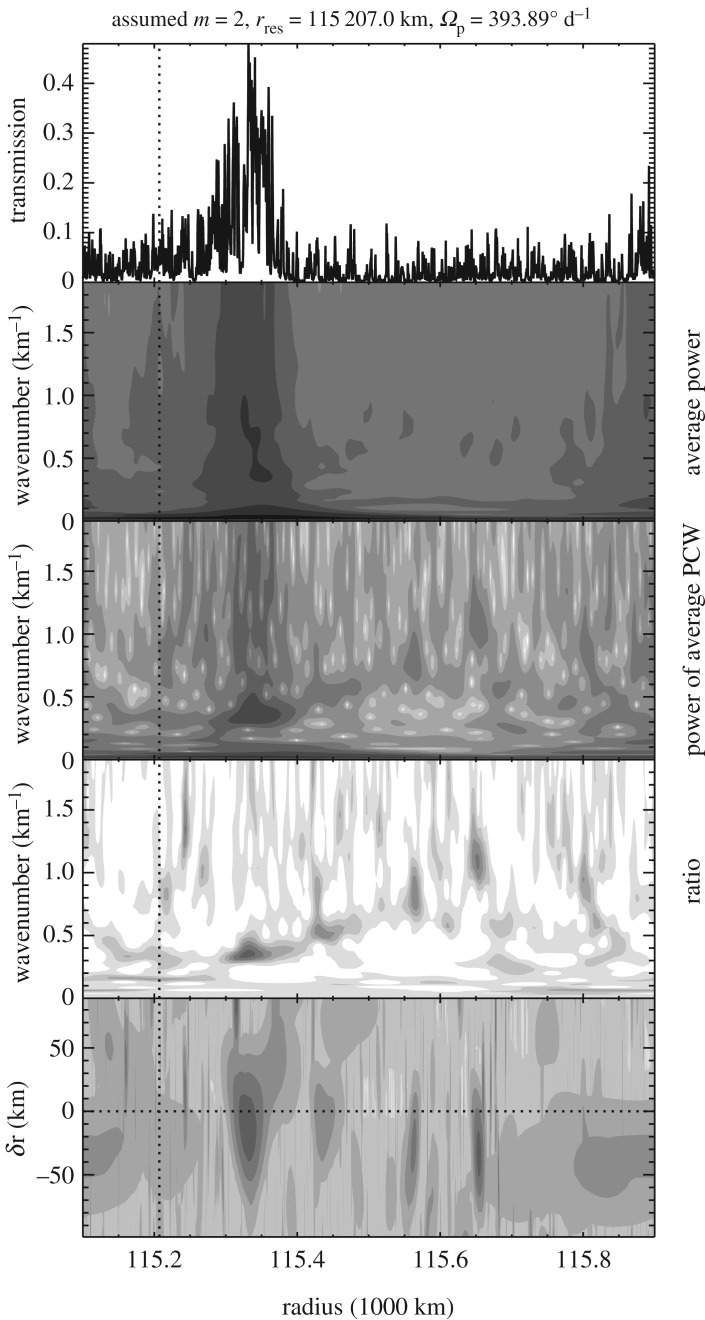
These same procedures were able to reveal previously unseen waves in the B ring. For example, figure 25 shows an analysis of a region around the Enceladus 3:1 resonance that should contain a density wave. However, the profile shows no hint of the quasi-periodic optical depth variations typical of such a wave. Even the average wavelet power generated using multiple occultation profiles fails to show any hint of the diagonal ridge seen in previous plots. By contrast, the power of the average phase-corrected wavelet, and especially the power ratio do show a weak diagonal ridge consistent with a density wave. Furthermore, this structure is only seen when the pattern speed is close to the expected value for the appropriate density wave. These techniques therefore do appear to be able to isolate signals from weak density waves.
Figure 25.
Wavelet analysis on the Enceladus 3:1 wave in the same format as figure 24. Unlike the test case shown in figure 24, the wave shown here was expected but has never been clearly perceived or measured before. A weak wave-like signature can be observed as a diagonal band in the ratio plot (fourth panel) that extends between 115 300 and 115 650 km in radius and between 0.5 and 1.0 km−1 in wavenumber. The bottom panel demonstrates that this signal only occurs when the assumed pattern speed is fairly close to the expected pattern speed of the density wave (i.e. where δr is close to zero). Figure from Hedman & Nicholson [24].
In addition to isolating signals associated with a particular pattern speed, the average phase-corrected wavelet can be used to quantify the wavelength trends in these signals and thereby obtain estimates of the ring's surface mass density. While in principle the wavelength of the pattern can be determined from the location of the peak power in wavenumber space, in practice the wavenumber can be more robustly determined from the radius-dependent phase of the periodic signal ξ2/2 [11,46]. In this situation, the best estimator of this phase can be derived from the average phase-corrected wavelet  (equation (6.5)). As mentioned above, for any wave signature with the correct pattern speed, the complex phase of this averaged wavelet should equal ξ2/2. Hence, we may estimate the phase of the wave at a given radius by computing the appropriately weighted average wavelet phase at that location over a range of wavenumbers that encapsulates the desired signal.
In practice, computing the average phase directly is challenging because the phase parameter is a cyclic quantity. Hence we instead compute the average real and imaginary parts of the wavelet at each radius, and then use these quantities to determine the average phase. More specifically, we compute the (complex) profile D, whose value at each radius r is given by the following expression:
 |
6.10 |
where C is a normalization constant. The value of C and the factors of (2π/k) in the integral are chosen so that in the limit where  for all wavenumbers, this expression corresponds to the inverse wavelet transform of
  [11,14]. Weighting this integral by the power ratio further filters the profiles and thus isolates the desired signal better. This profile D is a complex quantity, with real and imaginary parts DR and DI, respectively. We, therefore, define our estimator of the radius-dependent phase of the profile to be ϕD(r) = tan−1(DI/DR). For a density wave with the relevant pattern speed and m-number, ϕ
D(r) = 〈Φi − ϕi〉 = ξ2/2 + π/4. Since ξ2/2 cycles through 2π for every cycle of the wave pattern, the radius-dependent wavenumber of the pattern is simply the radial derivative of this phase, kD(r) = dϕD/dr. This estimate of the wavenumber depends only on the local trends in the phase parameter, so it can be used to estimate the ring's local surface mass density via equation (2.6). These mass estimates are shown in figure 11. Note that the total mass of Saturn's rings are an important consideration in the debate about the age of both the rings, and at least the inner portion of its system of moons (for review, see [47]), so these mass estimates are an important consideration in that discussion.
7. Conclusion
As shown above, Morlet wavelet analysis has been an extremely useful tool in planetary ring studies, enabling waves to be discovered, identified and characterized. The wave properties extracted from wavelet analysis have provided important information about both the rings themselves and the planet they surround. However, there are still many fine-scale structures in the rings (including some waves) whose properties and origins remain to be explained. Further developments and refinements of wavelet-based techniques may clarify additional aspects of these still-mysterious ring features and thus further improve our understanding of Saturn's rings and their environment.
Acknowledgments
We are grateful to Joe Harrington and Katia Matcheva for first directing our attention to the potential of Morlet wavelet analysis. We are grateful to Joe Burns and Phil Nicholson for their mentorship and for their many contributions to the work reviewed in this manuscript. We are grateful to Christopher Torrence and Gilbert Compo for making their wavelet analysis software available to the public, and for their diligent and helpful responses to our questions when we were in the early days of using it. We are grateful to Paul Addison for inviting us to write this review. The text in §§2 through 4a and §4d(iii) is adapted from Tiscareno et al. [11]. The text in §§4b through 4c and §4d(i) is adapted from Tiscareno & Harris [18]. The text in §6a is adapted from Hedman & Nicholson [4]. The text in §6b is adapted from Hedman & Nicholson [24]. All such adaptations are with permission.
Notes
In most respects, the theory of vertical resonances and SBWs is similar to that of Lindblad resonances and SDWs. On the other hand, some of the details of SBW theory are less well developed, though these differences generally do not affect the frequency structures on which our wavelet analysis is founded. In this review, for simplicity, we focus on the theory of SDWs.
Software available at http://atoc.colorado.edu/research/wavelets/.
 , which is a weighted average of pixel values xi with weights wi, the uncertainty can be estimated with a form of the standard error of the mean (s.e.m.), given in [35].
| 3.14 |
 as two times the unweighted standard deviation, normalized by the square root of the local width of the scan area in pixels, which we find to be a good approximation for the scans discussed in this paper. Since the only current role for
  is to normalize contour plots of the wavelet transform, we judge this approximation to be sufficient for our purposes.
Each orbit of the Cassini spacecraft around Saturn was given a ‘Rev’ designation, which is nearly (but not exactly) the same as the ordinal number of the orbit.
These alphanumeric designations follow the generic notation for ring features devised by Colwell et al. [44], with ‘W’ for ‘wave’ followed simply by the radial location of the wave in units of 1000s of kilometres.
Data accessibility
This article has no additional data.
Competing interests
We declare we have no competing interests.
Funding
M.S.T. acknowledges funding from NASA's Cassini Data Analysis and Participating Scientists program (NNX16AI33G). M.M.H. acknowledges funding from NASA's Cassini Data Analysis and Participating Scientists program (NNX14AD50G, NNX17AF85G).
References
- 1.Lin CC, Shu FH. 1964. On the spiral structure of disk galaxies. Astrophys. J. 140, 646–655. ( 10.1086/147955) [DOI] [Google Scholar]
- 2.Goldreich P, Tremaine S. 1982. The dynamics of planetary rings. Ann. Rev. Astron. Astrophys. 20, 249–283. ( 10.1146/annurev.aa.20.090182.001341) [DOI] [Google Scholar]
- 3.Shu FH. 1984. Waves in planetary rings. In Planetary rings (eds R Greenberg, A Brahic), pp. 513–561. Tucson, AZ: University of Arizona Press. [Google Scholar]
- 4.Hedman MM, Nicholson PD. 2013. Kronoseismology: Using density waves in Saturn's C ring to probe the planet's interior. Astron. J. 146, 12 ( 10.1088/0004-6256/146/1/12) [DOI] [Google Scholar]
- 5.Hedman MM, Nicholson PD. 2014. More Kronoseismology with Saturn's rings. Mon. Not. R. Astron. Soc. 444, 1369–1388. ( 10.1093/mnras/stu1503) [DOI] [Google Scholar]
- 6.French RG, Nicholson PD, Hedman MM, Hahn JM, McGhee-French CA, Colwell JE, Marouf EA, Rappaport NJ. 2016. Deciphering the embedded wave in Saturn's Maxwell ringlet. Icarus 279, 62–77. ( 10.1016/j.icarus.2015.08.020) [DOI] [Google Scholar]
- 7.Showalter MR, Cuzzi JN, Marouf EA, Esposito LW. 1986. Satellite ‘wakes’ and the orbit of the Encke Gap moonlet. Icarus 66, 297–323. ( 10.1016/0019-1035(86)90160-0) [DOI] [Google Scholar]
- 8.Horn LJ, Showalter MR, Russell CT. 1996. Detection and behavior of Pan wakes in Saturn's A Ring. Icarus 124, 663–676. ( 10.1006/icar.1996.0240) [DOI] [Google Scholar]
- 9.Horn LJ, Cuzzi JN. 1996. Characteristic wavelengths of irregular structure in Saturn's B Ring. Icarus 119, 285–310. ( 10.1006/icar.1996.0021) [DOI] [Google Scholar]
- 10.Spilker LJ, Pilorz S, Lane AL, Nelson RM, Pollard B, Russell CT. 2004. Saturn A ring surface mass densities from spiral density wave dispersion behavior. Icarus 171, 372–390. ( 10.1016/j.icarus.2004.05.016) [DOI] [Google Scholar]
- 11.Tiscareno MS, Burns JA, Nicholson PD, Hedman MM, Porco CC. 2007. Cassini imaging of Saturn's rings II. A wavelet technique for analysis of density waves and other radial structure in the rings. Icarus 189, 14–34. ( 10.1016/j.icarus.2006.12.025) [DOI] [Google Scholar]
- 12.Daubechies I. 1992. Ten lectures on wavelets. Philadelphia, PA: SIAM. [Google Scholar]
- 13.Farge M. 1992. Wavelet transforms and their applications to turbulence. Ann. Rev. Fluid Mech. 24, 395–457. ( 10.1146/annurev.fl.24.010192.002143) [DOI] [Google Scholar]
- 14.Torrence C, Compo GP. 1998. A practical guide to wavelet analysis. Bull. Am. Meteorol. Soc. 79, 61–78. (http://atoc.colorado.edu/research/wavelets/) () [DOI] [Google Scholar]
- 15.Addison PS. 2002. The illustrated wavelet transform handbook. Philadelphia, PA: Institute of Physics Publishing; (2nd edition available, 2016). [Google Scholar]
- 16.Porco CC. et al. 2004. Cassini imaging science: instrument characteristics and anticipated scientific investigations at Saturn. Space Sci. Rev. 115, 363–497. ( 10.1007/s11214-004-1456-7) [DOI] [Google Scholar]
- 17.Tiscareno MS, Hedman MM, Burns JA, Weiss JW, Porco CC. 2013. Probing the inner boundaries of Saturn's A ring with the Iapetus -1:0 nodal bending wave. Icarus 224, 201–208. ( 10.1016/j.icarus.2013.02.026) [DOI] [Google Scholar]
- 18.Tiscareno MS, Harris BE. 2018. Mapping spiral waves and other radial features in Saturn's rings. Icarus. (http://arxiv.org/abs/1708.03702).
- 19.Esposito LW. et al. 2004. The Cassini Ultraviolet Imaging Spectrograph investigation. Space Sci. Rev. 115, 299–361. ( 10.1007/s11214-004-1455-8) [DOI] [Google Scholar]
- 20.Brown RH. et al. 2004. The Cassini Visual and Infrared Mapping Spectrometer (VIMS) investigation. Space Sci. Rev. 115, 111–168. ( 10.1007/s11214-004-1453-x) [DOI] [Google Scholar]
- 21.Colwell JE, Cooney JH, Esposito LW, Sremčević M. 2009. Density waves in Cassini UVIS stellar occultations. 1. The Cassini Division. Icarus 200, 574–580. ( 10.1016/j.icarus.2008.12.031) [DOI] [Google Scholar]
- 22.Baillié K, Colwell JE, Lissauer JJ, Esposito LW, Sremčević M. 2011. Waves in Cassini UVIS stellar occultations. 2. The C ring. Icarus 216, 292–308. ( 10.1016/j.icarus.2011.05.019) [DOI] [Google Scholar]
- 23.Foster G. 1996. Wavelets for period analysis of unevenly sampled time series. Astron. J. 112, 1709 ( 10.1086/118137) [DOI] [Google Scholar]
- 24.Hedman MM, Nicholson PD. 2016. The B-ring's surface mass density from hidden density waves: less than meets the eye?. Icarus 279, 109–124. ( 10.1016/j.icarus.2016.01.007) [DOI] [Google Scholar]
- 25.Schmidt J, Ohtsuki K, Rappaport N, Salo H, Spahn F. 2009. Dynamics of Saturn's dense rings. In Saturn from Cassini-Huygens (eds M Dougherty, L Esposito, SM Krimigis), pp. 413–458. Dordrecht, The Netherlands: Springer. [Google Scholar]
- 26.Cuzzi JN, Lissauer JJ, Esposito LW, Holberg JB, Marouf EA, Tyler GL, Boishchot A. 1984. Saturn's rings: properties and processes. In Planetary rings (eds R Greenberg, A Brahic), pp. 73–199. Tucson, AZ: University of Arizona Press. [DOI] [PubMed] [Google Scholar]
- 27.Marley MS, Porco CC. 1993. Planetary acoustic mode seismology: Saturn's rings. Icarus 106, 508–524. ( 10.1006/icar.1993.1189) [DOI] [Google Scholar]
- 28.Murray CD, Dermott SF. 1999. Solar system dynamics. Cambridge, UK: Cambridge University Press. [Google Scholar]
- 29.Kliore AJ, Patel IR, Lindal GF, Sweetnam DN, Hotz HB, Waite JH, McDonough T. 1980. Structure of the ionosphere and atmosphere of Saturn from Pioneer 11 Saturn radio occultation. J. Geophys. Res. 85, 5857–5870. ( 10.1029/JA085iA11p05857) [DOI] [PubMed] [Google Scholar]
- 30.Nicholson PD, Cooke ML, Pelton E. 1990. An absolute radius scale for Saturn's rings. Astron. J. 100, 1339–1362. ( 10.1086/115601) [DOI] [Google Scholar]
- 31.Goldreich P, Tremaine S. 1978. The formation of the Cassini division in Saturn's rings. Icarus 34, 240–253. ( 10.1016/0019-1035(78)90165-3) [DOI] [Google Scholar]
- 32.Goldreich P, Tremaine S. 1978. The velocity dispersion in Saturn's rings. Icarus 34, 227–239. ( 10.1016/0019-1035(78)90164-1) [DOI] [Google Scholar]
- 33.Wisdom J, Tremaine S. 1988. Local simulations of planetary rings. Astron. J. 95, 925–940. ( 10.1086/114690) [DOI] [Google Scholar]
- 34.Addison PS, Watson JN, Feng T. 2002. Low-oscillation complex wavelets. J. Sound Vib. 254, 733–762. ( 10.1006/jsvi.2001.4119) [DOI] [Google Scholar]
- 35.Bevington PR. 1969. Data reduction and error analysis for the physical sciences. New York, NY: McGraw-Hill. [Google Scholar]
- 36.Shu FH, Dones L, Lissauer JJ, Yuan C, Cuzzi JN. 1985. Nonlinear spiral density waves: viscous damping. Astrophys. J. 299, 542–573. ( 10.1086/163722) [DOI] [Google Scholar]
- 37.Borderies N, Goldreich P, Tremaine S. 1986. Nonlinear density waves in planetary rings. Icarus 68, 522–533. ( 10.1016/0019-1035(86)90054-0) [DOI] [Google Scholar]
- 38.Lissauer JJ, Cuzzi JN. 1982. Resonances in Saturn's rings. Astron. J. 87, 1051–1058. ( 10.1086/113189) [DOI] [Google Scholar]
- 39.Rosen PA, Tyler GL, Marouf EA. 1991. Resonance structures in Saturn's rings probed by radio occultation I. Methods and examples. Icarus 93, 3–24. ( 10.1016/0019-1035(91)90160-U) [DOI] [Google Scholar]
- 40.Press WH, Teukolsky SA, Vetterling WT, Flannery BP. 1992. Numerical recipes in C: the art of scientific computing. Cambridge, UK: Cambridge University Press; (http://www.numerical-recipes.com). [Google Scholar]
- 41.Rosen PA, Tyler GL, Marouf EA, Lissauer JJ. 1991. Resonance structures in Saturn's rings probed by radio occultation II. Results and interpretation. Icarus 93, 25–44. ( 10.1016/0019-1035(91)90161-L) [DOI] [Google Scholar]
- 42.Tiscareno MS, Nicholson PD, Burns JA, Hedman MM, Porco CC. 2006. Unravelling temporal variability in Saturn's spiral density waves: results and predictions. Astrophys. J. Lett. 651, L65–L68. ( 10.1086/509120) [DOI] [Google Scholar]
- 43.Lissauer JJ. 1985. Bending waves and the structure of Saturn's rings. Icarus 62, 433–447. ( 10.1016/0019-1035(85)90186-1) [DOI] [Google Scholar]
- 44.Colwell JE, Nicholson PD, Tiscareno MS, Murray CD, French RG, Marouf EA. 2009. The structure of Saturn's rings. In Saturn from Cassini-Huygens (eds M Dougherty, L Esposito, SM Krimigis), pp. 375–412. Dordrecht, The Netherlands: Springer. [Google Scholar]
- 45.Fuller J. 2014. Saturn ring seismology: evidence for stable stratification in the deep interior of Saturn. Icarus 242, 283–296. ( 10.1016/j.icarus.2014.08.006) [DOI] [Google Scholar]
- 46.Hedman MM, Nicholson PD, Salo H. 2014. Exploring overstabilities in Saturn's A ring using two stellar occultations. Astron. J. 148, 15 ( 10.1088/0004-6256/148/1/15) [DOI] [Google Scholar]
- 47.Charnoz S, Canup RM, Crida A, Dones L. 2018. The origin of planetary ring systems. In Planetary ring systems: properties, structure, and evolution (eds MS Tiscareno, CD Murray), pp. 517–538. Cambridge, UK: Cambridge University Press. [Google Scholar]
Associated Data
This section collects any data citations, data availability statements, or supplementary materials included in this article.
Data Availability Statement
This article has no additional data.


