

Abstract
Background:
Mobile applications (apps) have become a ubiquitous source of clinical decision support. We sought to ascertain the feasibility of using an app platform to obtain a crowdsourced measure of adverse drug reaction reporting rates associated with sugammadex administration and compare it with traditionally-derived estimates.
Methods:
Using the widely-distributed anesthesia calculator app, ‘Anesthesiologist’, we surveyed anesthesia providers regarding their experience with adverse drug reactions associated with sugammadex administration.
Results:
Data were analyzed from 2770 participants in 119 countries responding between March 2016 and May 2017, who were estimated to have administered between 1.6–2.9 million doses (588–1040 administrations per participant). A low and high-end reporting rate of adverse events was estimated based on respondents’ reported frequency and duration of sugammadex use. The estimated reporting rate of anaphylaxis due to sugammadex was 0.0055–0.098%, similar in range to previously published estimates.
Conclusions:
Use of an in-app survey facilitated a global assessment of anesthesia providers and could have useful applications in monitoring adverse events and estimating their rates. Further work is needed to validate this approach for other medications and clinical domains.
Keywords: anaphylaxis, crowdsourcing, mHealth, sugammadex
Introduction
Postmarketing surveillance of adverse drug reactions (ADRs) are a critical element in the assessment of drug safety, as clinical trials performed prior to approval may not capture their full range or incidence.1 Voluntary spontaneous reporting mechanisms are used worldwide in nearly every country in the world; one example is the United States (US) Food and Drug Administration’s (FDA) Adverse Event Reporting System (FAERS). Calculating ADR rates from these sources is complicated by under-reporting bias; it is well established that such calculations are inappropriate under most circumstances given that their main intended purpose is signal detection.2–5 Given the limitations inherent with voluntary reporting systems, there is a clear push to use novel data sources to augment our ability to detect postmarketing ADRs and calculate their rates.6–8 A recently published editorial summarized the myriad approaches being used, including social media and patient-facing mobile health applications (apps) for signal detection.9
Provider-facing apps are one promising source of ADR data. Apps are widely used by both patients and healthcare workers, with 259,000 apps available across multiple sources as of 2016.10 Cloud-based techniques are being developed to use apps as platforms for two-way information exchange, providing app-based medical content on the one hand while gathering data from users on the other.11 For pharmacovigilance in particular, the Innovative Medicines Initiative WEB-RADR project is deploying apps for ADR reporting the European Union, and elsewhere, as well as investigating the value of social media in the identification of drug safety concerns.12,13
We sought to ascertain whether data collected from providers via an app platform could be used to estimate ADR rates. In particular, we were interested in exploring the rate of anaphylaxis and other ADRs associated with sugammadex administration. This drug is of interest because approval for clinical use in the US was delayed for several years primarily over concerns about hypersensitivity reactions and effects on coagulation.14 A dedicated hypersensitivity trial elucidated the incidence of anaphylaxis as 1 per 299 cases (0.33%), but other sources suggest the rate is lower.15–18 By 2015, approximately 11.5 million dose of sugammadex had been distributed in countries across Europe, Asia, and Central and South America.15,19 Therefore, we queried anesthesia providers worldwide about their experience related to this and other known ADRs. We hypothesized that the crowdsourced estimate would be consistent with existing ADR rate estimates.
Materials and methods
Ethics approval and manuscript preparation
The study was reviewed and approved by the Emory University Institutional Review Board (study number 00082571), including a waiver of written informed consent. Participants anonymously gave electronic consent before participating in any data collection. The US FDA had previously determined that the app used for this study falls into the category of ‘enforcement discretion,’ meaning that, at present, the US FDA does not intend to enforce requirements for this app under the Federal Food, Drug, and Cosmetic Act.20 This manuscript was prepared in accordance with the STROBE (STrengthening the Reporting of OBservational studies in Epidemiology) checklist for improved reporting of outcomes from observational studies.21
Data collection
A free app (‘Anesthesiologist’) for Android mobile devices, providing anesthesia references and drug calculation capabilities, was previously developed and deployed.11,22 This app was built as a clinical resource for anesthesia providers and has over 50,000 active users. The Survalytics platform was integrated with the app, enabling cloud-based delivery of survey questions and storage of survey responses and application analytics using an Amazon (Seattle, WA, USA) Web Services (AWS) database.23 Anonymized information including basic demographics (Online Resource 1, Table A), user location, and app usage data was collected. Further details regarding data collected and the methodology are available in Online Resource 1. An anonymous 10-question survey was deployed via the app; questions relevant to the work presented here are shown in Table 1. Data analyzed in the present work were collected between December 2015 and May 2017, with initial deployment of the sugammadex survey occurring in March 2016. After opting in to study participation, users were presented with survey questions upon opening the app and had the option of clicking a ‘Not now/answer later’ button to bypass the survey, in which case the most recent question was presented again with the next app activation. Only users of the app who reported access to sugammadex (Table 1, Q-02, ‘Yes’) were presented with additional questions in the survey. Only data from physicians and providers in anesthesia-related professions were used in the present analysis; data from other subjects (e.g. nurses, paramedics, medical student, pharmacists, and respiratory therapists) was discarded.
Table 1.
Survey for collection of information about sugammadex.
| Question | Responses | |
|---|---|---|
| Q-01 Introduction: In light of the recent approval of sugammadex in the United States for clinical use, we are investigating practice patterns related to the use of this drug globally. This study is for academic purposes and we have no relationship with the manufacturer(s) of sugammadex. This is a nine-question survey and should only take a few minutes to complete. We appreciate your participation. | ||
| Q-02 Do you have access to sugammadex in your clinical practice? | Yes | No, not on formulary |
| Yes, but not relevant to my practice | No, not approved in my country | |
| No or unsure, but not relevant to my practice | ||
| Q-03 How many years have you been using sugammadex? | Range: 0–10 | |
| Q-04 How many times per week would estimate you use sugammadex? | Range: 0–50 | |
| Q-09 Which of the following adverse events, suspected or proven to be sugammadex-related, have you observed in your personal clinical practice? | Anaphylaxis | Incomplete reversal of neuromuscular blockade |
| Hypersensitivity | Treatment of rocuronium/vecuronium anaphylaxis | |
| Bradycardia | Other | |
| Bronchospasm | None of the above | |
Statistical methods
Raw data from the AWS DynamoDB table were downloaded and analyzed in R v3.4.2 (R Core Team, Vienna, Austria).24,25 For calculation of confidence intervals of event rates, the Clopper–Pearson method was applied using the ‘PropCI’ R package.26 In some cases where confidence intervals were not supplied with the primary source, we performed this calculation using numbers from that source to back-calculate confidence intervals.
The significance of differences between demographic characteristics were calculated using the Wilcoxon rank-sum test. Respondents submitting the default numbers for the two questions assessing their usage (for Q-03: 5 years and for Q-04: 25 administrations per week) were assumed to represent failure to change the default position (‘straight-line answering’) rather than true responses and were excluded from the calculation. We calculated a raw ADR prevalence based on the reported number of events divided by the total number of respondents. We estimated ADR reporting rate by dividing the total number of ADRs reported by the total number of doses of sugammadex administered. Because we did not collect information from providers on the number of times that they had observed each ADR, nor did we collect information about the number of weeks per year worked, the values used for the numerator and denominator were calculated using two scenarios: (1) a high ADR/low-use scenario, in which respondents were assumed to have observed the reported ADR 10 times and to work 26 weeks per year, and (2) a low ADR/high use scenario, in which respondents were assumed to have observed each reported ADR once and to work 46 weeks per year. For the high ADR scenario, we chose to multiply the reported number of events by 10 in order to account for under-reporting bias and assume an observed event rate far in excess of the likely actual rate that an individual provider would have observed each event. Additional details are provided in Online Resource 1. We also assessed for differences in the likelihood of reporting an ADR based on the participant’s total number of administered doses, excluding participants calculated to have administered zero doses (e.g. either zero years or zero uses per week reported). In Table 4, we report the median and interquartile range of the low-use scenario number of administered doses, and significance was calculated using the Wilcoxon rank-sum test.
Table 4.
Crowdsourced estimate of the prevalence and reporting rate of adverse events associated with sugammadex administration. Low and high-end estimates of the rate were based on assumptions about how much providers worked and how many events each report (N) represented. Participants who used sugammadex more were more likely to report an ADR.
| Total respondents (N = 2770) | N | Prevalence of respondents observing an ADR | Low-end reporting rate | High-end reporting rate | Doses administered for participants not reporting this ADR low-use scenario; median [interquartile range] |
Doses administered for participants reporting this ADR low-use scenario; median [interquartile range] |
P |
|---|---|---|---|---|---|---|---|
| Anaphylaxis | 159 | 5.7% | 0.0055% | 0.098% | 182 [78–546] | 338 [156–4758] | <0.001 |
| Hypersensitivity | 109 | 3.9% | 0.0038% | 0.067% | 208 [78–520] | 728 [182–6188] | <0.001 |
| Bronchospasm | 137 | 4.9% | 0.0048% | 0.084% | 182 [78–520] | 728 [208–4212] | <0.001 |
| Bradycardia | 205 | 7.4% | 0.0071% | 0.126% | 182 [78–520] | 325 [104–1625] | <0.001 |
| Incomplete reversal of neuromuscular blockade | 202 | 7.3% | 0.0070% | 0.124% | 208 [78–520] | 312 [104–1040] | <0.001 |
| Other | 117 | 4.2% | 0.0036% | 0.072% | 208 [78–526.5] | 546 [156–5915] | <0.001 |
| Cumulative | 629 | 22.7% | 0.0218% | 0.386% | 156 [78–494] | 312 [104–1040] | <0.001 |
| Treatment of rocuronium/vecuronium anaphylaxis | 99 | 3.6% | 0.0034% | 0.061% | 208 [78–546] | 806 [260–7189] | <0.001 |
ADR, adverse drug reaction.
Results
Participant characteristics
A total of 12,450 anesthesia providers in 187 countries responded to the screening question regarding access to sugammadex and whether it was relevant to their clinical practice (Table 2; response rate = 12.5% based on an estimated maximum of 100,000 active app users). A total of 6489 (52%) anesthesia providers in 167 countries indicated they had access to sugammadex and were presented with the remainder of the survey. As users could cease answering questions at any time, there was attrition in the total number of responses recorded for each question (i.e. ‘respondent fatigue’, see Discussion); this attrition is presented in Figure 1. Characteristics associated with respondent fatigue have been analyzed separately.27 Demographic information, as available based on data collected in the basic survey (Online Resource 1, Table A), is presented in the first column of Table 3.
Table 2.
Participant self-report of availability and relevance of sugammadex to their practice.
| Q-02 Do you have access to sugammadex in your clinical practice? | Yes | Yes, but not relevant to my practice | No, not on formulary | No, not approved in my country | No or unsure, but not relevant to my practice | Sum |
|---|---|---|---|---|---|---|
| Physician: Attending/Consultant | 2227 (52.2%) | 267 (6.3%) | 827 (19.4%) | 664 (15.6%) | 282 (6.6%) | 4267 |
| Physician: Fellow/Resident/Registrar | 1610 (47.9%) | 172 (5.1%) | 718 (21.4%) | 563 (16.8%) | 298 (8.9%) | 3361 |
| Anesthesia assistant (PA) or Nurse anesthetist (CRNA) |
1864 (54.8%) | 197 (5.8%) | 691 (20.3%) | 421 (12.4%) | 231 (6.8%) | 3404 |
| Student anesthesia assistant (PA) or nurse anesthetist (CRNA) |
274 (52.2%) | 37 (7%) | 111 (21.1%) | 51 (9.7%) | 52 (9.9%) | 525 |
| Technically trained in anesthesia | 94 (41.8%) | 19 (8.4%) | 37 (16.4%) | 48 (21.3%) | 27 (12%) | 225 |
| Anesthesia technician | 420 (62.9%) | 48 (7.2%) | 55 (8.2%) | 81 (12.1%) | 64 (9.6%) | 668 |
| Sum | 6489 | 740 | 2439 | 1828 | 954 | 12,450 |
CRNA, certified registered nurse anesthetist; PA, physician’s assistant.
Figure 1.
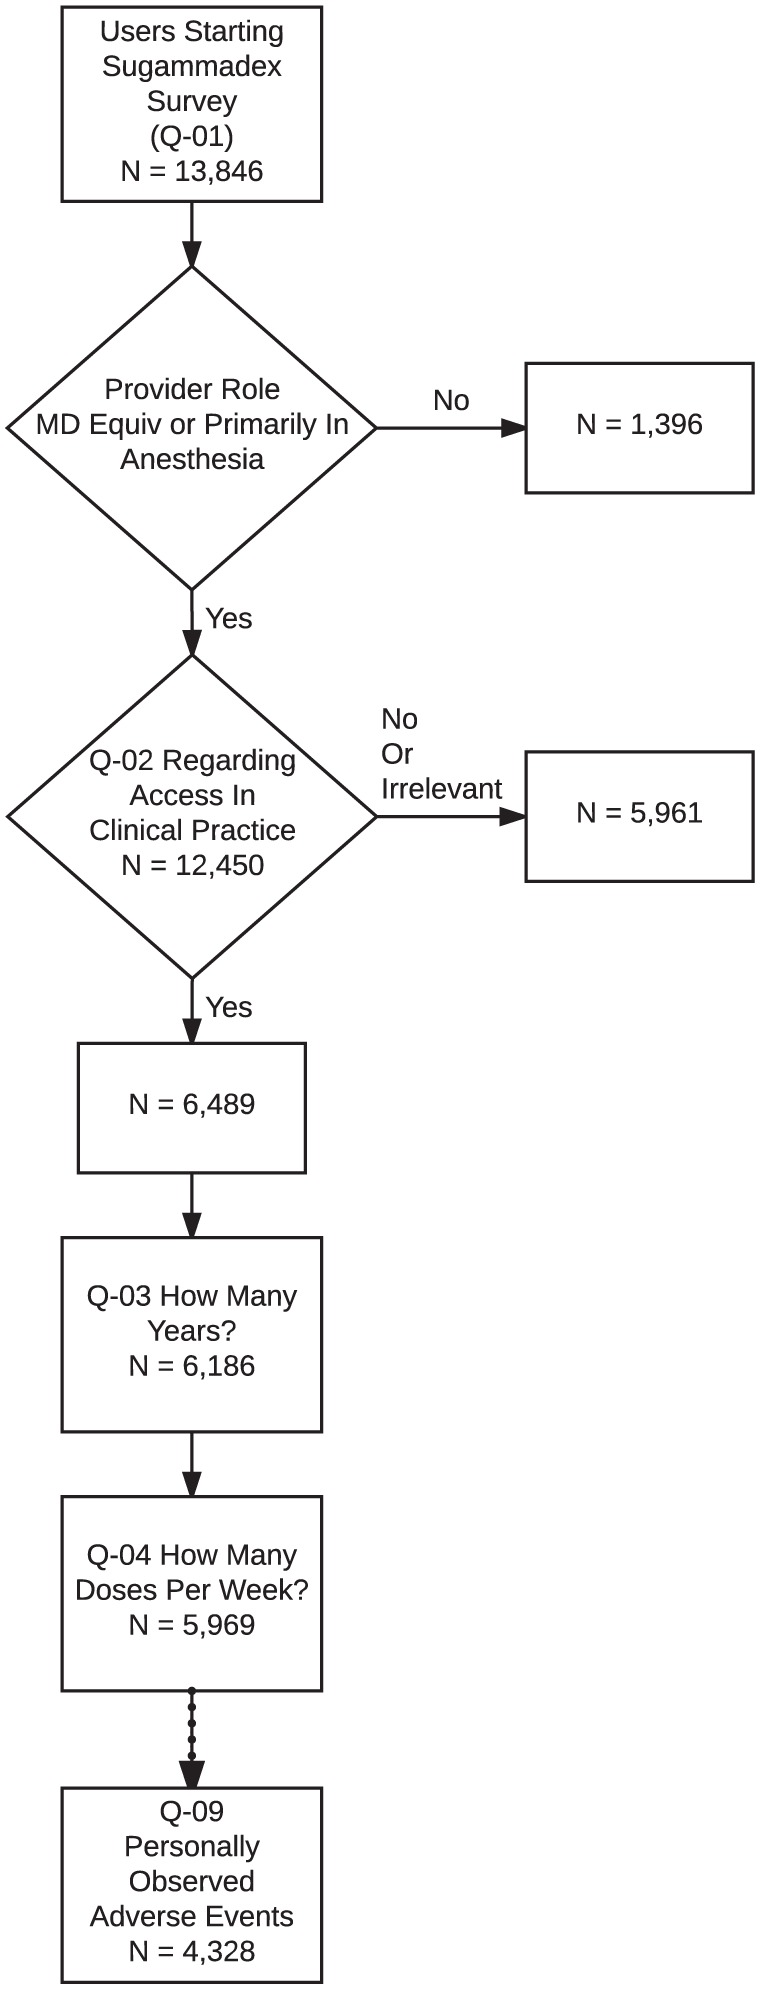
Number of participants providing answers to each question in the sugammadex survey. Respondent fatigue led to attrition in the total number of responses collected for Q-03 versus Q-10.
Table 3.
Demographic characteristics of study participants.
| Characteristic | Respondents starting survey | Respondents analyzed for ADR data | P |
|---|---|---|---|
| Country income | 6486 | 2768 | |
| High income | 2923 (45.1%) | 1749 (63.2%) | 0.008 |
| Upper middle income | 2099 (32.4%) | 734 (26.5%) | |
| Lower middle income | 1303 (20.1%) | 272 (9.8%) | |
| Low income | 161 (2.5%) | 13 (0.5%) | |
| Provider type | 6489 | 2770 | |
| Physician | 2227 (34.3%) | 1042 (37.6%) | <0.001 |
| Physician trainee | 1610 (24.8%) | 897 (32.4%) | |
| Anesthesia assistant (PA) or nurse anesthetist (CRNA) |
1864 (28.7%) | 669 (24.2%) | |
| Student anesthesia assistant (PA) or nurse anesthetist (CRNA) |
274 (4.2%) | 75 (2.7%) | |
| Technically trained in anesthesia | 94 (1.4%) | 15 (0.5%) | |
| Anesthesia tech | 420 (6.5%) | 72 (2.6%) | |
| Importance (binomial) | 4137 | 1977 | |
| Absolutely essential/very important | 1774 (42.9%) | 751 (38%) | 0.125 |
| Average or below | 2363 (57.1%) | 1226 (62%) | |
| Length of practice | 2977 | 1593 | |
| 0–5 Years | 1208 (40.6%) | 705 (44.3%) | 0.008 |
| 6–10 Years | 558 (18.7%) | 355 (22.3%) | |
| 11–20 Years | 541 (18.2%) | 276 (17.3%) | |
| >21 Years | 670 (22.5%) | 257 (16.1%) | |
| Practice size (grouped) | 3873 | 1845 | |
| Solo | 1589 (41%) | 571 (30.9%) | 0.008 |
| Small group <10 | 787 (20.3%) | 343 (18.6%) | |
| Medium group 10–25 | 471 (12.2%) | 293 (15.9%) | |
| Large group >25 | 1026 (26.5%) | 638 (34.6%) | |
| Practice model | 3558 | 1750 | |
| Physician only | 1243 (34.9%) | 527 (30.1%) | <0.001 |
| Physician supervised, anesthesiologist on site | 1587 (44.6%) | 926 (52.9%) | |
| Physician supervised, non-anesthesiologist on site | 236 (6.6%) | 87 (5%) | |
| Physician supervised, no physician on site | 139 (3.9%) | 54 (3.1%) | |
| No physician supervision | 193 (5.4%) | 95 (5.4%) | |
| Not an anesthesia provider | 160 (4.5%) | 61 (3.5%) | |
| Primary community served | 3502 | 1733 | |
| Urban | 2163 (61.8%) | 1208 (69.7%) | 0.031 |
| Suburban | 574 (16.4%) | 291 (16.8%) | |
| Rural | 765 (21.8%) | 234 (13.5%) | |
| Practice type | 3592 | 1757 | |
| Private clinic or office | 652 (18.2%) | 160 (9.1%) | <0.001 |
| Local health clinic | 323 (9%) | 121 (6.9%) | |
| Ambulatory surgery center | 147 (4.1%) | 43 (2.4%) | |
| Small community hospital | 403 (11.2%) | 234 (13.3%) | |
| Large community hospital | 1082 (30.1%) | 598 (34%) | |
| Academic department/university hospital | 985 (27.4%) | 601 (34.2%) |
ADR, adverse drug reaction; CRNA, certified registered nurse anesthetist; PA, physician’s assistant.
Reporting rate of ADRs related to sugammadex administration
In addition to respondent fatigue, we also observed an unexpectedly large number of responses where the sliding-bar response mechanism used to collect the answer to Q-03 and Q-04 were not changed from their default positions (‘straight-line’ answering). For Q-03, 2329 (35.9%) of participants entered the default response of 5 years. For Q-04, 1966 (30.3%) of participants entered the default response of 25 administrations per week. Together, this represented data from 2679 (41.3%) respondents. After excluding responses from these respondents, data from 2770 participants in 119 countries were available for analysis. The demographic characteristics of this subset of participants is presented in the second column of Table 3. As seen in Online Resource 1, Figure A, the majority of providers participating in the survey used sugammadex less than five times per week and had used it for less than 3 years.
Collectively, participants had administered an estimated 1.6–2.9 million doses of sugammadex, or 588–1040 administrations per participant. As shown in Table 4, participants who had administered a greater number of doses of sugammadex were more likely to have reported an ADR in this survey. The ranges for the estimated reporting rate of sugammadex-related ADRs are reported in Table 4. Anaphylaxis rates were estimated to be between 1:1000 and 1:20,000 (0.005–0.098%). Bradycardia and incomplete reversal of neuromuscular blockade (NMB) were the most common events reported, with a high-end estimated rate of approximately 1:500. Hypersensitivity and bronchospasm were less common than anaphylaxis. A small number of users reported off-label use of sugammadex to treat anaphylaxis caused by rocuronium or vecuronium. Overall, a cumulative 22.7% of participants reported observing an ADR associated with sugammadex administration.
Discussion
Using an app-based approach, we surveyed more than 6000 anesthesia providers in 167 countries. Responses from nearly 3000 users were used and accounted for an estimated 1.6–2.9 million doses of sugammadex administered. We found that a small minority of providers (5.7%) reported that they had encountered an anaphylactic reaction. This crowdsourced data yielded an estimated rate of 1:1000–1:20,000 for anaphylaxis to sugammadex. The most commonly reported ADRs were bradycardia and incomplete reversal of NMB.
Several approaches have previously been taken to characterize the rate of anaphylaxis to sugammadex. Those rate estimates are summarized in Figure 2. Postmarketing surveillance relies on voluntary reporting by healthcare professionals and consumers, which is subject to under-reporting and is therefore unreliable for the calculation of ADR frequency.3 Even so, the postmarketing data for sugammadex has been used to support its safety profile. A presentation on sugammadex to the US FDA Advisory Committee notes that 273 cases of anaphylaxis were reported in postmarketing surveillance for 11.5 million doses distributed.15 Using these data, a rate of 24 per 100,000 (0.024%) was suggested using the following assumptions: 95% of distributed vials were used and only 10% of cases were reported.15 There were two other estimated anaphylaxis rates that were cited in that presentation: (1) an upper limit on the rate of 0.1% based on pooled phase I–III data with no cases of anaphylaxis in N = 3519 patients, and (2) a rate of 0.33% based on the clinical trial requested by the US FDA, in which one patient had anaphylaxis out of N = 299 patients (notably, the Clopper–Pearson 95% confidence interval for that study puts the rate between 0.0085% and 1.9%, an interval too wide to be of value in clinical decision-making). A recently published study by Miyazaki and colleagues reported an estimated anaphylaxis rate of 0.059%, with a 95% confidence interval of 0.032–0.1%.17 At our institution, we have observed just one case of anaphylaxis in 5321 administrations, yielding a confidence interval of 0.004–0.135%. Comparison of these rates demonstrates that the app-based approach is consistent with rates estimated by these other methods. That participants who had used sugammadex more were more likely to have observed an ADR lends further strength to our findings; given that our survey would have only captured prevalent events, it would be expected that increasing usage of the drug would increase the likelihood of observing an ADR related to that drug.
Figure 2.

Comparison of the rates of anaphylaxis to sugammadex from previously published sources and from our estimate. As the estimated incidences span several orders of magnitude, the figure is plotted on a log scale. Where one was calculated, the raw incidence is marked and the Clopper–Pearson range is added. For the pooled phase I–III findings, the event rate was 0, so the Clopper–Pearson range provides the upper limit indicated (the lower limit is zero). For the app-based estimate, the mean reporting rate is marked with a star.
Another potential source of internal validation to this study would have been the ability to compare reporting rates for other ADRs. Unfortunately, anaphylaxis is the most well studied of the ADRs associated with sugammadex. The only other ADR for which there is publicly available information is the reporting rate of bradycardias associated with sugammadex that were presented to the US FDA Advisory Panel by the manufacturer. We used this to calculate a Clopper–Pearson confidence interval, and present the comparison in the Online Resource, Figure B. Of note, in the presentation, bradycardias had fewer spontaneously reported events than anaphylaxis. In our survey, we found bradycardia events to be more commonly reported. It could be that prompting led more respondents to recall a specific bradycardia event, whereas this potentially less impactful ADR is under-reported on a spontaneous basis. This is a speculative conclusion that requires further work to truly understand.
A few of our findings merit further discussion. First, 99 providers reported using sugammadex to treat allergic reactions due to rocuronium or vecuronium. This off-label use of sugammadex has been described in a number of case reports but is controversial and cannot be recommended without additional formal investigation.28 Second, 7% of respondents (N = 202) had observed residual NMB with sugammadex usage. We have previously reported that cost concerns were the dominant force in provider decision-making about sugammadex use.29 As residual blockade is known to occur when sugammadex is under-dosed, a speculative conclusion regarding this finding is that cost concerns could drive under-dosing and an increased frequency of residual blockade.30,31 Finally, a number of providers reported ‘other’ ADRs not listed in the question. For simplicity of the survey instrument and to encourage maximum thoughtful response rate, we did not follow up on this. However, our survey could easily be modified to follow up with open-ended questions regarding the ADR report, potentially extending the value of this approach to signal detection of rare and otherwise unrecognized ADRs.
Of interest in future investigations will be the rate at which data can be collected using this methodology. This will be highly dependent on the type of app, the frequency with which it is used, the target audience (e.g. for patient care providers), and the total user base. After all screening and filtering, we obtained 2770 responses over a 15 month period, or 184 responses per month. Further work is necessary to understand how generalizable our findings are to other apps in terms of ability to collect data and the speed of data collection. Another area of future investigation will be the capacity for this methodology to assess geographic distributions of ADRs. Our data were too limited to reach any conclusions about geographic variance in ADR distribution due to the possibility of sampling bias (see Online Resource, Table B).
This exploratory approach to estimate the reporting rate of ADRs has several limitations. Primarily, our approach is likely biased in several ways, and the absence of methodologically similar comparator data is an important limitation in this context. The low-end estimate is likely biased towards underestimation. Respondents may not have recalled or recognized a sugammadex associated ADR, resulting an artificially low numerator. As a relatively new drug, sugammadex usage is likely to have been increasing over time. However, collected responses may reflect more recent utilization, not the average historic utilization. This source of recall bias would result in an artificially large denominator.
The high-end estimate, on the other hand, is likely biased towards overestimating the event rate: we severely discounted the time providers are likely to have worked, and even though some respondents may have observed events more than once, the model uses a generous reported to actual multiplier of 10. Therefore, the true rate of anaphylaxis most likely lies somewhere within our reporting range of 0.005–0.1%.
Another limitation is that the app serving as the platform is primarily used as a reference for pediatric patients, and providers using the app may skew towards pediatric specialists.11 This is an important consideration as sugammadex may see less use in this patient population due to less frequent NMB agent use.32 In the US and several other countries, sugammadex has off-label status for patients younger than 17 years old.33 Withdrawal bias may have influenced our results as there were statistically significant differences between the population of users starting the survey and those providing enough/appropriate data for use in the final calculation of ADR rate.
One source of selection bias may be due to the relatively low survey response rate. Another source of selection bias may be due to exclusive use of the Android platform. Prior reports suggest that there do not appear to be significant personality differences between users of Android versus iOS operating systems.34 Android devices occupied 82% of the global smartphone market35 in 2016, but with higher relative penetration of the generally more expensive devices running iOS in high-income countries.36 Therefore, differences in participant income or other unaccounted-for variables could skew the app user base and introduce confounding.
We observed respondent fatigue in our survey. A term from the survey literature, respondent fatigue describes situations in which respondents fail to complete the survey or provide less than completely thoughtful answers to questions in the survey, particularly with questions placed towards the end of the instrument.37 Respondent fatigue potentially introduces bias into the survey results in that the missing data may not be occurring at random. An analysis of our findings related to respondent fatigue demonstrated that specific demographic categories were associated with respondent fatigue (measured by the failure to complete a secondary survey).27 In order to minimize respondent fatigue, we limited the number of questions and restricted ourselves to multiple choice questions and sliding-bar responses.
Conclusion
Even in light of clear limitations, using an app-based approach to assess ADR rates appeared to recapitulate the estimate of a significant ADR obtained by other methods. In particular, several studies (including ours) have now found a rate of anaphylaxis to sugammadex significantly lower than the rate listed in the package insert. Our work demonstrates the potential feasibility of using app-based surveys for postmarketing ADR signal detection and calculation of an ADR reporting rate. If validated, and subject to the limitations discussed, app-based surveys may be a useful novel data stream in the identification of drug administration patterns, monitoring of utilization rates, and detection and characterization of ADRs by tapping into the experience of healthcare professionals regionally and globally.
Key points
The reporting rate of anaphylaxis due to sugammadex, based on the app-based crowdsourced data, was estimated to be not more than 0.1%. This estimate carries substantial limitations in accuracy, but was consistent with previously reported estimates using other, more standard approaches.
App-based approaches may be valuable adjuncts to other traditional and developing sources of information for adverse event signal detection and assessment of reporting rates for adverse events.
Supplemental Material
Supplemental material, Supplement for Crowdsourcing sugammadex adverse event rates using an in-app survey: feasibility assessment from an observational study by Craig S. Jabaley, Francis A. Wolf, Grant C. Lynde and Vikas N. O’Reilly-Shah in Therapeutic Advances in Drug Safety
Acknowledgments
Craig Jabaley and Francis Wolf contributed equally to this work.
George Easton (Associate Professor of Information Systems & Operations Management, Goizueta Business School, Emory University, Atlanta, GA, USA) developed the methodology for calculating the frequency of app use.
Scott Gillespie (Senior Biostatistician, Emory University School of Medicine. Atlanta, GA, USA) provided the R code for mapping provider country of origin income level and provided statistical advice with regards to handling of the calculation of adverse event prevalence and incidence.
For critically reading and commenting on the manuscript, we thank: W. Timothy Garvey, Professor and Chair, Department of Nutrition Sciences, University of Alabama, Birmingham, USA and Daniel Green, Epidemiology and Cancer Control, St. Jude Children’s Research Hospital
The study was reviewed and approved by the Emory University Institutional Review Board (study number 00082571), including a waiver of written informed consent. Participants anonymously gave electronic consent before participating in any data collection. The US FDA had previously determined that the app used for this study falls into the category of ‘enforcement discretion,’ meaning that, at present, the US FDA does not intend to enforce requirements for this app under the Federal Food, Drug, and Cosmetic Act
Footnotes
Authors’ note: Craig S. Jabaley and Francis A. Wolf contributed equally to this article.
Funding: This research received no specific grant from any funding agency in the public, commercial, or not-for-profit sectors. The Emory University Department of Anesthesiology generously supported the time of the authors in producing this work.
Conflict of interest statement: All authors declare: no support from any organization for the submitted work; no financial relationships with any organizations that might have an interest in the submitted work in the previous 3 years; no other relationships or activities that could appear to have influenced the submitted work. The app was initially released in 2011 by Vikas O’Reilly-Shah with advertising in the free version and a paid companion app to remove the ads. The app intellectual property was transferred to Emory University in 2015 and advertisements were subsequently removed, and the companion app to remove ads made freely available for legacy users not updating to the ad-free version. Following review by the Emory University Research Conflict of Interest Committee, Vikas O’Reilly-Shah has been released from any conflict of interest management plan or oversight.
Supplementary material: Supplementary material is available for this article online.
ORCID iD: Vikas N. O’Reilly-Shah  https://orcid.org/0000-0003-0741-0291
Contributor Information
Craig S. Jabaley, Department of Anesthesiology, Emory University School of Medicine, Atlanta, GA, USA
Francis A. Wolf, Department of Anesthesiology, Emory University School of Medicine, Atlanta, GA, USA
Grant C. Lynde, Department of Anesthesiology, Emory University School of Medicine, Atlanta, GA, USA
Vikas N. O’Reilly-Shah, Emory University and Children’s Healthcare of Atlanta, 3B South, 1364 Clifton Road NE, Atlanta, GA 30322, USA.
References
- 1. Hoffman KB, Dimbil M, Tatonetti NP, et al. A pharmacovigilance signaling system based on FDA regulatory action and post-marketing adverse event reports. Drug Saf 2016; 39: 561–575. [DOI] [PubMed] [Google Scholar]
- 2. Ahmad SR. Adverse drug event monitoring at the food and drug administration. J Gen Intern Med 2003; 18: 57–60. [DOI] [PMC free article] [PubMed] [Google Scholar]
- 3. Food and Drug Administration. Questions and answers on FDA’s Adverse Event Reporting System (FAERS). http://www.webcitation.org/6pk7d3aFs (2016, accessed 14 April 2017).
- 4. Rawlins MD. Spontaneous reporting of adverse drug reactions. II: Uses. Br J Clin Pharmacol 1988; 26: 7–11. [DOI] [PMC free article] [PubMed] [Google Scholar]
- 5. Bate A, Evans SJ. Quantitative signal detection using spontaneous ADR reporting. Pharmacoepidemiol Drug Saf 2009; 18: 427–436. [DOI] [PubMed] [Google Scholar]
- 6. Tatonetti NP, Ye PP, Daneshjou R, et al. Data-driven prediction of drug effects and interactions. Sci Transl Med 2012; 4: 125ra31. [DOI] [PMC free article] [PubMed] [Google Scholar]
- 7. Liu R, AbdulHameed MDM, Kumar K, et al. Data-driven prediction of adverse drug reactions induced by drug-drug interactions. BMC Pharmacol Toxicol 2017; 18: 44. [DOI] [PMC free article] [PubMed] [Google Scholar]
- 8. Huesch MD. Commercial online social network data and statin side-effect surveillance: a pilot observational study of aggregate mentions on facebook. Drug Saf 2017; 40: 1199–1204. [DOI] [PubMed] [Google Scholar]
- 9. Bate A, Reynolds RF, Caubel P. The hope, hype and reality of big data for pharmacovigilance. Ther Adv Drug Saf 2018; 9: 5–11. [DOI] [PMC free article] [PubMed] [Google Scholar]
- 10. research2guidance. mHealth App Developer Economics 2016. https://research2guidance.com/r2g/r2g-mHealth-App-Developer-Economics-2016.pdf (2016, accessed 10 March 2017).
- 11. O’Reilly-Shah V, Easton G, Gillespie S. Assessing the global reach and value of a provider-facing healthcare app using large-scale analytics. BMJ Global Health 2017; 2: e000299. [DOI] [PMC free article] [PubMed] [Google Scholar]
- 12. Ghosh R, Lewis D. Aims and approaches of Web-RADR: a consortium ensuring reliable ADR reporting via mobile devices and new insights from social media. Expert Opin Drug Saf 2015; 14: 1845–1853. [DOI] [PubMed] [Google Scholar]
- 13. de Vries ST, Wong L, Sutcliffe A, et al. Factors influencing the use of a mobile app for reporting adverse drug reactions and receiving safety information: a qualitative study. Drug Saf 2017; 40: 443–455. [DOI] [PMC free article] [PubMed] [Google Scholar]
- 14. Brull SJ, Kopman AF. Current status of neuromuscular reversal and monitoring: challenges and opportunities. Anesthesiology 2017; 126: 173–190. [DOI] [PubMed] [Google Scholar]
- 15. Merck Research Laboratories. FDA Advisory Committee meeting materials, https://www.fda.gov/downloads/AdvisoryCommittees/CommitteesMeetingMaterials/Drugs/AnestheticAndAnalgesicDrugProductsAdvisoryCommittee/UCM472741.pdf (2015, accessed 10 March 2017).
- 16. Tsur A, Kalansky A. Hypersensitivity associated with sugammadex administration: a systematic review. Anaesthesia 2014; 69: 1251–1257. [DOI] [PubMed] [Google Scholar]
- 17. Miyazaki Y, Sunaga H, Kida K, et al. Incidence of anaphylaxis associated with sugammadex. Anesth Analg 2018; 126: 1505–1508. [DOI] [PubMed] [Google Scholar]
- 18. ClinicalTrials.gov. A Study to Evaluate the Incidence of Hypersensitivity After Administration of Sugammadex in Healthy Participants (MK-8616-101) - Study Results, http://www.webcitation.org/6orJxN2Mr (2015, accessed 10 March 2017).
- 19. Welliver M, Cheek D, Osterbrink J, et al. Worldwide experience with sugammadex sodium: implications for the United States. AANA J 2015; 83: 107–115. [PubMed] [Google Scholar]
- 20. Food and Drug Administration. Mobile medical applications: guidance for industry and food and drug administration staff, http://www.webcitation.org/6lZh1yUag (2015, accessed 27 October 2016).
- 21. vonElm E Altman DG Egger M et al. The Strengthening the Reporting of Observational Studies in Epidemiology (STROBE) statement: guidelines for reporting observational studies. J Clin Epidemiol 2008; 61: 344–349. [DOI] [PubMed] [Google Scholar]
- 22. O’Reilly-Shah V. Anesthesiologist - Android Apps on Google Play, http://www.webcitation.org/6pk7ggpmJ (2011, accessed 10 March 2017).
- 23. O’Reilly-Shah V, Mackey S. Survalytics: an open-source cloud-integrated experience sampling, survey, and analytics and metadata collection module for android operating system apps. JMIR Mhealth Uhealth 2016; 4: e46. [DOI] [PMC free article] [PubMed] [Google Scholar]
- 24. R Core Team. R: a language and environment for statistical computing [Internet]. Vienna, Austria: R Foundation for Statistical Computing, http://www.R-project.org/ (2015, accessed 27 October 2016). [Google Scholar]
- 25. Ooms J. The jsonlite package: a practical and consistent mapping between JSON data and R objects. arXiv:1403. 2805 [stat. CO] http://arxiv.org/abs/1403.2805 (2014, accessed 27 October 2016).
- 26. Scherer R. PropCIs: various confidence interval methods for proportions, https://CRAN.R-project.org/package=PropCIs (2014, accessed 27 October 2016).
- 27. O’Reilly-Shah VN. Factors influencing healthcare provider respondent fatigue answering a globally administered in-app survey. PeerJ 2017; 5: e3785. [DOI] [PMC free article] [PubMed] [Google Scholar]
- 28. Takazawa T, Mitsuhata H, Mertes PM. Sugammadex and rocuronium-induced anaphylaxis. J Anesth 2015; 30: 290–297. [DOI] [PMC free article] [PubMed] [Google Scholar]
- 29. O’Reilly-Shah VN, Wolf FA, Jabaley CS, et al. Using a worldwide in-app survey to explore sugammadex usage patterns: a prospective observational study. Br J Anaesth 2017; 119: 333–335. [DOI] [PubMed] [Google Scholar]
- 30. Kotake Y, Ochiai R, Suzuki T, et al. Reversal with sugammadex in the absence of monitoring did not preclude residual neuromuscular block. Anesth Analg 2013; 117: 345–351. [DOI] [PubMed] [Google Scholar]
- 31. Yamamoto S, Yamamoto Y, Kitajima O, et al. Reversal of neuromuscular block with sugammadex: a comparison of the corrugator supercilii and adductor pollicis muscles in a randomized dose-response study. Acta Anaesthesiol Scand 2015; 59: 892–901. [DOI] [PubMed] [Google Scholar]
- 32. Nauheimer D, Fink H, Fuchs-Buder T, et al. Muscle relaxant use for tracheal intubation in pediatric anaesthesia: a survey of clinical practice in Germany. Paediatr Anaesth 2009; 19: 225–231. [DOI] [PubMed] [Google Scholar]
- 33. Bridion® (sugammadex) Injection, for intravenous use. Highlights of Prescribing Information. Whitehouse Station, NJ: Merck Sharp & Dohme Corp; http://www.webcitation.org/6pfxZCxIU (2015, accessed 12 April 2017). [Google Scholar]
- 34. Götz FM, Stieger S, Reips U-D. Users of the main smartphone operating systems (iOS, Android) differ only little in personality. PLoS One 2017; 12: e0176921. [DOI] [PMC free article] [PubMed] [Google Scholar]
- 35. Gartner Inc. Gartner says five of top 10 worldwide mobile phone vendors increased sales in second quarter of 2016, http://www.webcitation.org/6pk794fVC (2016, accessed 15 April 2017).
- 36. 9to5Mac. iPhone market share grows 6.4% in USA, takes share from Android in most markets, http://www.webcitation.org/6pk7OR7oi (2017, accessed 15 April 2017).
- 37. Ben-Nun P. Respondent fatigue. In: Lavrakas PJ. (ed) Encyclopedia of survey research methods. Thousand Oaks, CA: Sage Publications, 2008, pp. 742–743. [Google Scholar]
Associated Data
This section collects any data citations, data availability statements, or supplementary materials included in this article.
Supplementary Materials
Supplemental material, Supplement for Crowdsourcing sugammadex adverse event rates using an in-app survey: feasibility assessment from an observational study by Craig S. Jabaley, Francis A. Wolf, Grant C. Lynde and Vikas N. O’Reilly-Shah in Therapeutic Advances in Drug Safety