Abstract
The ability to influence stem cell differentiation is highly desirable as it would help us improve clinical outcomes for patients in various aspects. Many different techniques to achieve this have previously been investigated. This concise study, however, has focused on the topography on which cells grow. Current uncemented orthopaedic implants can fail if the implant fails to bind to the surrounding bone and, typically, forms a soft tissue interface which reduces direct bone contact. Here, we look at the effect of a previously reported nanotopography that utilises nanodisorder to influence mesenchymal stromal cell (as may be found in the bone marrow) differentiation towards bone and to also exert this effect on mature osteoblasts (as may be found in the bone). As topography is a physical technique, it can be envisaged for use in a range of materials such as polymers and metals used in the manufacture of orthopaedic implants.
Keywords: Topography, stem cell, differentiate, osteogenic, orthopaedic
Introduction
In recent years, there has been a significant amount of research into the ability to influence the differentiation of mesenchymal stromal cells (MSCs) into specific cell lineages using approaches which utilise materials such as control of stiffness,1 chemistry2 and topography.3 One area of particular interest is the influence the topographical environment has on MSC differentiation. MSCs have the potential to differentiate into a number of functional cells including reticular, adipogenic, chondrogenic and osteoblastic cells.4
The ability to influence MSC differentiation has many in vivo implications.5 When considering the field of orthopaedic surgery, if MSCs were to differentiate into soft tissues rather than bone, this could result in aseptic loosening requiring revision surgery in the uncemented, weight-bearing implant and poorer joint mobility in the non-weight-bearing implant.3 Thus, the development of materials that would encourage osteogenesis would be beneficial to this field.
Cells are influenced by the topographical features of their surrounding environments. In vivo this includes a variety of different structures including collagens and proteins.6 The growth of the microelectronics sector has facilitated the development of approaches that can be used to study the role of nanoscale topographies in vitro.7 For example, electron beam lithography (EBL) can be used to create ultra-precise arrays of nanoscale features down to the scale of 10 nm in X and Y.3
Recent studies have illustrated that the positioning of nanoscale pits originally defined by EBL in silicon but then reproduced in biocompatible polymers such as polymethylmethacrylate (PMMA) and polycaprolactone (PCL) can be used to guide MSC growth8 and differentiation.3 This concise study was designed to extend in vitro testing of a nanotopography with osteoinductive properties.
Current thinking shows that MSCs differentiate towards osteoblast lineage through adhesion elongation9 and increased intracellular tension10,11 driving the activation of osteo-specific transcription factors such as RUNX212 through phosphorylation.
We test this in SaOS2 populations looking at adhesion formation, cytoskeletal organisation, myosin activation (phosphorylation – pSer 19 chosen, as it is phosphorylated by Rho-A kinase (ROCK) that is implicated in osteogenesis through cytoskeletal contraction)10 and RUNX2 compartmentalisation. Furthermore, we also look for the longer-term osteogenic marker, osteopontin (OPN), to check that changes at the adhesion and cytoskeletal tension levels translate to changes in osteogenic phenotype.
Methods and materials
Material preparation
The shims for the substrates used in this project were made using EBL and nickel die fabrication, as described in detail in other studies.13 In brief, the master shim, NSQ 50 pattern, was fabricated to form an array of pits 120 nm in diameter and 100 nm in depth with a random displacement of ±50 nm, maintaining an average 300 nm pitch. See Figure 1. Nickel dies were made directly from the patterned resist samples and a 50-nm layer of nickel–vanadium (NiV) was sputter coated on the samples by electroplating. The dies were plated to approximately 300 μm thickness.
Figure 1.
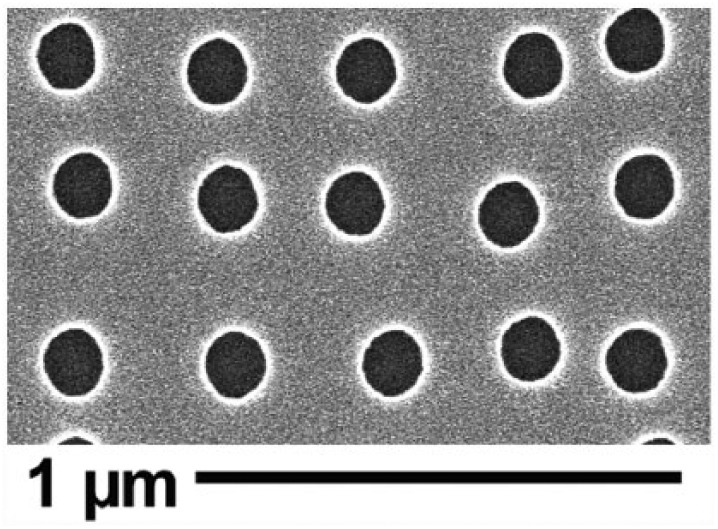
SEM of NSQ 50 nanotopography showing EBL-fabricated pits that are 120 nm in diameter and 100 nm in depth arranged in a disordered array where pits are randomly offset from the centre position by up to 50 nm on both the X- and Y-axes in relation to a true square position with 300-nm centre–centre spacing.
The protective polyurethane coating was stripped using chloroform in an ultrasound bath for 15 min. Polymer replication on PCL was done by thumb embossing by heating the PCL beads at 80°C and then pressing onto the master NSQ 50 shim or a flat control shim. The substrates were then plasma treated in ambient air at 30 W power for 20 seconds (Harrick PDC-002; Harrick Plasma Ltd, NY, USA), to improve hydrophilicity, followed by disinfection in 70% ethanol for at least 30 min and serial washes in phosphate-buffered saline (PBS) and then in Dulbecco’s Modified Eagle’s medium (DMEM; described below) before placement in 24-well plates.
Cell culture
Cells used in this project included MSCs as a topographical control and the SaOS2 cell line as a mature osteoblast model. MSCs were isolated from the bone marrow obtained from total hip replacement residual tissue with the cells selected by plastic adhesion, a recognised selection method,14 from two donors: one for cytoskeleton staining and one for phenotypic testing. All cells were grown in T75 vented tissue culture flasks within a humidified incubator at 37°C with 5% CO2. In basal media DMEM (Sigma) supplemented with 10% foetal bovine serum (FBS; Sigma), 1% (v/v) 200 mM L-glutamine (Gibco), 11 mg/mL 1% sodium pyruvate (Sigma), 1% Minimum Essential Medium non-essential amino acid (MEMNEAA; Gibco) solution and 2% antibiotics (6.74 U/mL penicillin–streptomycin, 0.2 μg/mL Fungizone; Sigma). Culture medium was changed twice weekly and cell growth was examined visually under a light microscope.
Cell density was maintained at 70% by passaging the cells every 3–5 days, depending on cell line. Cells were washed twice with filtered 4-(2-hydroxyethyl)-1-piperazineethanesulfonic acid (HEPES) saline solution (0.01 M). The cells were detached by adding trypsin/ethylenediaminetetraacetic acid (EDTA) solution and incubated for 3 min at 37°C. The reaction was stopped by the addition of the culture medium. Finally, after cell count, the cells were transferred to a new flask with a fresh medium or seeded on surfaces.
Cell seeding
All surfaces were sterilised by washing with 1× PBS (three times), once with HEPES saline solution (0.01 M) and once with DMEM, and then transferred to a sterile 24-well plate. The cells were seeded at 1000 cells/cm2.The incubation time was 3, 7, 21 or 28 days, according to the experiment type with cells fed twice per week.
Immunocytochemistry
For immunocytochemistry, SaOS2 and MSCs were seeded on topographies for the required time for the different experiments. The samples were fixed at 37°C for 15 min using a 10% formaldehyde fixative solution and the cells were permeabilised at 4°C for 5 min using 0.5% Triton X-100 Perm Buffer. In order to block non-specific binding, 1% (w/v) bovine serum albumin (BSA) in PBS was added, and the cells were incubated at 37°C for 5 min. After fixation and permeabilisation, the cells were stained using [1:50] dilution anti-vimentin (Sigma), anti-tubulin (Sigma), (Abcam), p-RUNX2 (Thermo Fisher), anti-vinculin (clone hVIN-1; Sigma) [1:150], p-myosin light chain (Phospho Ser 19; Cell Signalling) [1:100] or anti-OPN (1:100 in 1% BSA/PBS AKm2A1 (OPN; Autogen Bioclear, UK) in 1% (w/v) BSA/PBS) and rhodamine-conjugated phalloidin (Molecular Probes) [1:200] in 1% (w/v) BSA/PBS that binds and stains actin.
Hence, osteocalcin (OCN; mouse monoclonal antibody [1:50] in PBS; sc-73464, Santa Cruz Biotechnology) was used for MSC immunofluorescence and OPN (as above) for SaOS2 quantification. Three material replicates were used in this process.
The samples were incubated at 37°C for 1 h and subsequently washed three times for 5 min in 1× PBS/0.5% Tween-20. A secondary biotinylated anti-mouse antibody (Vector Laboratories) was added [1:50] in 1% (w/v) BSA/PBS and the samples were incubated at 37°C for 1 h. The samples were washed as before and incubated with fluorescein isothiocyanate (FITC)-conjugated streptavidin (Vector Laboratories) [1:50] in 1% (w/v) BSA/PBS at 4°C for 30 min. Finally, the samples were washed again and mounted using VECTASHIELD mountant with 4′,6-diamidino-2-phenylindole (DAPI) nuclear stain (Vector Laboratories). Protein intensity visualisation was performed by a fluorescence microscope (Zeiss Axiovert 200M, 10× magnification, numerical aperture (NA): 0.5).
ImageJ software was used for data acquisition of OPN staining intensity, using the three material replicates with five areas imaged on each, from the control and NSQ50 substrates.
Statistical analysis
After analysis by ImageJ software, statistical analysis for OPN integrated intensity was performed by the Mann–Whitney U test where *** represents p < 0.001.
Ethics
Ethics were granted by Greater Glasgow and Clyde NHS Biorepository.
Results
MSCs
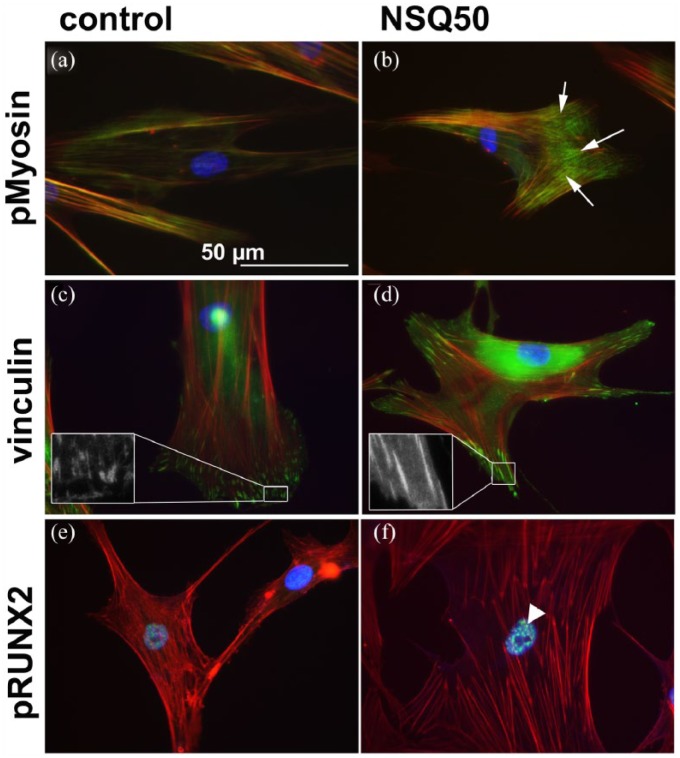
To confirm the published effects of nanotopography, first the MSC response was examined. For MSCs, actin cytoskeleton, pMyosin, vinculin in cell adhesions and pRUNX2 localisation were examined at day 7. On the planar controls, the MSCs had poorly defined stress fibre cytoskeleton (Figure 2(a)), while on NSQ 50, tight actin/pMyosin co-localisation was observed (Figure 2(b)). While adhesions were plentiful in MSCs on planar control and were much longer in MSCs on NSQ 50 (Figure 2(c) and (d)). Increased nuclear pRUNX2 compartmentalisation was noted for MSCs on NSQ 50 rather than control (Figure 2(e) and (f)). At 21 days of culture, OCN staining demonstrated evidence of bone nodule development in MSCs on NSQ 50 but not on control (Figure 3(a) and (b)).
Figure 2.
Adhesion and cytoskeletal observations for MSCs cultured on planar control and NSQ 50 test surfaces after 7 days of culture. pMyosin staining for MSCs on control (a) and NSQ 50 (b) surfaces showing increased pMyosin stress fibre co-localisation on the NSQ 50 surface (arrows). Focal adhesion staining showing few adhesions in MSCs on controls (c) compared to cells on NSQ 50 (d) – see the insets for more detail. Activated pRUNX2 localisation to the nucleus was more prevalent in MSCs on NSQ 50 (f, arrowhead) compared to cells on control (e). Red – actin, blue – nucleus, green – pMyosin/vinculin/pRUNX2.
Figure 3.
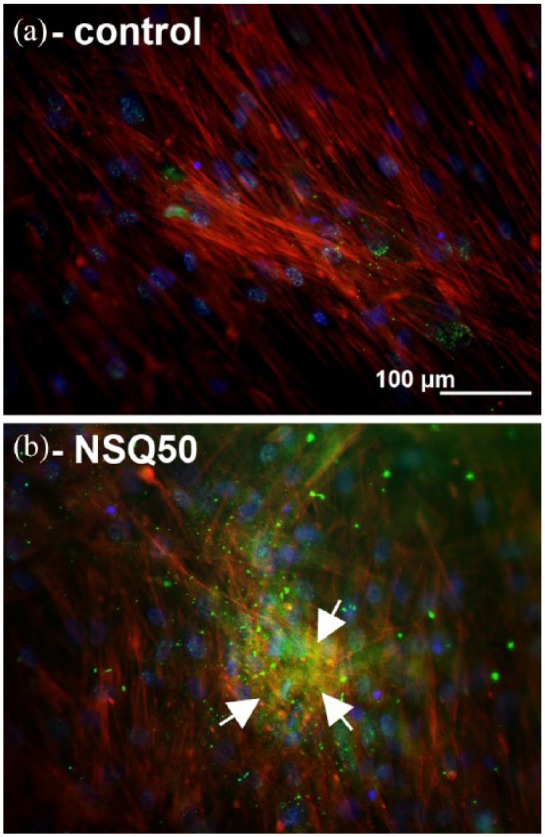
Osteocalcin staining in MSCs after 21 days of culture: (a) MSCs on control show very low levels of osteocalcin staining; (b) MSCs on NSQ 50 show high levels of OCN stain in bone nodule–like morphologies (arrows). Red – actin, blue – nucleus, green – OCN.
SaOS2
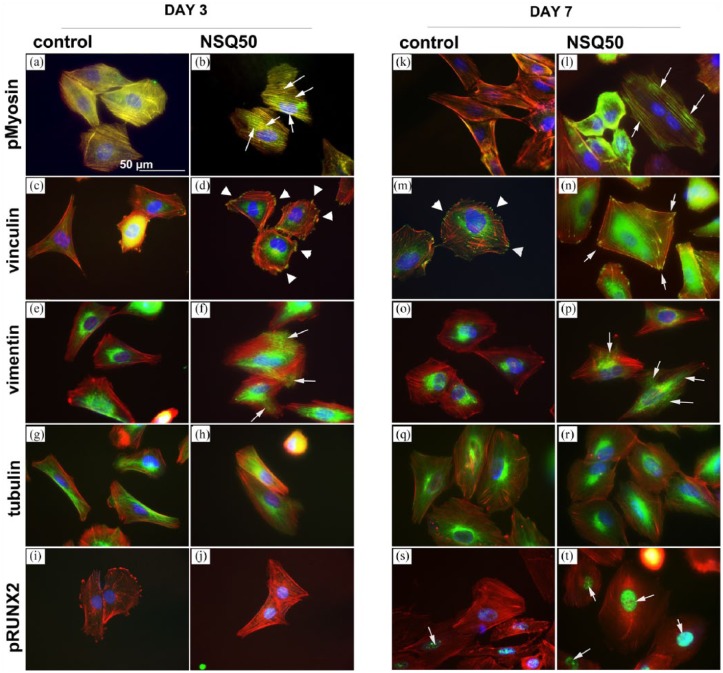
First, considering pMyosin, a greater association of pMyosin with actin stress fibres was observed at both day 3 and day 7 for osteoblasts cultured on NSQ 50 compared to that on planar control (Figure 4(a), (b), (k) and (l)).
Figure 4.
Adhesion and cytoskeletal observations for SaOS2 cultured on planar control and NSQ 50 test surfaces after 3 and 7 days of culture. pMyosin at day 3 and day 7 showed enhanced stress fibre co-localisation for cells on NSQ 50 (b and l) compared to those of planar control (a and k, arrows). Considering focal adhesions, few were noted in cells on control at day 3 (c) compared to NSQ 50 at the same time point (d, arrow heads). By day 7, adhesions were noted in SaOS2 on control (m, arrowheads), but longer adhesions were observed in cells on NSQ 50 (n, arrows). On planar control, vimentin networks were observed around the nucleus of SaOS2 cultured on control at 3 (e) and 7 (o) days. On NSQ 50, however, the cells could be seen to have radiating vimentin networks extending to the cell peripheries at both days 3 (f) and 7 (p) of culture. At both time points and on both control and test materials, SaOS2 cells were seen to have well-organised microtubule networks (g, h, q and r). Considering pRUNX2 nuclear localisation at day 3, very little was noted on either the control (i) or NSQ 50 surface (j). However, at day 7, while nuclear localisation remained low in cells on control substrates (s), high levels of nuclear localisation was seen in cells on NSQ 50 (t, arrows).
Vinculin immunostaining demonstrated that at day 3 SaOS2 on control had very few adhesions compared to cells on NSQ 50 (Figure 4(c) and (d)). On day 7, cells on the control could be seen to have formed cell adhesions (Figure 4(m)). However, adhesions for cells on NSQ 50 had become more elongated (Figure 4(n)). We chose to stain SaOS2 with vimentin and tubulin only as these cells, representing mature osteoblasts, are the main focus of the study and their response is less well documented in other studies than MSCs.
Vimentin staining revealed that at both days 3 and 7 SaOS2 cells on the control samples formed filamentous networks around the nucleus (Figure 4(e) and (o)). On NSQ 50, however, the networks were radiating to the cell peripheries (Figure 4(f) and (p)). Tubulin staining showed mature microtubule networks on all samples at both time points (Figure 4(g), (h), (q) and (r)).
Looking at pRUNX2 nuclear localisation at day 3, very little evidence of RUNX2 activity was noted in SaOS2 on either the control (Figure 4(i)) or NSQ 50 (Figure 4(j)). By day 7, however, differences were noted. On the planar control, the cells had some nuclear pRUNX2 co-localisation (Figure 4(s)), but this was far more notable in SaOS2 on the NSQ 50 nanotopography (Figure 4(t)).
Extending culture out to day 28 and quantifying OPN expression using image analysis showed significantly higher expression of this bone marker protein (Figure 5). OPN was analysed in SaOS2 because, in our experience, it is easier to quantify than OCN as it is an earlier and more abundant marker.
Figure 5.
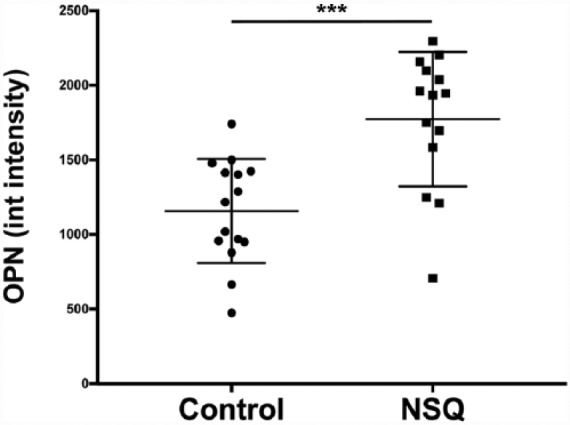
Osteopontin expression by image analysis. Increased osteopontin intensity was observed in cells cultured on NSQ 50 compared to that on control. N = 3 material replicates, 5 areas imaged on each. Results represent mean ± SD, stats by Mann–Whitney U-test where *** represents p < 0.001. The Y-axis shows integrated intensity of OPN and the X-axis shows the results for planar control and NSQ, respectively.
Discussion
This study reports that MSCs differentiate towards osteoblastic lineages, while SaOS2, derived from osteosarcoma cell lines used here to represent mature osteoblast, populations display greater degrees of adhesion formation, cytoskeletal organisation and myosin activation on our NSQ 50, disordered, nanotopography than on the planar surfaces. Osteogenesis occurs through adhesion elongation, pMyosin/actin stress fibre co-localisation (indicating increased intracellular tension)15 and pRUNX2 nuclear compartmentalisation. This leads to increased expression of bone-related phenotypic marker proteins (OCN and OPN).16 Looking at the cytoskeletal proteins vimentin and tubulin, differences in vimentin were noted. Vimentin changes suggested mechanotransductive differences, potentially from differences in adhesion.17
The results demonstrate a similar mechanism of osteogenic commitment and indicate that implants patterned with the NSQ 50 topography should work whether in a marrow or bony environment possibly in a synergistic manner.18 Furthermore, this data fits well with the literature where MSCs have been shown to differentiate into osteoblasts via adhesion tension–dependant pathways using adhesive ligands,10,11,19,20 stiffness21,22 and chemistry2-based stimulation.23
How adhesion formation is controlled by nanoscale topography is still poorly understood. Clearly, the topography–protein interface could be important. It is thus interesting to note that the contact angle of the NSQ surface and control is similar8 and that matrix proteins such as fibronectin can absorb within pits as well as in between pits.24 This could mean that the NSQ topography allows larger adhesions to form via increased surface area, but it is hard to imagine cells being able to utilise such small, high-aspect ratio, features as extra surface. Increased adhesion may arise from adhesion bridging. It is understood that adhesion feature (e.g. arginine, glycine, aspartic acid, arginylglycylaspartic acid (RGD)) densities of <70 nm allow integrin gathering20,25,26 into mature adhesions. It is also notable that disorder in the RGD layout on the nanoscale can increase adhesion gathering.20 It is also emerging that, for more mature adhesions, gaps – such as surface discontinuities – can be bridged by intracellular adhesion components such as vinculin and zyxin. Different extracellular matrix proteins can bridge different gaps. Previous reports have noted that MSCs on the NSQ surface express more vitronectin and cells can efficiently bridge gaps on vitronectin-coated substrates.27
While we used the biodegradable polymer PCL, it is becoming possible to pattern more widely used orthopaedic materials, such as titanium, using approaches such as anodisation.28,29 The ability to transfer patterns such as NSQ 50 into materials such as titanium, ceramic or polyethylene will allow powerful osteoinductive cues to be patterned onto these conventional implant materials without loss of mechanical integrity. Recent studies showed the potential use of disordered, but not random, patterns in orthopaedic implants with increased bone contact observed. They used block co-polymer phase separation to create masks. These masks can be used to selectively anodise oxide patterns in titanium by growing titanium oxide features in the pattern it carries.29–31
Other techniques for controlling the order of topography include phase separation (polymer demixing) and nanotube patterning. In vitro data indicate that such surfaces can also be used to control MSC differentiation towards bone lineage;32–35 in vivo data is also emerging which demonstrate that translation is possible.36
Although we have only touched upon it briefly, this area of research opens up the possibility of future studies to the development of nanopatterned titanium orthopaedic implants, with controlled topographies, that will lead to improved osteogenesis and hence improved implant success rates and, ultimately, better outcomes for patients.
Footnotes
Declaration of conflicting interests: The author(s) declared no potential conflicts of interest with respect to the research, authorship and/or publication of this article.
Funding: The author(s) disclosed receipt of the following financial support for the research, authorship, and/or publication of this article: We acknowledge the support provided through BBSRC grant BB/G008868/1. We dedicate this work to our friend and colleague Adam Curtis.
ORCID iD: Christopher Allan  https://orcid.org/0000-0003-4222-3328
References
- 1. Engler AJ, Sweeney HL, Discher DE. Matrix elasticity directs stem cell lineage specification. Cell 2006; 126: 677–689. [DOI] [PubMed] [Google Scholar]
- 2. Benoit DS, Schwartz MP, Durney AR, et al. Small functional groups for controlled differentiation of hydrogel-encapsulated human mesenchymal stem cells. Nat Mater 2008; 7: 816–823. [DOI] [PMC free article] [PubMed] [Google Scholar]
- 3. Dalby MJ, Gadegaard N, Tare R, et al. The control of human mesenchymal cell differentiation using nanoscale symmetry and disorder. Nat Mater 2007; 6: 997–1003. [DOI] [PubMed] [Google Scholar]
- 4. McNamara LE, Sjöström T. Skeletal stem cell physiology on functionally distinct titania nanotopographies. Biomaterials 2011; 32: 7403–7410. [DOI] [PubMed] [Google Scholar]
- 5. Zhang S, Ma B, Liu F, et al. Polylactic acid nanopillar array-driven osteogenic differentiation of human adipose-derived stem cells determined by pillar diameter. Nano Lett 2018; 18(4): 2243–2253. [DOI] [PubMed] [Google Scholar]
- 6. Curtis A, Wilkinson C. Topographical control of cells. Biomaterials 1997; 18: 1573–1583. [DOI] [PubMed] [Google Scholar]
- 7. Wilkinson CD. Making structures for cell engineering. J Eur Cell Mater 2004; 8: 21–26. [DOI] [PubMed] [Google Scholar]
- 8. McMurray RJ, Gadegaard N, Tsimbouri PM, et al. Nanoscale surfaces for the long-term maintenance of mesenchymal stem cell phenotype and multipotency. Nat Mater 2011; 10: 637–644. [DOI] [PubMed] [Google Scholar]
- 9. Biggs MJ, Richards RG, Gadegaard N, et al. The use of nanoscale topography to modulate the dynamics of adhesion formation in primary osteoblasts and ERK/MAPK signalling in STRO-1+ enriched skeletal stem cells. Biomaterials 2009; 30: 5094–5103. [DOI] [PubMed] [Google Scholar]
- 10. McBeath R, Pirone DM, Nelson CM, et al. Cell shape, cytoskeletal tension, and RhoA regulate stem cell lineage commitment. Dev Cell 2004; 6: 483–495. [DOI] [PubMed] [Google Scholar]
- 11. Kilian KA, Bugarija B, Lahn BT, et al. Geometric cues for directing the differentiation of mesenchymal stem cells. Proc Natl Acad Sci U S A 2010; 107: 4872–4877. [DOI] [PMC free article] [PubMed] [Google Scholar]
- 12. Yang J, McNamara LE, Gadegaard N, et al. Nanotopographical induction of osteogenesis through adhesion, bone morphogenic protein cosignaling, and regulation of microRNAs. ACS Nano 2014; 8: 9941–9953. [DOI] [PubMed] [Google Scholar]
- 13. Gadegaard N, Mosler S, Larsen NB. Biomimetic polymer nanostructures by injection moulding. Macromol Mater Eng 2003; 288: 76–83. [Google Scholar]
- 14. Tondreau T, Lagneaux L, Dejeneffe M, et al. Isolation of BM mesenchymal stem cells by plastic adhesion or negative selection: phenotype, proliferation kinetics and differentiation potential. Cryotherapy 2004; 6(4): 372–379. [DOI] [PubMed] [Google Scholar]
- 15. Parsons JT, Horwitz AR, Schwartz MA. Cell adhesion: integrating cytoskeletal dynamics and cellular tension. Nat Rev Mol Cell Biol 2010; 11(9): 633–643. [DOI] [PMC free article] [PubMed] [Google Scholar]
- 16. Lian JB, McKee MD, Todd AM, et al. Induction of bone-related proteins, osteocalcin and osteopontin, and their matrix ultrastructural localization with development of chondrocyte hypertrophy in vitro. J Cell Biochem 1993; 52(2): 206–219. [DOI] [PubMed] [Google Scholar]
- 17. Ingber DE. Cellular mechanotransduction: putting all the pieces together again. FASEB J 2006; 20(7): 811–827. [DOI] [PubMed] [Google Scholar]
- 18. Gittens RA, Olivares-Navarrete R, Schwartz Z, et al. Implant osseointegration and the role of microroughness and nanostructures: lessons for spine implants. Acta Biomater 2014; 10(8): 3363–3371. [DOI] [PMC free article] [PubMed] [Google Scholar]
- 19. Lee J, Abdeen AA, Tang X, et al. Geometric guidance of integrin mediated traction stress during stem cell differentiation. Biomaterials 2015; 69: 174–183. [DOI] [PMC free article] [PubMed] [Google Scholar]
- 20. Huang J, Grater SV, Corbellini F, et al. Impact of order and disorder in RGD nanopatterns on cell adhesion. Nano Lett 2009; 9(3): 1111–1116. [DOI] [PMC free article] [PubMed] [Google Scholar]
- 21. Trappmann B, Gautrot JE, Connelly JT, et al. Extracellular-matrix tethering regulates stem-cell fate. Nat Mater 2012; 11(7): 642–649. [DOI] [PubMed] [Google Scholar]
- 22. Wen JH, Vincent LG, Fuhrmann A, et al. Interplay of matrix stiffness and protein tethering in stem cell differentiation. Nat Mater 2014; 13(10): 979–987. [DOI] [PMC free article] [PubMed] [Google Scholar]
- 23. Dalby MJ, Garcia AJ, Salmeron-Sanchez M. Receptor control in mesenchymal stem cell engineering. Nat Rev Mater 2018; 3: 17091. [Google Scholar]
- 24. Ngandu Mpoyi E, Cantini M, Reynolds PM, et al. Protein adsorption as a key mediator in the nanotopographical control of cell behavior. ACS Nano 2016; 10: 6638–6647. [DOI] [PMC free article] [PubMed] [Google Scholar]
- 25. Cavalcanti-Adam EA, Aydin D, Hirschfeld-Warneken VC. Cell adhesion and response to synthetic nanopatterned environments by steering receptor clustering and spatial location. HFSP J 2008; 2: 276–285. [DOI] [PMC free article] [PubMed] [Google Scholar]
- 26. Cavalcanti-Adam EA, Volberg T, Micoulet A, et al. Cell spreading and focal adhesion dynamics are regulated by spacing of integrin ligands. Biophys J 2007; 92: 2964–2974. [DOI] [PMC free article] [PubMed] [Google Scholar]
- 27. Malmstrom J, Lovmand J, Kristensen S, et al. Focal complex maturation and bridging on 200 nm vitronectin but not fibronectin patches reveal different mechanisms of focal adhesion formation. Nano Lett 2011; 11: 2264–2271. [DOI] [PubMed] [Google Scholar]
- 28. Sjostrom T, McNamara LE, Meek R, et al. 2D and 3D nanopatterning of titanium for enhancing osteoinduction of stem cells at implant surfaces. Adv Healthc Mater 2013; 2: 1258–1293. [DOI] [PubMed] [Google Scholar]
- 29. Silverwood RK, Fairhurst PG, Sjostrom T, et al. Analysis of osteoclastogenesis/osteoblastogenesis on nanotopographical titania surfaces. Adv Healthc Mater 2016; 5: 947–955. [DOI] [PubMed] [Google Scholar]
- 30. Sjostrom T, McNamara LE, Yang L, et al. Novel anodization technique using a block copolymer template for nanopatterning of titanium implant surfaces. ACS Appl Mater Interfaces 2012; 4: 6354–6361. [DOI] [PubMed] [Google Scholar]
- 31. Sjostrom T, Fox N, Su B. Through-mask anodization of titania dot- and pillar-like nanostructures on bulk Ti substrates using a nanoporous anodic alumina mask. Nanotechnology 2009; 20: 135305. [DOI] [PubMed] [Google Scholar]
- 32. Park J, Bauer S, Von der Mark K, et al. Nanosize and vitality: TiO2 nanotube diameter directs cell fate. Nano Lett 2007; 7(6): 1686–1691. [DOI] [PubMed] [Google Scholar]
- 33. Oh S, Brammer K, Li Y, et al. Stem cell fate dictated solely by altered nanotube dimension. Proc Natl Acad Sci U S A 2009; 17: 106–107. [DOI] [PMC free article] [PubMed] [Google Scholar]
- 34. Zhao L, Liu L, Wu Z, et al. Effects of micropitted/nanotubular titania topographies on bone mesenchymal stem cell osteogenic differentiation. Biomaterials 2012; 33(9): 2629–2641. [DOI] [PubMed] [Google Scholar]
- 35. Brammer KS, Choi C, Frandsen CJ, et al. Comparative cell behavior on carbon-coated TiO2 nanotube surfaces for osteoblasts vs osteo-progenitor cells. Acta Biomater 2011; 7(6): 2697–2703. [DOI] [PubMed] [Google Scholar]
- 36. Ko EK, Jeong SI, Rim NG, et al. In vitro osteogenic differentiation of human mesenchymal stem cells and in vivo bone formation in composite nanofiber meshes. Tissue Eng 2008; 14: 2105–2119. [DOI] [PubMed] [Google Scholar]


