The phytohormone network accelerates transcriptional reprogramming during ETI, thereby enabling rapid establishment of ETI, which is vital for effective resistance against bacterial pathogens.
Abstract
The phytohormone network consisting of jasmonate, ethylene, PHYTOALEXIN-DEFICIENT4, and salicylic acid signaling is required for the two modes of plant immunity, pattern-triggered immunity (PTI), and effector-triggered immunity (ETI). A previous study showed that during PTI, the transcriptional responses of over 5000 genes qualitatively depend on complex interactions between the network components. However, the role of the network in transcriptional reprogramming during ETI and whether it differs between PTI and ETI remain elusive. Here, we generated time-series RNA-sequencing data of Arabidopsis thaliana wild-type and combinatorial mutant plants deficient in components of the network upon challenge with virulent or ETI-triggering avirulent strains of the foliar bacterial pathogen Pseudomonas syringae. Resistant plants such as the wild type achieved high-amplitude transcriptional reprogramming 4 h after challenge with avirulent strains and sustained this transcriptome response. Strikingly, susceptible plants including the quadruple network mutant showed almost identical transcriptome responses to resistant plants but with several hours delay. Furthermore, gene coexpression network structure was highly conserved between the wild type and quadruple mutant. Thus, in contrast to PTI, the phytohormone network is required only for achieving high-amplitude transcriptional reprogramming within the early time window of ETI against this bacterial pathogen.
INTRODUCTION
Plants are equipped with preformed barriers and an inducible immune system to deal with the myriad microbial attacks they experience during their lifetimes (Jones and Dangl, 2006). Plant-inducible immunity is activated through recognition of microbial molecules or actions by specific receptors. This resembles animal innate immunity, although the nature of the receptors differs between plants and animals, suggesting convergent evolution (Ausubel, 2005; Maekawa et al., 2011). Plants recognize conserved microbial molecules called microbe-associated molecular patterns (MAMPs) via cell surface-localized pattern recognition receptors, most of which are receptor-like kinases or receptor-like proteins, thereby activating pattern-triggered immunity (PTI) (Boller and Felix, 2009; Macho and Zipfel, 2014). Virulent microbial pathogens overcome PTI by deploying virulence effectors that interfere with PTI signaling components (Jones and Dangl, 2006; Asai and Shirasu, 2015).
Plants have another mechanism recognizing virulence effectors or their actions to trigger effector-triggered immunity (ETI) (Jones and Dangl, 2006; Cui et al., 2015). Nucleotide binding leucine-rich repeat proteins (NLRs) are typical receptors for ETI and fall broadly into the two major classes TNL and CNL, which possess an N-terminal Toll-Interleukin1 Receptor (TIR) and coiled-coil domain, respectively. For instance, the Arabidopsis thaliana intracellular CNLs RESISTANT TO P. SYRINGAE2 (RPS2) and RESISTANCE TO P. SYRINGAE PV MACULICOLA1 (RPM1) recognize modifications of the PTI signaling component RPM1 INTERACTING PROTEIN4 by the bacterial type III effectors AvrRpt2 and AvrRpm1, respectively, of a Gram-negative bacterial pathogen, Pseudomonas syringae (Mackey et al., 2002, 2003; Axtell and Staskawicz, 2003). The Arabidopsis TNL pair RPS4 and RESISTANT TO RALSTONIA SOLANACEARUM1 initiates ETI upon recognizing actions of multiple pathogen effectors such as AvrRps4 of P. syringae and PopP2 of Ralstonia solanacearum (Birker et al., 2009; Narusaka et al., 2009).
Activation of plant immune receptors triggers a diverse array of immune responses such as reactive oxygen species generation, cellular Ca2+ spikes, MAP kinase (MAPK) activation, and production of phytohormones including jasmonate (JA), ethylene, and salicylic acid (SA), thereby activating genome-wide massive transcriptional reprogramming (Boller and Felix, 2009; Tsuda and Katagiri, 2010; Cui et al., 2015). These signaling pathways interact with each other to form immune signaling networks, which are extensively shared by PTI and ETI (Tsuda and Katagiri, 2010; Cui et al., 2015). For instance, both PTI triggered by the MAMP flg22 and ETI triggered by AvrRpt2 against P. syringae pv tomato DC3000 (Pto DC3000) are almost abolished in an Arabidopsis quadruple mutant of delayed dehiscence2 (dde2), ethylene insensitive2 (ein2), phytoalexin4 (pad4), and salicylic acid induction deficient2 (sid2), which is simultaneously deficient in JA, ethylene, PAD4, and SA signaling (Tsuda et al., 2009).
The network defined by the four signaling sectors mostly explains flg22-triggered PTI and AvrRpt2-triggered ETI in terms of bacterial resistance. However, genetic interactions among the signaling sectors of the network are very different: Synergistic relationships are evident in PTI, while compensatory relationships dominate in ETI. This suggests that the mechanism by which the network regulates immune responses such as transcriptional reprogramming may fundamentally differ between PTI and ETI. A previous study showed that regulation of over 5000 genes in response to the MAMP flg22 is dependent on the JA/ethylene/PAD4/SA signaling network and that the network-dependent genes are regulated by the four signaling components in a complex manner (Hillmer et al., 2017). However, the role of the network in transcriptional reprogramming during ETI and whether it differs between PTI and ETI remain unknown.
PTI is often overcome by pathogens. Indeed, Pto DC3000 is highly virulent in Arabidopsis Col-0 because this pathogen carries an arsenal of effectors that modulate PTI-associated transcriptional reprogramming (Lewis et al., 2015). In contrast, Pto DC3000 strains expressing a recognized effector are avirulent due to activation of ETI, despite the presence of a battery of virulence-conferring effectors (Cui et al., 2015). However, it is unclear how robust resistance during ETI is achieved during the dynamic interactions between plant immunity and pathogen virulence.
Here, we generated time-series RNA-sequencing (RNA-seq) data to compare temporal transcriptome dynamics of Arabidopsis Col-0 and combinatorial mutants of dde2, ein2, pad4, and sid2 during infection with virulent Pto DC3000 or ETI-triggering avirulent Pto DC3000 expressing AvrRpt2 or AvrRpm1 (348 samples in total). Our integrated analysis showed that the JA, ethylene, PAD4, and SA signaling network is required only for achieving high-amplitude transcriptional reprogramming within the early stages of AvrRpt2-triggered ETI. This rapid establishment of transcriptional reprogramming appears vital for robust resistance during ETI against the bacterial pathogen.
RESULTS
Generation of Time-Series Transcriptome Data by RNA-Seq
We generated time-series transcriptome data of the Arabidopsis wild-type Col-0 and single and combinatorial mutants of dde2, ein2, pad4, and sid2 upon infection with the virulent Pto DC3000 or avirulent Pto DC3000 strains expressing AvrRpt2 or AvrRpm1 (Pto AvrRpt2 or Pto AvrRpm1, respectively). We used a low dose of inoculum (OD600 = 0.001; 5 × 10⁵ colony-forming units/mL) to avoid triggering macroscopic tissue collapse at late time points due to programmed cell death, called the hypersensitive response, upon inoculation with these avirulent Pto DC3000 strains (Ritter and Dangl, 1996). To ensure appropriate comparisons, all genotypes and treatments including mock for each time point were processed side by side at the same time. In total, 348 samples were subjected to RNA-seq, resulting in 19.5 million 100-bp strand-specific single-end reads per sample on average. Normalized and log2-transformed count data were used for statistical analysis using a linear model. For further details, see Methods.
Temporal Dynamics of Transcriptome Responses to Virulent and Avirulent Pto Strains in Col-0
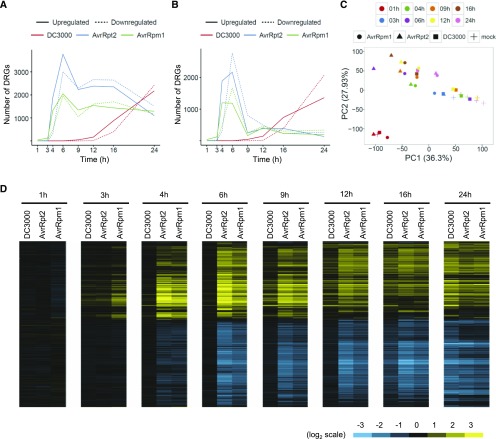
To provide an overview of the temporal dynamics of transcriptional reprogramming in Col-0, we plotted the number of differentially regulated genes (DRGs; q-value < 0.01; 11,144 genes) compared with mock-inoculated plants at each time point, as a proxy for the magnitude of transcriptional reprogramming (Figure 1A). Following challenge with avirulent Pto AvrRpt2 or AvrRpm1, the number of DRGs rapidly increased at 4 and 6 h postinfiltration (hpi) and remained large over time. In contrast, only a small number of DRGs was observed at 9 hpi after challenge with virulent Pto DC3000. The number of DRGs increased over time and, at 24 hpi, was even larger than following challenge with avirulent Pto AvrRpt2 or AvrRpm1. Therefore, the transcriptome response is fast during infection with the avirulent Pto strains but slow during infection with the virulent Pto strain. We did not capture early transcriptional responses to virulent Pto DC3000, as shown by the observation that we found almost no DRGs between 1 and 6 hpi with Pto DC3000 infection. This is most likely explained by the lower dose used in this study as compared with the previous studies (Lewis et al., 2015). We then assigned a gene as a DRG only at the earliest time point when the gene is considered differentially expressed (e.g., if a gene is differentially expressed at 4, 6, and 9 hpi, then this gene is counted as a DRG only at 4 hpi) (Figure 1B). This refinement showed that the majority of gene induction occurs as early as 4 or 6 hpi after challenge with avirulent Pto AvrRpt2 or AvrRpm1.
Figure 1.
Transcriptome Dynamics in Col-0 Challenged with Virulent Pto DC3000 or Avirulent Pto AvrRpt2 or AvrRpm1.
(A) and (B) Genes that show significant induction (solid line) or suppression (dotted line) in Pto DC3000- (red line), Pto AvrRpt2- (blue line), or Pto AvrRpm1-treated (green line) Col-0 compared with mock-treated samples were selected (DRGs; q < 0.01, 11,144 genes).
(A) The number of DRGs was plotted at each time point.
(B) DRGs were counted only at the earliest time point of statistically significant expression change.
(C) Principal component analysis of the time-series transcriptome data, based on expression levels of genes that show significant expression changes during infection by Pto strains compared with mock (q < 0.01, 11,144 genes). Different treatments and time points are shown by different shapes and colors, respectively.
(D) Heat maps showing expression patterns of the genes that show significant expression changes during infection by Pto strains compared with mock (q < 0.01 and |log2FC| > 1, 7251 genes). The log2 fold changes relative to mock were subjected to hierarchical clustering. Blue indicates negative values, yellow indicates positive values, and black indicates zero. Pto DC3000, Pto AvrRpt2, and Pto AvrRpm1 are referred to as DC3000, AvrRpt2, and AvrRpm1, respectively.
We performed Gene Ontology (GO) enrichment analysis with these genes classified based on the timing of expression changes and found that the genes induced at 4 hpi upon avirulent Pto AvrRpt2 challenge, but not those induced only at later time points, show enrichment for genes associated with various immunity-related GO terms (Supplemental Figure 1 and Supplemental Data Set 1). Similarly, the majority of suppressed genes were found to be significant at 6 hpi. These suppressed genes are enriched, for example, for the GO term “postembryonic development” (Supplemental Data Set 1), which is consistent with the trade-off between immunity and growth (Heil and Baldwin, 2002; Alcázar et al., 2011; Huot et al., 2014; Smakowska et al., 2016). Moreover, GO enrichment analysis suggested that time-dependent gene expression patterns are similar between interactions with avirulent Pto AvrRpt2 and AvrRpm1 but different between interactions with virulent Pto DC3000 and avirulent Pto strains (Supplemental Figure 1 and Supplemental Data Sets 1 to 3). Taken together, these results suggest that the transcriptional response within the time window of 4 to 6 hpi is sustained at the later time points during ETI.
Next, to visualize similarities and differences in overall transcriptional reprogramming during interactions with virulent Pto DC3000 and ETI-triggering avirulent Pto AvrRpt2 or AvrRpm1, log2 expression values for DRGs (q-values < 0.01; 11,144 genes without a fold-change cutoff) were used for principal component analysis (Figure 1C; Supplemental Figure 2). Separation between virulent and avirulent strains was clearly observed at 4 hpi with being more pronounced at 6 hpi. Avirulent strains remained distinct from the mock samples at the later time points. Virulent Pto DC3000 clustered together with the avirulent strains at 16 and 24 hpi. These results are consistent with the patterns observed for the number of DRGs. To visualize temporal dynamics at the level of single genes, log2 expression changes of DRGs compared with mock (q-values < 0.01 and fold changes > 2; 7251 genes) were used to perform hierarchical clustering and create heat maps (Figure 1D). In line with the previous analyses, fast and sustained transcriptional reprogramming from 4 hpi was evident for avirulent strains, while a slow response was observed for virulent Pto DC3000. However, the repertoires of induced and suppressed genes were greatly overlapping. Overall, our time-resolved transcriptome analysis revealed that virulent and avirulent Pto strains trigger qualitatively similar but temporally distinct transcriptional reprogramming: Transcriptional reprogramming is fast and sustained during interaction with ETI-triggering avirulent Pto strains but slow during interaction with virulent Pto DC3000. Thus, fast and/or sustained transcriptional reprogramming may explain effective ETI against avirulent Pto strains and slow transcriptional reprogramming is not sufficient to effectively suppress growth of virulent Pto DC3000.
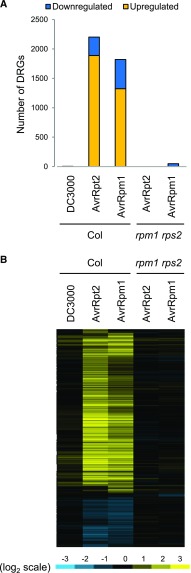
To test whether the observed transcriptional reprogramming upon challenge with avirulent Pto AvrRpt2 or AvrRpm1 is mediated by ETI activation, we analyzed transcriptome responses in the rpm1 rps2 mutant, which is deficient in the cognate receptors for AvrRpm1 and AvrRpt2. Massive transcriptional changes upon challenge with avirulent Pto AvrRpt2 or AvrRpm1 at 4 hpi were dependent on RPS2 and RPM1 (Figure 2). This indicates that the fast transcriptional reprogramming in the wild type upon avirulent Pto AvrRpt2 or AvrRpm1 challenge is associated with ETI activation.
Figure 2.
ETI Activation Is Responsible for the Rapid Transcriptional Reprogramming.
Genes that show significant expression changes in Col-0 or rpm1 rps2 challenged with Pto AvrRpt2 or Pto AvrRpm1 compared with mock at 4 hpi were selected (DRGs; q < 0.01, 2932 genes).
(A) The numbers of DRGs are plotted.
(B) Expression changes of DRGs are visualized in the heat map as described in the legend of Figure 1D.
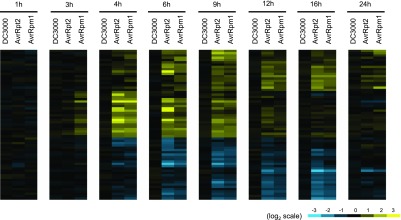
Although the major difference between the transcriptome responses to virulent and avirulent Pto strains resides in the temporal dynamics, not in the repertoires of DRGs, we explored possible genes specifically regulated in response to ETI-triggering avirulent Pto strains and identified 65 such genes (Figure 3; Supplemental Data Set 4). Several genes showed strong induction at early but not late time points (Figure 3). These genes might specifically support early ETI responses. The number of ETI-specific genes (65 genes) was much smaller than the overall number of DRGs (7251 genes), pointing to minor qualitative differences in the transcriptome responses to virulent and avirulent Pto strains.
Figure 3.
Identification of ETI-Specific Genes.
The genes that show significant expression changes in Col-0 challenged with avirulent Pto AvrRpt2 or Pto AvrRpm1 compared with mock at least at one time point were selected (q < 0.01 and |log2FC| > 1). Of the selected genes, the genes whose absolute expression changes in Col-0 challenged with virulent Pto DC3000 to mock were less than log2 0.4 were selected (38 induced and 27 suppressed genes) and the log2 expression changes were visualized by heat maps. Blue indicates negative values, yellow indicates positive values, and black indicates zero.
Delayed Transcriptional Reprogramming Is Linked to Compromised Immunity in dde2 ein2 pad4 sid2 Plants during AvrRpt2-Triggered ETI
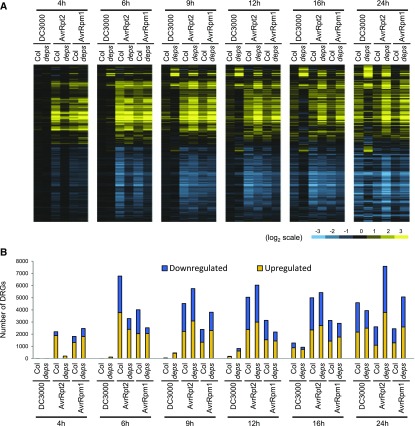
To understand how the JA/ethylene/PAD4/SA signaling network mediates gene regulation in plant immune responses, we investigated transcriptome responses of Col-0 and dde2 ein2 pad4 sid2 plants to virulent Pto DC3000 and avirulent Pto AvrRpt2, or Pto AvrRpm1. Based on the temporal transcriptome dynamics observed in Col-0 (Figure 1), we selected six time points (4, 6, 9, 12, 16, and 24 hpi) for RNA-seq analysis. Log2 expression changes compared with mock were subjected to hierarchical clustering for heat map visualization (Figure 4A). Transcriptome responses of Col-0 and dde2 ein2 pad4 sid2 to virulent Pto DC3000 were similarly slower than those to avirulent Pto AvrRpt2 and Pto AvrRpm1. However, dde2 ein2 pad4 sid2 plants showed different patterns or magnitudes of gene regulation compared with Col-0, which likely explain the enhanced susceptibility of dde2 ein2 pad4 sid2 to Pto DC3000 (Tsuda et al., 2009). Thus, the JA/ethylene/PAD4/SA signaling network is required for qualitative gene regulation important for immune response to Pto DC3000.
Figure 4.
Comparative Analysis of Transcriptome Dynamics in Col-0 and dde2 ein2 pad4 sid2 in Response to Virulent Pto DC3000, and Avirulent Pto AvrRpt2 or AvrRpm1.
(A) Heat maps showing expression patterns of the genes that show significant expression changes in Col-0 (Col) or dde2 ein2 pad4 sid2 (deps) plants challenged with virulent Pto DC3000, or avirulent Pto AvrRpt2 or Pto AvrRpm1 compared with mock (q < 0.01 and |log2FC| > 1, 9759 genes). See also the legend of Figure 1D.
(B) The number of genes that show significant induction (q < 0.01, yellow) or suppression (q < 0.01, blue) compared with mock at each time point.
We previously showed that AvrRpt2-triggered ETI against Pto DC3000 is highly compromised, while AvrRpm1-triggered ETI is largely retained in dde2 ein2 pad4 sid2 plants (Tsuda et al., 2009). Interestingly, at 4 hpi, we observed compromised transcriptional responses in dde2 ein2 pad4 sid2 plants after challenge with Pto AvrRpt2 compared with Col-0 but not after challenge with Pto AvrRpm1 (Figure 4A). This is in accordance with our finding of very few DRGs at this time point in dde2 ein2 pad4 sid2 challenged with Pto AvrRpt2 compared with Col and comparable numbers of DRGs between dde2 ein2 pad4 sid2 and Col-0 challenged with Pto AvrRpm1 (Figure 4B). However, from 6 to 24 hpi, overall expression patterns and the numbers of DRGs were similar in dde2 ein2 pad4 sid2 between Pto AvrRpt2 and AvrRpm1 challenges (Figure 4). In comparison to Col-0, the dde2 ein2 pad4 sid2 plants showed overall similarity in expression patterns of DRGs and displayed even greater magnitudes of expression changes for some genes from 9 hpi during Pto AvrRpt2 infection. Thus, the JA/ethylene/PAD4/SA network regulates only timing for rapid transcriptional reprogramming during ETI triggered by avirulent Pto AvrRpt2. This is clearly different from the network-dependent qualitative gene regulation during transcriptome responses to virulent Pto DC3000 or the MAMP flg22 (Figure 4) (Hillmer et al., 2017). Moreover, our data revealed a clear association between effective bacterial resistance and accurately timed, rapid transcriptional reprogramming during AvrRpt2-triggered ETI.
Coexpression Network Analysis Reveals Potential Regulatory Mechanisms Driving Transcriptional Dynamics during ETI
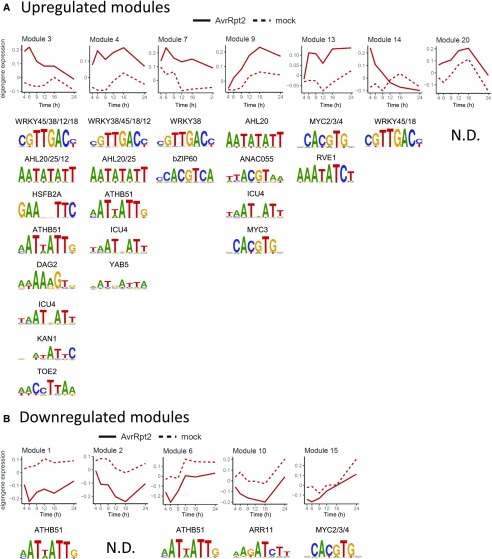
To gain insights into the gene regulatory networks controlling transcriptional reprogramming during ETI, we performed coexpression network analysis using the R package WGCNA, which performs unsupervised and unbiased clustering of coexpressed genes into modules and calculates module eigengenes (MEs) that summarize expression levels of the modules (Langfelder and Horvath, 2008). WGCNA was applied to the gene expression data from Col-0 treated with mock or ETI-triggering avirulent Pto AvrRpt2, resulting in 22 coexpression modules with distinct temporal expression patterns, as illustrated by the respective MEs (Supplemental Figure 3 and Supplemental Data Set 5). MEs 1 to 4, 6, 7, 9, 10, 13 to 15, and 20 show statistically significant transcriptional changes compared with mock samples at least at one time point (Figure 5; two-tailed t tests, P < 0.01). Modules 3, 4, 7, 9, and 14 are enriched for genes associated with immunity-related GO terms, such as defense response and response to SA (Supplemental Data Set 6) and genes induced in response to avirulent Pto AvrRpt2 challenge (Figure 5A).
Figure 5.
Expression Patterns of Coexpression Modules.
Gene expression data in Col-0 challenged with avirulent Pto AvrRpt2 and mock were subjected to WGCNA and grouped into modules containing genes with similar expression patterns. Expression levels of MEs that summarize gene expression levels in the modules are plotted over time for upregulated (A) and downregulated (B) modules. The 1000 bp upstream of the transcription start sites of the genes in the individual modules was tested for enrichment of known cis elements as described in Methods. Names of transcription factors and sequence logos of their binding sites are shown. To avoid redundant representation, only one sequence logo per transcription factor family is shown. N.D., not detected.
We analyzed motif enrichment in the promoters of genes in each differentially expressed module compared with the set of genes in the nondifferentially expressed modules. We found that different transcriptional dynamics can be characterized by different sets of transcription factor binding motifs (Figure 5). For instance, modules 3, 4, 7, and 14 with strong transcriptional induction at early hours show enrichment for genes with binding motifs of WRKY transcription factors in their promoters, whereas module 9 has peaks of transcriptional induction at late hours and is enriched for genes with binding motifs for NAC and MYC transcription factors. Binding motifs for WRKY and AHL transcription factors are overrepresented only in the upregulated modules 3, 4, 7, 9, and 14, which are associated with immunity-related GO terms (Supplemental Data Set 6), suggesting central roles of WRKY and AHL transcription factors in immunity-associated transcriptional induction.
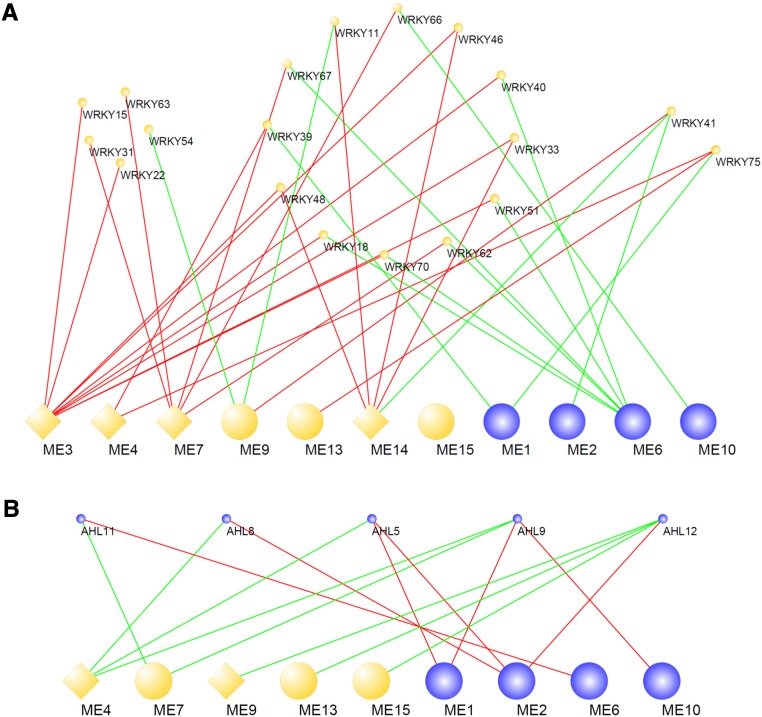
The findings that biding motifs for WRKY and AHL transcription factors are overrepresented in immunity-related coexpression modules prompted us to further investigate connections between these transcription factors and immune activation during ETI. To this end, we took advantage of the WGCNA measure of eigengene-based gene connectivity, kME, which calculates correlations between expression patterns of individual genes and those of MEs. Genes with high positive kME values are referred to as intramodular hub genes and are centrally located in their respective modules; these genes may thus be critical components within the modules and/or the entire network. Importantly, a gene can have high positive or negative kME values with multiple MEs. These genes can be considered intermodular hub genes connecting the modules. We selected differentially expressed MEs, WRKY, and AHL transcription factors and constructed their coexpression networks (|kME| > 0.8 or > 0.7 for WRKY or AHL transcription factors, respectively) (Figure 6).
Figure 6.
Coexpression Relationships between MEs and WRKY or AHL Transcription Factors in Col-0 Challenged with Avirulent Pto AvrRpt2.
Large and small nodes indicate MEs and transcription factors, respectively. Gene upregulation and downregulation are indicated by orange and blue nodes, respectively. Diamond nodes are MEs that represent the modules showing overrepresentation of WRKY- (A) or AHL-binding motifs (B). Red edges indicate positive correlation (kME > 0.8 for [A] and > 0.7 for [B]) and green negative correlation (kME < −0.8 for [A] and < −0.7 for [B]).
The WRKY family of transcription factors is comprised of more than 70 members in Arabidopsis and is characterized by the WRKY domain that binds to the C/TTGAC/T motif (Tsuda and Somssich, 2015). Numerous WRKY transcription factors have been implicated in regulation of plant immune response (Tsuda and Somssich, 2015). Expression of the WRKY transcription factors in the constructed network were all induced (Figure 6A). The upregulated modules showing overrepresentation of the WRKY binding motif, represented by ME3, ME4, ME7, and ME14, are positively correlated to a large repertoire of WRKY transcription factors (Figure 6A), suggesting that increased expression of multiple WRKY transcription factors contribute to upregulation of genes in these modules.
AHL transcription factors are evolutionarily conserved in plants and are characterized by two structural units, the AT-hook motif and the Plant and Prokaryote Conserved (PPC) domain (Zhao et al., 2013). The AT-hook motif enables binding to AT-rich DNA sequence and the PPC domain is required for homo- or hetero-oligomerization as well as for interaction with other transcription factors (Zhao et al., 2013). In contrast to the WRKY transcription factors, expression of the AHL transcription factors in the constructed network were all suppressed (Figure 6B). ME4 and ME9, which represent the upregulated modules showing overrepresentation of AHL-binding motifs, were negatively correlated with AHL5, 8, 9, and 12 (Figure 6B). In Arabidopsis, some of the 29 AHL transcription factors were shown to inhibit MAMP-induced gene expression (Lu et al., 2010). This may suggest that repressing expression of these AHL transcription factors is a mechanism that mediates increased expression of genes in modules 4 and 9.
Gene Coexpression Relationships Are Highly Preserved between Col-0 and dde2 ein2 pad4 sid2 Plants during AvrRpt2-Triggered ETI
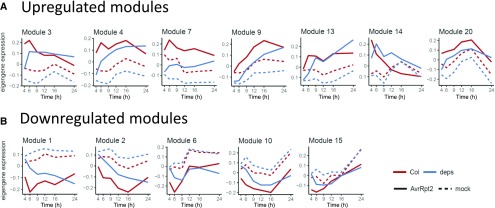
We examined how well the gene coexpression relationships are preserved between the resistant wild type and the susceptible quadruple mutant challenged with ETI-triggering Pto AvrRpt2. Upregulated and downregulated modules were selected for the analysis and visualized by MEs (Figure 7). Importantly, the maximum or minimum expression levels of MEs were not comparable between the wild type and the quadruple mutant in most of the coexpression modules, although the expression levels of MEs became similar at late time points (Figure 7). This suggests that the JA/ethylene/PAD4/SA signaling network contributes to the amplitude of early transcriptional reprogramming during AvrRpt2-triggered ETI.
Figure 7.
Expression Patterns of the MEs in Col-0 and dde2 ein2 pad4 sid2 Challenged with Avirulent Pto AvrRpt2 or Mock.
The expression levels of MEs of the upregulated and downregulated modules identified in Figure 5 were recalculated using gene expression data in Col-0 (Col) and dde2 ein2 pad4 sid2 (deps) challenged with avirulent Pto AvrRpt2 or mock, and are plotted over time. Upregulated modules (A) and downregulated modules (B).
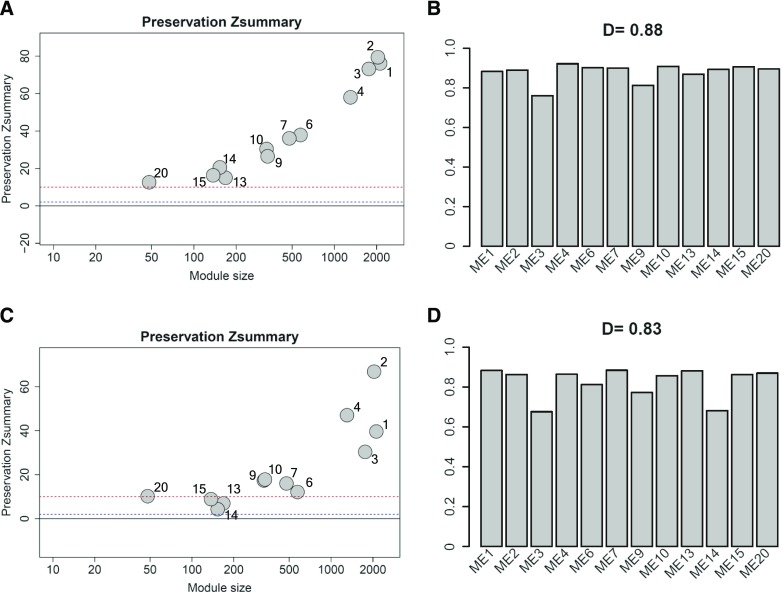
We evaluated preservation of Col-0 upregulated and downregulated modules in the quadruple mutant by employing the WGCNA measure of module preservation, Zsummary (Langfelder et al., 2011). This statistic summarizes similarity of the gene connection strengths and connectivity patterns of a given module in different data sets (Langfelder et al., 2011). We found strong evidence for high preservation of all modules between the two genotypes (Figure 8A; Zsummary >10), suggesting that gene coexpression network structures within the modules are very similar between the two genotypes. We then extended preservation analysis to coexpression relationships between the modules (Langfelder and Horvath, 2007), which may represent coordinated actions of biological pathways/functions associated with the modules, by comparing correlations between MEs in Col-0 and quadruple mutant data during AvrRpt2-triggered ETI. In Figure 8B, bars indicate the scaled connectivity, which is close to 1 if the correlations of each ME with the others are preserved between the two networks (the wild type and quadruple mutant), and D stands for the density, which is close to 1 if correlations between all pairs of MEs are preserved between the two networks. We found evidence for high preservation of relationships of each ME to the others: The scaled connectivity ranges from 0.76 to 0.92 (Figure 8B). Consistent with this, the overall preservation is high as reflected by D = 0.88 (Figure 8B). Thus, our analyses indicate that the quadruple mutant achieved wild-type-like gene coexpression patterns with delay in the transcriptome response during AvrRpt2-triggered ETI.
Figure 8.
Gene Coexpression Relationships Observed in Col-0 Challenged with Avirulent Pto AvrRpt2 Are Highly Preserved in dde2 ein2 pad4 sid2 Plants Challenged with the Same Strain but Altered in Col-0 Challenged with Virulent Pto DC3000.
(A) and (C) The modules identified in the transcriptome responses of Col-0 to avirulent Pto AvrRpt2 were tested for their preservation in dde2 ein2 pad4 sid2 challenged with the same strain (A) and in Col-0 challenged with virulent Pto DC3000 (C). Module size and preservation scores are shown in the x and y axes, respectively. Module numbers are shown next to the circles. Modules with Zsummary scores > 10 (above the red dotted line) are considered highly preserved, Zsummary scores between 2 and 10 (between the blue and red dotted lines) are weak to moderately preserved, and Zsummary scores < 2 (below the blue dotted line) are not preserved.
(B) and (D) Eigengene coexpression relationships in the transcriptome responses of Col-0 to avirulent Pto AvrRpt2 were compared with those in the transcriptome responses of dde2 ein2 pad4 sid2 to the same strain (B) and to those in the transcriptome responses of Col-0 to virulent Pto DC3000 (D). The overall network preservation measure D is shown above the plot.
We also compared gene coexpression relationships between interactions with virulent Pto DC3000 and ETI-triggering avirulent Pto AvrRpt2. We first plotted the time-course expression of MEs of the 22 modules calculated using gene expression data in Col-0 and the quadruple mutant challenged with virulent Pto DC3000 or mock (Supplemental Figure 4). In the quadruple mutant, most MEs showed compromised or opposite expression changes and did not reach the wild-type-like expression levels over the time course, further supporting that the JA/ethylene/PAD4/SA signaling network is required for qualitative gene regulation during interaction with virulent Pto DC3000.
We then analyzed preservation of the modules that are upregulated or downregulated in Col-0 challenged with avirulent Pto AvrRpt2. Weak to moderate preservation was observed for modules 13, 14, and 15 (Figure 8C). Moreover, defense-related modules 3 and 14 showed altered coexpression relationships with other modules (Figure 8D; Supplemental Data Set 6). These results indicate that coexpression network structure is more preserved between Col-0 and quadruple mutant challenged with Pto AvrRpt2 than between Col-0 challenged with Pto DC3000 or Pto AvrRpt2.
Dynamic and Differential Contributions of PAD4 and SID2 and Their Interactions with Transcriptional Reprogramming in Response to flg22 and Virulent or Avirulent Pto Strains
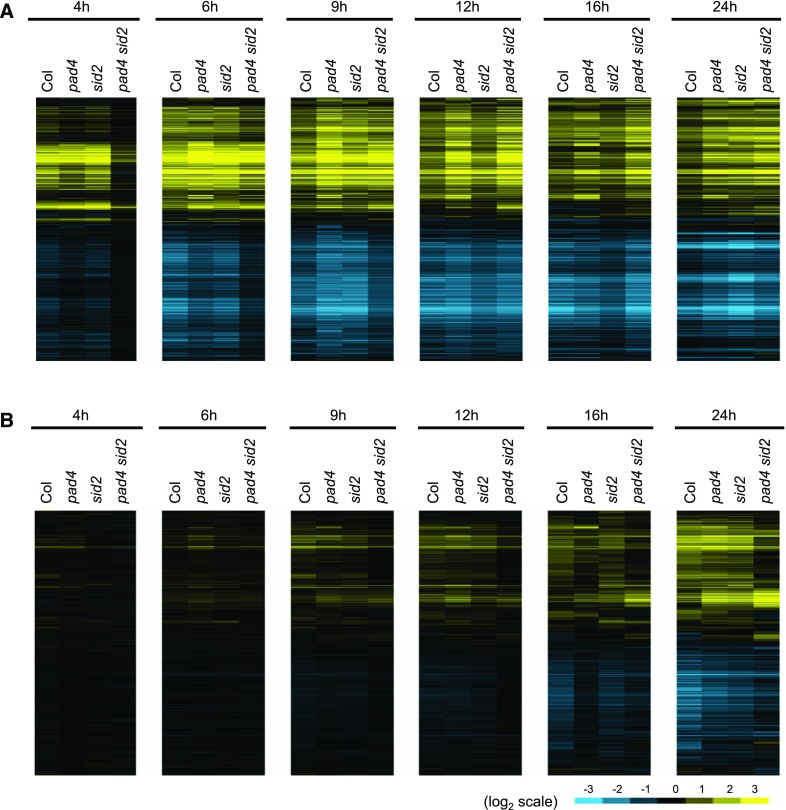
PAD4 and SID2 show genetic redundancy for bacterial resistance during ETI against avirulent Pto AvrRpt2 (Tsuda et al., 2009). However, how they redundantly contribute to bacterial resistance remains unknown. We investigated Pto AvrRpt2-triggered transcriptome changes in Col-0, pad4, sid2, and pad4 sid2 at 4, 6, 9, 12, 16, and 24 hpi. In comparison to Col-0, transcriptional responses at 4 and 6 hpi were highly compromised in pad4 sid2 but largely unaffected in pad4 and sid2 (Figure 9A; Supplemental Figure 5A). From 9 hpi, pad4 sid2 plants showed similar patterns of transcriptome responses and displayed comparable or even greater magnitudes of expression changes compared with Col-0. Thus, the genetic redundancy between PAD4 and SID2 observed for bacterial resistance during AvrRpt2-triggered ETI is associated with their redundant contributions to rapid establishment of transcriptional reprogramming. A similar analysis of transcriptome responses to virulent Pto DC3000 challenge reveals a relationship between the compromised or altered late transcriptional responses of pad4, sid2, and pad4 sid2 mutants and the similarly compromised bacterial resistance of these mutants against Pto DC3000 (Tsuda et al., 2009) (Figure 9B; Supplemental Figure 5B).
Figure 9.
Comparative Analysis of Transcriptome Dynamics Col-0, pad4, sid2, and pad4 sid2 Challenged with Avirulent Pto AvrRpt2 or Virulent Pto DC3000.
Genes that show significant expression changes in Pto AvrRpt2- or Pto DC3000-treated Col-0, pad4, sid2, and pad4 sid2 compared with mock-treated samples were selected (q < 0.01 and |log2FC| > 1, 10,599 genes). Heat maps show expression patterns of the selected genes. Pto AvrRpt2-responsive genes (A) and Pto DC3000-responsive genes (B). See also the legend of Figure 1D.
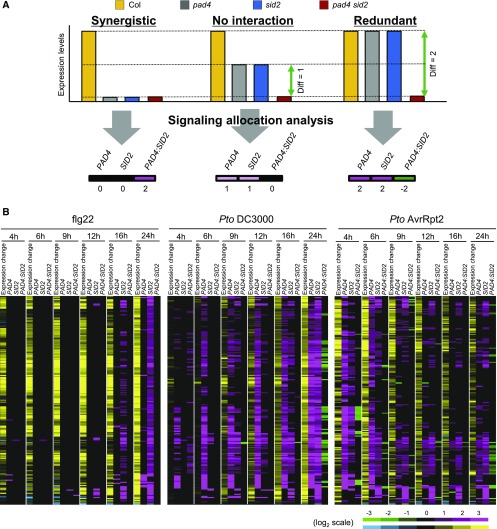
PAD4 and SID2 suppress bacterial growth in a synergistic manner during PTI, but act in a redundant manner during ETI (Tsuda et al., 2009). However, whether individual and cooperative activities of PAD4 and SID2 on expression of individual genes differ between PTI and ETI remains elusive. One approach to understand the genetic relationship between the two genes PAD4 and SID2 is to analyze the four genotypes (the wild type, pad4, sid2, and pad4 sid2) by network reconstruction, which we call signaling allocation analysis (Tsuda et al., 2009). Signaling allocation analysis has been successfully utilized to understand the relationship between two genes in control of gene expression (Tsuda et al., 2009, 2013; Mateos et al., 2015). In the signaling allocation analysis, the difference in expression of a gene between the wild type and pad4 sid2 is explained by the sum of the individual effects of PAD4 and SID2 and the PAD4:SID2 interaction. Figure 10A shows three hypothetical scenarios for genes whose expression levels are higher in the wild type than in pad4 sid2. In the case of a complete synergistic interaction, meaning that both genes are required, the expression levels in all three mutants are equally lower compared with Col-0. In this scenario, the signaling allocation becomes PAD4 = 0 (black), SID2 = 0 (black), and PAD4:SID2 = 2 (magenta). Thus, a positive value for the interaction indicates that the two genes synergistically contribute to the gene expression level in Col-0. If PAD4 and SID2 contribute to gene expression additively and independently (no interaction), the signaling allocation is PAD4 = 1 (magenta), SID2 = 1 (magenta), and PAD4:SID2 = 0 (black). If PAD4 and SID2 redundantly contribute to gene expression, the signaling allocation is PAD4 = 2 (magenta), SID2 = 2 (magenta), and PAD4:SID2 = −2 (green). Thus, a negative interaction value indicates a redundant relationship between PAD4 and SID2. The opposite signaling allocation patterns are expected for genes whose expression levels are lower in the wild type than in pad4 sid2.
Figure 10.
Dynamic and Differential Contributions of PAD4 and SID2 and Their Interactions in Response to flg22, Virulent Pto DC3000, and Avirulent Pto AvrRpt2.
(A) Scheme of three hypothetical scenarios in signaling allocation analysis of genes whose expression levels are higher in Col-0 than in pad4 sid2. If the functions of PAD4 and SID2 depend completely on each other (synergistic), the signaling allocation is PAD4 = 0 (black), SID2 = 0 (black), and PAD4:SID2 = 2 (magenta). If PAD4 and SID2 act additively and independently (no interaction), the signaling allocation is PAD4 = 1 (magenta), SID2 = 1 (magenta), and PAD4:SID2 = 0 (black). If PAD4 and SID2 fully compensate the loss of the other (redundant), the signaling allocation is PAD4 = 2 (magenta), SID2 = 2 (magenta), and PAD4:SID2 = −2 (green). Thus, positive and negative interaction values are indicative of synergistic and redundant relationships between PAD4 and SID2, respectively. Genes whose expression levels are lower in the wild type than in pad4 sid2 are expected to show the opposite signaling allocation patterns.
(B) Genes that commonly show significant transcriptional responses to flg22, Pto DC3000, and Pto AvrRpt2 in Col-0 (q < 0.01 and |log2FC| > 1) and show significantly higher or lower expression in Col-0 than in pad4 sid2 (q < 0.01 and |log2FC| > 1) were selected. The selected 193 genes were subjected to signaling allocation analysis and the statistically significant effects (q < 0.01) were visualized by heat maps (magenta-green). The gene induction and suppression levels in Col-0 are also shown (yellow-blue).
We integrated our data set and a published one (Hillmer et al., 2017) for signaling allocation analysis of the genetic relationships between PAD4 and SID2 in transcriptome responses to the MAMP flg22 (flg22-PTI), Pto DC3000, and Pto AvrRpt2. During flg22-PTI, no interaction between PAD4 and SID2 was detected but individual signaling contributed to expression of different sets of genes with SID2 being dominant (Figure 10B; Supplemental Figure 6A). Thus, the synergism between PAD4 and SID2 on bacterial resistance during flg22-PTI is unlikely to be mediated by their synergistic gene regulation. In Pto DC3000- and Pto AvrRpt2-challenged plants, PAD4 contributed to expression of larger sets of genes and most of these genes are also controlled by SID2 (Figure 10B; Supplemental Figure 6B and 6C), suggesting that living bacteria activate PAD4 in a way that is different from a pure MAMP and allows PAD4 to regulate common sets of genes with SA.
Notably, redundant relationships between PAD4 and SID2 were observed after avirulent Pto AvrRpt2 challenge at 4 hpi, the time point associated with massive transcriptional reprogramming (Figure 10B; Supplemental Figure 6C and Supplemental Data Set 7). This subset of genes is enriched for genes associated with immunity-related GO terms (Supplemental Data Set 8), and their promoter sequences show overrepresentation of binding motifs for defense-related transcription factors such as ERF, WRKY, and MYC transcription factors (Supplemental Figure 7). Thus, in contrast to flg22-PTI, the redundant contributions of PAD4 and SA to active gene regulation likely explain their compensatory interaction for bacterial resistance in ETI against avirulent Pto AvrRpt2 (Tsuda et al., 2009).
Transcriptional Reprogramming during ETI Independent of JA, Ethylene, PAD4, and SA Signaling Sectors
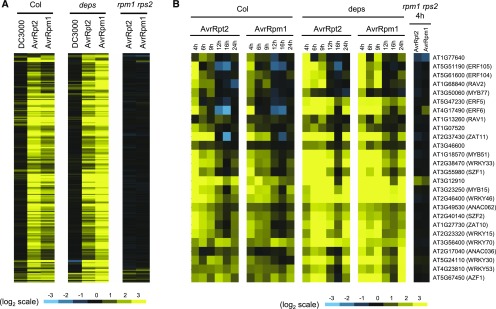
The dde2 ein2 pad4 sid2 mutant largely retains AvrRpm1-triggered ETI but shows weak, largely compromised AvrRpt2-triggered ETI (Tsuda et al., 2009), indicating that a signaling sector(s) independent of JA, ethylene, PAD4, and SA also contributes to ETI. We found that some genes are similarly induced at 4 hpi in Col-0 and dde2 ein2 pad4 sid2 upon challenge with ETI-triggering avirulent Pto AvrRpt2 and AvrRpm1 (Figure 11A; Supplemental Data Set 9). These genes are enriched for immunity-related GO terms (Supplemental Data Set 10), suggesting their active contribution to immunity. Out of these genes, 26 encode transcription factors including the four ERF transcription factors ERF5, ERF6, ERF104, and ERF105 (Figure 11B; Supplemental Data Set 11). These ERF transcription factors belong to the same subfamily and seem to play redundant and ethylene-independent roles in multiple stress responses and development (Nakano et al., 2006; Son et al., 2012; Dubois et al., 2013; Meng et al., 2013; Xu et al., 2016).
Figure 11.
Rapid Transcriptional Regulation Is Retained for Some Genes in dde2 ein2 pad4 sid2 Challenged with Avirulent Pto AvrRpt2.
Genes that show significant expression changes in dde2 ein2 pad4 sid2 (deps) at 4 hpi with avirulent Pto AvrPpt2 compared with mock were selected (q < 0.01, 205 genes). See also the legend of Figure 1D.
(A) The log2 fold changes of the selected genes in Col-0 (Col), dde2 ein2 pad4 sid2, and rpm1 rps2 at 4 hpi are visualized by heat maps.
(B) Among the selected genes, genes encoding transcription factors were extracted and their log2 fold changes in Col-0, dde2 ein2 pad4 sid2, and rpm1 rps2 over time are visualized by heat maps.
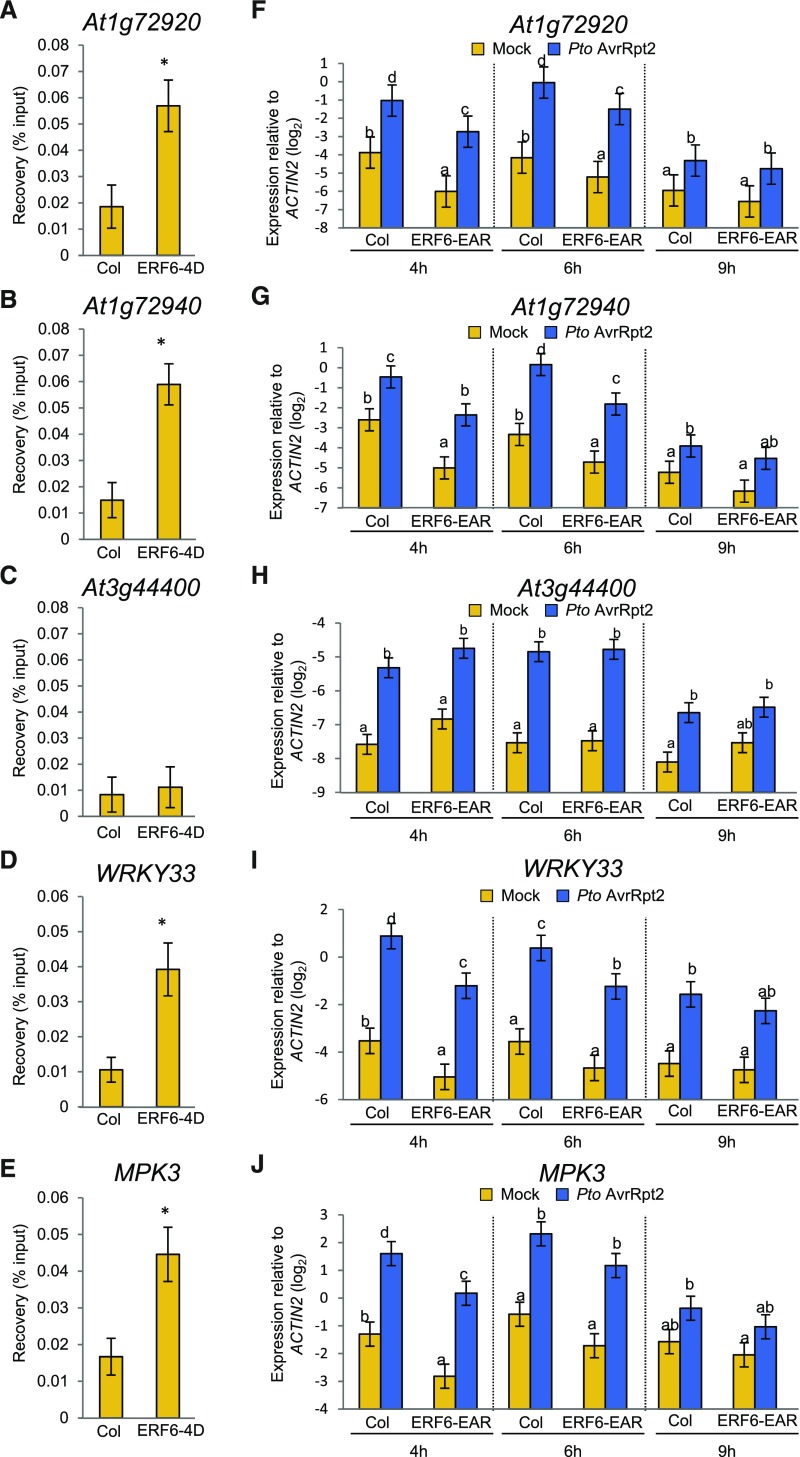
Regarding plant immunity, it was shown that expression of a dominant negative ERF6 fused to the transcriptional repressor motif EAR (ERF6-EAR) compromises resistance against the fungal pathogen Botrytis cinerea (Meng et al., 2013) and that expression of ERF5-EAR increases susceptibility to virulent Pto DC3000 (Son et al., 2012). We found that the binding motif for ERF transcription factors, the GCC-box (GCCGCC), is overrepresented within the promoters of the genes induced independently of JA/ethylene/PAD4/SA signaling network during ETI (Supplemental Figure 8). Of the GCC box-containing genes (Supplemental Data Set 12), WRKY33, MPK3, and three TNL genes At1g72920, At1g72940, and At3g44400 were selected and tested as potential targets of these ERF transcription factors. We focused on ERF6 for functional characterization because ERF6 is likely activated through phosphorylation by MPK3 and MPK6 during ETI and because these MAP kinases are active upon ETI activation (Meng et al., 2013; Tsuda et al., 2013). Chromatin immunoprecipitation (ChIP) experiments using a transgenic line expressing constitutively active ERF6 (ERF6-4D), which mimics the phosphorylated and active form of ERF6 (Meng et al., 2013), showed that ERF6 binds to the promoters of WRKY33, MPK3, At1g72920, and At1g72940 but not that of At3g44400 (Figures 12A to 12E). Overexpression of ERF6-EAR reduced the expression levels of At1g72920 and At1g72940, WRKY33 and MPK3, but not that of At3g44400 (Figures 12F to 12J). These results suggest that ERF6 and possibly its homologs ERF5, ERF104, and ERF105 contribute to the expression of genes in a manner independent of the JA/ethylene/PAD4/SA network during ETI. Consistent with this, we found that WRKY33 shows positive coexpression relationships with ME3 and ME14 (Figure 6A). Module 14 contains ERF6 that binds to the WRKY33 promoter and controls its expression (Figures 12D and 12I). Literature-curated WRKY33 target genes are highly overrepresented in module 3 (P < 3 × 10−157, hypergeometric test) (Birkenbihl et al., 2017). Thus, a likely scenario is that ERF6-driven WRKY33 expression mediates regulation of gene expression in module 3.
Figure 12.
ERF6 Regulates Expression of TIR-NB-LRRs, WRKY33, and MPK3 and Binds to GCC Box in the Promoters.
(A) to (E) ChIP-qPCR was performed using the ERF6-4D line. The input and ChIP DNA was analyzed by qPCR using primers spanning the GCCGCC sequence in the promoters of At1g72920 (A), At1g72940 (B), At3g44400 (C), WRKY33 (D), and MPK3 (E). See also Supplemental Data Set 12. Bars represent means and standard errors of the percentage of input values of the ChIP DNA, calculated from three independent experiments. Asterisks indicate statistically significant differences compared with Col-0 (Col) (P < 0.05, two-tailed t tests).
(F) to (J) Leaves of Col-0 (Col) and ERF6-EAR plants were infiltrated with mock or Pto AvrRpt2 (OD600 = 0.001) and were harvested at 4, 6, and 9 hpi. The expression levels of At1g72920 (F), At1g72940 (G), At3g44400 (H), WRKY33 (I), and MPK3 (J) were measured by RT-qPCR. Bars represent means and standard errors of two independent experiments. The Benjamini-Hochberg method was used to adjust P values to correct for multiple hypothesis testing. Statistically significant differences are indicated by different letters at each time point (adjusted P < 0.05).
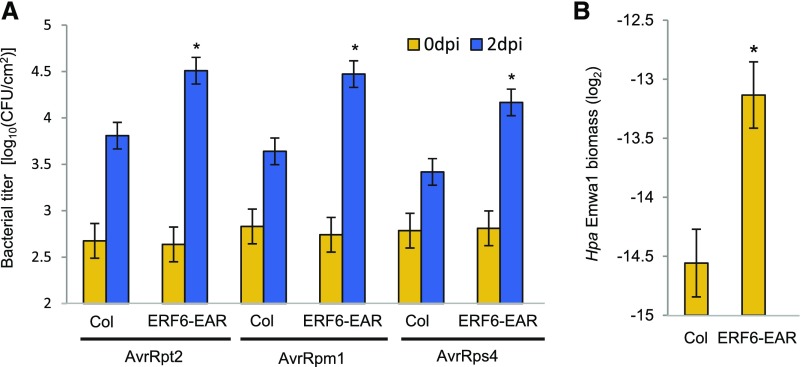
Interestingly, CNL-dependent AvrRpt2- and AvrRpm1-triggered ETI and TNL-dependent AvrRps4-triggered ETI were compromised in ERF6-EAR plants (Figure 13A). Furthermore, ERF6-EAR was more susceptible than Col-0 to the oomycete pathogen Hyaloperonospora arabidopsidis isolate Emwa1 (Figure 13B), which triggers ETI via the TNL RPP4 in Col-0 (van der Biezen et al., 2002). Thus, the ERF6-mediated transcriptional cascade is critical for multiple cases of ETI against bacterial and eukaryotic pathogens.
Figure 13.
Expression of a Dominant-Negative ERF6-EAR Compromises ETI.
(A) Leaves of Col and ERF6-EAR plants were infiltrated with Pto AvrRpt2, Pto AvrRpm1, or Pto AvrRps4 (OD600 = 0.001). The bacterial titers at 0 or 2 dpi were measured. Bars represent means and standard errors of two independent experiments with at least 4 or 12 biological replicates for 0 or 2 dpi in each experiment, respectively. Asterisks indicate statistically significant differences compared with Col-0 (Col) (P < 0.05, two-tailed t tests).
(B) The Hpa isolate Emwa1 was spray-inoculated onto leaves of Col-0 (Col) and ERF6-EAR plants. The abundance of Hpa DNA (5.8S rDNA) relative to plant DNA (ACTIN2) was determined by qPCR at 7 dpi. Bars represent means and standard errors of two independent experiments with seven to nine biological replicates in each experiment. Asterisks indicate statistically significant differences compared with Col-0 (P < 0.05, two-tailed t tests).
DISCUSSION
In this study, we have shown that the JA/ethylene/PAD4/SA signaling network is required for rapid establishment of transcriptional reprogramming but not qualitative gene regulation during ETI against avirulent Pto AvrRpt2. Moreover, our coexpression network analyses demonstrated that despite the remarkable difference in temporal transcriptome responses, gene coexpression relationships are highly conserved between the wild type and the quadruple mutant during AvrRpt2-triggered ETI. In sharp contrast, a previous study showed that during PTI triggered by the MAMP flg22, over 5000 genes are regulated dependently on the JA/ethylene/PAD4/SA network and that components within the network regulate those genes in a complex manner (Hillmer et al., 2017). Thus, the role of the network in transcriptional reprogramming is fundamentally different between flg22-triggered PTI and Pto AvrRpt2-triggered ETI despite that the degree of contribution of the network to bacterial resistance is similar (Tsuda et al., 2009).
Our time-resolved and comparative analysis clearly linked the establishment of transcriptional reprogramming within the early time window to effective bacterial resistance during ETI: Resistant genotypes showed early establishment of transcriptional reprogramming while susceptible genotypes did not. Pto DC3000 is highly virulent owing to an arsenal of virulence effectors that modulate PTI-associated transcriptional reprogramming (Lewis et al., 2015). In contrast, Pto DC3000 strains expressing a recognized effector are avirulent due to activation of ETI despite the presence of a battery of virulence-conferring effectors. Thus, when plants establish ETI early enough, bacterial pathogens cannot overcome plant immunity anymore. Notably, it is common for both plant and animal bacterial pathogens to develop biofilms in infected hosts, which provide resistance against host immunity (Danhorn and Fuqua, 2007; Roilides et al., 2015). Although it is currently unknown if Pto DC3000 develops biofilms in infected plants, the presence of genes responsible for biofilm formation implies this possibility (Buell et al., 2003). It will be of key importance to investigate how bacterial pathogens behave during infection and how plant immunity influences bacterial behaviors on a global scale and with temporal resolution.
It will be an important future challenge to define the mechanism by which the JA/ethylene/PAD4/SA network ensures the rapid establishment of transcriptional reprogramming within the early time window. Recently, it was shown that a signaling sector, designated ETI-mediating and PTI-inhibited signaling (EMPIS) (Hatsugai et al., 2017), is activated during ETI but, at the same time, is inhibited by PTI that is inevitably activated by pathogen challenge (Hatsugai et al., 2017). During AvrRpt2-triggered ETI, the JA/ethylene/PAD4/SA signaling network might control the timing of EMPIS activation by releasing EMPIS from inhibition by PTI. If EMPIS can control the overall pattern of transcriptional reprogramming during ETI, the JA/ethylene/PAD4/SA signaling network could mediate the rapid transcriptional reprogramming during AvrRpt2-triggered ETI through EMPIS. Upon Pto AvrRpm1 challenge, EMPIS activation is assumed to be sufficiently fast to override its inhibition by PTI even in the quadruple mutant (Hatsugai et al., 2017). Consistently, the quadruple mutant achieves the rapid transcriptional reprogramming and exhibits the largely retained bacterial resistance during AvrRpm1-triggered ETI. Nevertheless, it is also possible that the JA/ethylene/PAD4/SA signaling network contributes to the rapid transcriptional reprogramming during AvrRpt2-triggered ETI without involving EMPIS.
Phytohormones such as JA and SA have been proposed to mediate systemic acquired resistance (SAR), which is associated with priming of defense gene expression (Fu and Dong, 2013). Priming in SAR is analogous to the rapid transcriptional reprogramming mediated by the JA/ethylene/PAD4/SA network in Pto AvrRpt2-triggered ETI. Interestingly, like SAR, which is effective against a broad spectrum of pathogens (Fu and Dong, 2013), ETI confers resistance against bacterial, fungal, oomycete, viral, nematode, and herbivorous insect pathogens (Kandoth and Mitchum, 2013; Jaouannet et al., 2014; Cui et al., 2015; Gouveia et al., 2017). Thus, rapid transcriptional response may be a common key factor for broad spectrum resistance against pathogens. Elucidating whether or not rapid transcriptional reprogramming in ETI and SAR operates via a similar mechanism will be of great interest.
We identified a group of genes that are regulated independently of JA/ethylene/PAD4/SA network upon ETI activation. We showed that one of these genes, ERF6, contributes to ETI activated by the CNLs RPS2 and RPM1 as well as by the TNLs RPS4 and RPP4, suggesting that ERF6 is a common component of TNL- and CNL-activated ETI against the biotrophic bacterial and oomycete pathogens. We showed that ERF6 binds to the promoters of and controls expression of two TNL genes (At1g72920 and At1g72940), MPK3 and WRKY33, which are all well-known immune regulators (Meng and Zhang, 2013; Buscaill and Rivas, 2014; Cui et al., 2015). Accumulating evidence suggests that increased expression of NLRs can lead to immune activation without effector recognition (Tao et al., 2000; Stokes et al., 2002; Wirthmueller et al., 2007). Thus, ERF6-mediated TNL expression may boost ETI.
In summary, our results suggest that the JA/ethylene/PAD4/SA signaling network, which only controls the amplitude of early transcriptional reprogramming, and the ERF6 transcriptional cascade, which functions independently of JA, ethylene, PAD4, and SA signaling, are both important determinants for effective establishment of ETI.
METHODS
Plant Materials and Growth Conditions
The Arabidopsis thaliana accession Col-0 was the background of all Arabidopsis mutants used in this study. The Arabidopsis mutant rpm1-3 rps2-101C (Mackey et al., 2003) and combinatorial mutants (Tsuda et al., 2009) of the Arabidopsis mutants dde2-2 (von Malek et al., 2002), ein2-1 (Alonso et al., 1999), pad4-1 (Jirage et al., 1999), and sid2-2 (Wildermuth et al., 2001) were described previously. The ERF6-4D and ERF6-EAR plants (Meng et al., 2013) were obtained from Shuqun Zhang (University of Missouri). Plants were grown in a chamber at 22°C with a 10-h-light (white fluorescence lamps) period and 60% relative humidity for 3 weeks and then in another chamber at 22°C with a 12-h-light period and 60% relative humidity. Thirty- to thirty-three-day-old plants were used for experiments.
RNA-Seq and Data Analysis
Leaves of the wild type and all the single, double, triple, and quadruple mutant plants were syringe-infiltrated with mock (water) or suspensions of Pseudomonas syringae pv tomato DC3000 (Pto DC3000) carrying an empty vector (pLAFR), Pto DC3000 carrying AvrRpt2, or Pto DC3000 carrying AvrRpm1 at the OD600 of 0.001. Similarly, leaves of the rpm1-3 rps2-101C mutant plants were inoculated with mock, Pto DC3000 carrying AvrRpt2, or Pto DC3000 carrying AvrRpm1. Three fully expanded leaves (leaves 7–9) from three different plants were harvested as a single biological replicate at 1, 2, 3, 4, 6, 9, 12, 16, 20, 24, 36, and 48 hpi and stored at −80°C until use. To generate three biological replicates, three independent experimental trials were performed, in which plant positions within pots and growth chambers were randomized in order to avoid undesirable systematic effects. In total, 2556 samples (17 genotypes × 12 time points × 4 treatments × 3 biological replicates for the combinatorial mutants + 12 time points × 3 treatments × 3 biological replicates for rpm1 rps2) were collected.
Of the 2556 samples, 348 were subjected to RNA-seq (Col-0 × mock, Pto, Pto AvrRpt2, Pto AvrRpm1 × 1, 3, 4, 6, 9, 12, 16, 24 hpi × 3 biological replicates [96 samples]; dde2 ein2 pad4 sid2 × mock, Pto, Pto AvrRpt2, Pto AvrRpm1 × 4, 6, 9, 12, 16, 24 hpi × 3 biological replicates [72 samples]; pad4, sid2, pad4 sid2 × mock, Pto, Pto AvrRpt2 × 4, 6, 9, 12, 16, 24 hpi × 3 biological replicates [162 samples]; rpm1 rps2 × mock, Pto AvrRpt2, Pto AvrRpm1 × 1, 4 hpi × 3 biological replicates [18 samples]). RNA libraries were prepared from 1 μg of total RNA isolated using TRIzol reagent (Invitrogen) and treated with DNase I (Roche). Poly(A) enrichment and library preparation were performed with NEBNext Ultra Directional RNA Library Prep Kit for Illumina (New England Biolabs). Libraries were quantified by fluorometry, immobilized, and processed onto a flow cell with a cBot (Illumina), followed by sequencing-by-synthesis with HiSeq v3 chemistry on a HiSeq 2500 (Illumina) system. Library construction and RNA sequencing were performed by the Max Planck-Genome-Centre Cologne (http://mpgc.mpipz.mpg.de/home/). Reads were mapped to the Arabidopsis genome (TAIR10) using the splice-aware read aligner TopHat and transformed into a count per gene per library by using HTSeq (Anders et al., 2015). The RNA-seq data used in this study are deposited in the National Center for Biotechnology Information Gene Expression Omnibus database (accession number GSE88798).
The statistical analysis of the RNA-seq data was performed in the R environment (version 3.2.2). Genes with fewer than 10 reads per library on average were excluded. Since poly(A) enrichment was performed during library preparation, mitochondrial and chloroplast genes were also excluded. The count data of the remaining nuclear genome-encoded genes (18,419) was normalized with normalization factors calculated by the function calcNormFactors in the package edgeR and log-transformed by the function voom in the package limma to yield log2 counts per million. To each gene, a linear model was fit using the function lmFit in the limma package with the following terms: Sgytr = GYTgyt + ɛgytr, where S, log2 expression value, GYT, genotype:treatment:time interaction, and ɛ, residual. The eBayes function in the limma package was used for variance shrinkage in calculation of the P values, which was then used to calculate the Storey’s q-values using the qvalue function in the qvalue package. To extract genes with significant expression changes, the cutoff of q-value < 0.01 was applied. The prcomp function was used for principal component analysis. GO enrichment was performed using agriGO with default settings (Du et al., 2010). For motif enrichment analysis, the 1000 bp upstream of the transcription start sites of the selected genes were tested for enrichment of the known cis-elements using AME (McLeay and Bailey, 2010; Franco-Zorrilla et al., 2014). The heat maps were generated with CLUSTER (Eisen et al., 1998) using uncentered Pearson correlation and average linkage and visualized by TREEVIEW (Eisen et al., 1998). For signaling allocation analysis, effects of PAD4, SID2, and their interaction were calculated for each gene by specifying contrasts using the makeContrast function in the limma package as follows: The effect of PAD4 or SA was calculated by subtracting the expression value of a gene in pad4 sid2 from that in sid2 or pad4, respectively. The effect of the PAD4:SID2 interaction was calculated by subtracting the sum of the PAD4 and SA effects from the difference in expression values between Col-0 and pad4 sid2.
Coexpression network analysis was performed using the R package WGCNA (Langfelder and Horvath, 2008). Normalized and log2-transformed read counts of wild-type samples at 4, 6, 9, 12, 16, and 24 h after treatment with mock or Pto AvrRpt2 were used for constructing a singed hybrid network. After excluding genes with little expression variances (<0.2) across the samples, a matrix of Pearson correlation between all pairs of 13,080 genes was calculated. The adjacency matrix was then constructed by raising the correlation matrix to the power of 18, which assures scale-free topology of the constructed network. The topological overlap, which is a robust and biologically meaningful measure of network connectivity, was calculated from the adjacency matrix. Average linkage hierarchical clustering was applied to the topological overlap for grouping genes with highly similar coexpression relationships. The Dynamic Hybrid Tree Cut algorithm was used to cut the hierarchal clustering tree, and modules were defined as branches from the tree cutting. The expression profile of each module was summarized by module eigengene defined as its first principal component. Modules whose eigengenes were highly correlated (correlation >0.8) were merged, resulting in 22 modules. Expression levels of the eigengenes were recalculated using the gene expression data in the mock- or Pto AvrRpt2-treated wild type and the quadruple mutant. For motif enrichment analysis using AME, the 1000 bp upstream of the transcription start sites of the members of the upregulated or downregulated modules were tested for enrichment of the known cis-elements with the set of genes from the nondifferentially expressed modules as the control. Eigengene-based gene connectivity, kME, was calculated using the signedKME function in the WGCNA package and was used to visualize relationships between transcription factors and expression patterns of module eigengenes using Cytoscape (Shannon et al., 2003).
Preservation analyses were performed with the gene expression data in the Pto AvrRpt2-treated wild type and quadruple mutant. To assess the preservation of wild-type modules in the quadruple mutant, the modulePreservation function in the WGCNA package was used (Langfelder et al., 2011). The resulting statistic, Zsummary, is indicative of module preservation based on similarity of the network properties, density, and connectivity, between different networks. In general, modules with Zsummary scores >10 are considered highly preserved, Zsummary scores between 2 and 10 are weak to moderately preserved, and Zsummary scores <2 are not preserved. To examine the preservation of coexpression relationships between modules in the wild type and the quadruple mutant, the plotEigengeneNetworks function in the WGCNA package was used (Langfelder and Horvath, 2007).
Biological Replicates and Statistical Analysis
In the bacterial growth assays, one leaf disc collected from one bacteria-infiltrated leaf was considered as one biological replicate. In the Hyaloperonospora arabidopsidis (Hpa) infection assay, a pool of two plants grown on the same pot was harvested as one biological replicate. In the RNA-seq experiments and gene expression analysis, a pool of nine leaves collected from three different bacteria-infiltrated plants grown on the same pot (three leaves per plant) were considered one biological replicate. In the qPCR-based quantification, typically three technical replicates were measured and averaged. The averaged values were considered as one biological replicate. In all experiments, independent trials were made at least two times and all measured values were used for presentation.
Statistical analysis was performed using the mixed linear model function, lmer, implemented in the package lme4 in the R environment. When appropriate, raw data were log transformed to meet the assumptions of the mixed linear model. For the t tests, the standard errors were calculated using the variance and covariance values obtained from the model fitting. The Benjamini-Hochberg methods were applied to correct for multiple hypothesis testing when all pairwise comparisons of the mean estimates were made in a figure.
Bacterial Growth Assay
Bacterial growth assays were performed essentially as described previously (Tsuda et al., 2009). Briefly, two leaves out of leaf position 7-9 in the wild-type and the ERF6-EAR plants were syringe-inoculated with suspensions of Pto DC3000 carrying AvrRpt2 (pLAFR), AvrRpm1 (pLAFR), or AvrRps4 (pVSP61) using a needleless syringe. A leaf disc collected from the infiltrated leaf was considered a biological replicate. In each experiment, six different plants were infiltrated. Log10-transformed colony-forming units (cfu) per cm2 leaf surface area were calculated and the following model was fit to the data using the lmer function in the lme4 package in the R environment; cfugyr = GYgy + Rr + egyr, where GY, genotype:treatment interaction, and random factors; R, biological replicate; e, residual. The mean estimates of the fixed effects were compared by two-tailed t tests.
Hpa Infection Assay
Three-week-old wild-type and ERF6-EAR plants were spray-inoculated with Hpa Emwa1 at 4 × 10⁴ spores/mL (Stuttmann et al., 2011). One week after inoculation, two plants were pooled as a single biological replicate. In each experiment, seven to nine biological replicates were obtained per genotype. DNA extraction was performed as described (Ruhe et al., 2016). The amounts of Hpa DNA and plant DNA were determined by quantitative PCR on the CFX Connect Real-Time PCR Detection System (Bio-Rad) using EvaGreen (Biotium). Primers used are listed in Supplemental Table 1. The following model was fit to the Ct value of Hpa DNA relative to Arabidopsis DNA: Ctgr = Gg + Rr + egr, where G, genotype, and random factors; R, biological replicate; e, residual. The mean estimates of the fixed effects were used as the modeled relative Ct values, visualized as the relative log2 Hpa biomass, and compared by two-tailed t tests as described above.
Chromatin Immunoprecipitation
Tissue fixation and chromatin immunoprecipitation were performed as described (Yamaguchi et al., 2014) with some modifications. Briefly, 2-week-old seedlings of the ERF6-4D line grown in liquid half-strength MS medium supplemented with 1% sucrose were fixed in 1% formaldehyde solution. Fixed tissues were frozen in liquid nitrogen and stored at −80°C. Frozen tissues (∼1 g) were ground in liquid nitrogen using a mortar and pestle and suspended in 3 mL of lysis buffer (50 mM Tris-HCl, pH 8.0, 2 mM EDTA, 150 mM NaCl, 1% Triton X-100, 50 µM MG132 (Sigma-Aldrich), and complete protease inhibitor cocktails [Roche]). The suspension was sonicated twice on the Bioruptor Next Gen UCD-300 sonication system (Diagenode) for 10 min at 4°C, followed by centrifugation at 20,000g for 10 min at 4°C. The supernatant was used as the starting material for chromatin immunoprecipitation using anti-Myc-Tag antibody (71D10; Cell Signaling Technology). Aliquots of the supernatant were kept as input samples. The samples were analyzed by quantitative PCR using EvaGreen on the CFX Connect Real-Time PCR Detection System. Primers used are listed in Supplemental Table 1. The percentage of input values of the ChIP DNA was calculated. For statistical analysis, the following model was fit to log2-transformed values of the percentage of input values of the ChIP DNA; Ctgyr = Gg + Rr + egyr, where G, genotype and random factors; R, biological replicate; e, residual. The mean estimates of the fixed effects were compared by two-tailed t tests as described above.
Gene Expression Analysis
Total RNA was isolated using TriFast (peqlab) from leaves of the wild-type and ERF6-EAR plants treated with mock, Pto DC3000, Pto AvrRpt2, or Pto AvrRpm1 (OD600 = 0.001), followed by cDNA synthesis using Superscript II (Life Technologies). Real-time PCR was performed using EvaGreen on the CFX Connect real-time PCR detection system. Primers used are listed in Supplemental Table 1. The following model was fit to the relative Ct value data compared with ACTIN2: Ctgyr = GYTgyt + Rr + egytr, where GYT, genotype:treatment:time interaction, and random factors; R, biological replicate; e, residual. The mean estimates of the fixed effects were used as the modeled relative Ct values, visualized as the relative log2 expression values, and compared by two-tailed t tests as described above. For correcting the multiple hypothesis testing, the Benjamini-Hochberg method was used to adjust P values.
Accession Numbers
The accession numbers for the genes discussed in this article are as follows: ACTIN2 (At3g18780), DDE2 (AT5G42650), EIN2 (AT5G03280), PAD4 (AT3G52430), SID2 (At1g74710), ERF6 (AT4G17490), MPK3 (AT3G45640), and WRKY33 (AT2G38470). Sequence data from this article can be found in the Arabidopsis Genome Initiative or GenBank/EMBL databases under accession number GSE88798.
Supplemental Data
Supplemental Figure 1. GO enrichment analysis of differentially regulated genes classified based on the timing of expression changes.
Supplemental Figure 2. Principal component analysis of the time-series transcriptome data in Col-0.
Supplemental Figure 3. Expression patterns of coexpression modules in Col-0 challenged with avirulent Pto AvrRpt2 or mock.
Supplemental Figure 4. Expression patterns of coexpression modules in Col-0 and dde2 ein2 pad4 sid2 challenged with virulent Pto DC3000 or mock.
Supplemental Figure 5. Comparative analysis of transcriptome dynamics in Col-0, pad4, sid2, and pad4 sid2 challenged with avirulent Pto AvrRpt2 or virulent Pto.
Supplemental Figure 6. Signaling allocation analysis of the effects of PAD4, SID2, and their interaction on gene expression in response to flg22, Pto DC3000, or Pto AvrRpt2.
Supplemental Figure 7. Motif enrichment analysis of the genes that are redundantly regulated by PAD4 and SID2 at 4 h after infiltration with Pto AvrRpt2.
Supplemental Figure 8. Motif enrichment analysis of the genes whose rapid transcriptional regulation is retained in dde2 ein2 pad4 sid2 challenged with Pto AvrRpt2.
Supplemental Table 1. Primers used in this study.
Supplemental Data Set 1. GO enrichment analysis of the genes that show significant induction or suppression in Col-0 challenged with avirulent Pto AvrRpt2.
Supplemental Data Set 2. GO enrichment analysis of the genes that show significant induction or suppression in Col-0 challenged with avirulent Pto AvrRpm1.
Supplemental Data Set 3. GO enrichment analysis of the genes that show significant induction or suppression in Col-0 challenged with virulent Pto DC3000.
Supplemental Data Set 4. Description of ETI-specific genes.
Supplemental Data Set 5. Description of the genes in each coexpression module.
Supplemental Data Set 6. GO enrichment analysis of the genes in each coexpression module.
Supplemental Data Set 7. Description of the genes that are redundantly regulated by PAD4 and SID2 4 h after infiltration with avirulent Pto AvrRpt2.
Supplemental Data Set 8. GO enrichment analysis of the genes that are redundantly regulated by PAD4 and SID2 4 h after infiltration with avirulent Pto AvrRpt2.
Supplemental Data Set 9. Description of the genes that show significant expression changes in Pto AvrRpt2-treated dde2 ein2 pad4 sid2 compared with mock at 4 hpi.
Supplemental Data Set 10. GO enrichment analysis of the genes that show significant expression changes in Pto AvrRpt2-treated dde2 ein2 pad4 sid2 compared with mock at 4 hpi.
Supplemental Data Set 11. Description of the genes encoding transcription factors that show significant expression changes in Pto AvrRpt2-treated dde2 ein2 pad4 sid2 compared with mock at 4 hpi.
Supplemental Data Set 12. Description of the genes that contain the GCCGCC sequence in their promoters and that show significant expression changes in Col or dde2 ein2 pad4 sid2 treated with Pto AvrRpt2 compared with mock at 4 hpi.
Acknowledgments
We thank Shuqun Zhang (University of Missouri) for providing the ERF6-4D and ERF6-EAR lines and Fumiaki Katagiri and Jane Glazebrook (University of Minnesota) for critical reading of the manuscript. A.M. was a recipient of a Postdoctoral Fellowship for Research Abroad from the Japanese Society for the Promotion of Science. This work was supported by the Max Planck Society and Deutsche Forschungsgemeinschaft Grant SFB670 (B.K. and K.T.), by a Grant-in-Aid for Japan Society for the Promotion of Science Fellows (15J09701) and a Grant-in-Aid for young scientists (B) (17K17802) (A.M.), and by PRESTO, Japan Science and Technology Agency, and the Ritsumeikan Global Innovation Research Organization (A.M.).
AUTHOR CONTRIBUTIONS
A.M. coordinated the project, prepared the RNA-seq samples, analyzed the RNA-seq data, carried out the functional analysis of ERF6 and wrote the article. C.S prepared the RNA-seq samples. B.K. analyzed the RNA-seq data. M.L.B. participated in the functional analysis of ERF6. D.B. contributed to the materials. K.T. supervised the project, analyzed and discussed the data, and wrote the article.
Footnotes
Articles can be viewed without a subscription.
References
- Alcázar R., Reymond M., Schmitz G., de Meaux J. (2011). Genetic and evolutionary perspectives on the interplay between plant immunity and development. Curr. Opin. Plant Biol. 14: 378–384. [DOI] [PubMed] [Google Scholar]
- Alonso J.M., Hirayama T., Roman G., Nourizadeh S., Ecker J.R. (1999). EIN2, a bifunctional transducer of ethylene and stress responses in Arabidopsis. Science 284: 2148–2152. [DOI] [PubMed] [Google Scholar]
- Anders S., Pyl P.T., Huber W. (2015). HTSeq--a Python framework to work with high-throughput sequencing data. Bioinformatics 31: 166–169. [DOI] [PMC free article] [PubMed] [Google Scholar]
- Asai S., Shirasu K. (2015). Plant cells under siege: plant immune system versus pathogen effectors. Curr. Opin. Plant Biol. 28: 1–8. [DOI] [PubMed] [Google Scholar]
- Ausubel F.M. (2005). Are innate immune signaling pathways in plants and animals conserved? Nat. Immunol. 6: 973–979. [DOI] [PubMed] [Google Scholar]
- Axtell M.J., Staskawicz B.J. (2003). Initiation of RPS2-specified disease resistance in Arabidopsis is coupled to the AvrRpt2-directed elimination of RIN4. Cell 112: 369–377. [DOI] [PubMed] [Google Scholar]
- Birkenbihl R.P., Kracher B., Somssich I.E. (2017). Induced genome-wide binding of three Arabidopsis WRKY transcription factors during early MAMP-triggered immunity. Plant Cell 29: 20–38. [DOI] [PMC free article] [PubMed] [Google Scholar]
- Birker D., Heidrich K., Takahara H., Narusaka M., Deslandes L., Narusaka Y., Reymond M., Parker J.E., O’Connell R. (2009). A locus conferring resistance to Colletotrichum higginsianum is shared by four geographically distinct Arabidopsis accessions. Plant J. 60: 602–613. [DOI] [PubMed] [Google Scholar]
- Boller T., Felix G. (2009). A renaissance of elicitors: perception of microbe-associated molecular patterns and danger signals by pattern-recognition receptors. Annu. Rev. Plant Biol. 60: 379–406. [DOI] [PubMed] [Google Scholar]
- Buell C.R., et al. (2003). The complete genome sequence of the Arabidopsis and tomato pathogen Pseudomonas syringae pv. tomato DC3000. Proc. Natl. Acad. Sci. USA 100: 10181–10186. [DOI] [PMC free article] [PubMed] [Google Scholar]
- Buscaill P., Rivas S. (2014). Transcriptional control of plant defence responses. Curr. Opin. Plant Biol. 20: 35–46. [DOI] [PubMed] [Google Scholar]
- Cui H., Tsuda K., Parker J.E. (2015). Effector-triggered immunity: from pathogen perception to robust defense. Annu. Rev. Plant Biol. 66: 487–511. [DOI] [PubMed] [Google Scholar]
- Danhorn T., Fuqua C. (2007). Biofilm formation by plant-associated bacteria. Annu. Rev. Microbiol. 61: 401–422. [DOI] [PubMed] [Google Scholar]
- Du Z., Zhou X., Ling Y., Zhang Z., Su Z. (2010). agriGO: a GO analysis toolkit for the agricultural community. Nucleic Acids Res. 38: W64–W70. [DOI] [PMC free article] [PubMed] [Google Scholar]
- Dubois M., Skirycz A., Claeys H., Maleux K., Dhondt S., De Bodt S., Vanden Bossche R., De Milde L., Yoshizumi T., Matsui M., Inzé D. (2013). Ethylene Response Factor6 acts as a central regulator of leaf growth under water-limiting conditions in Arabidopsis. Plant Physiol. 162: 319–332. [DOI] [PMC free article] [PubMed] [Google Scholar]
- Eisen M.B., Spellman P.T., Brown P.O., Botstein D. (1998). Cluster analysis and display of genome-wide expression patterns. Proc. Natl. Acad. Sci. USA 95: 14863–14868. [DOI] [PMC free article] [PubMed] [Google Scholar]
- Franco-Zorrilla J.M., López-Vidriero I., Carrasco J.L., Godoy M., Vera P., Solano R. (2014). DNA-binding specificities of plant transcription factors and their potential to define target genes. Proc. Natl. Acad. Sci. USA 111: 2367–2372. [DOI] [PMC free article] [PubMed] [Google Scholar]
- Fu Z.Q., Dong X. (2013). Systemic acquired resistance: turning local infection into global defense. Annu. Rev. Plant Biol. 64: 839–863. [DOI] [PubMed] [Google Scholar]
- Gouveia B.C., Calil I.P., Machado J.P.B., Santos A.A., Fontes E.P.B. (2017). Immune receptors and co-receptors in antiviral innate immunity in plants. Front. Microbiol. 7: 2139. [DOI] [PMC free article] [PubMed] [Google Scholar]
- Hatsugai N., Igarashi D., Mase K., Lu Y., Tsuda Y., Chakravarthy S., Wei H.-L., Foley J.W., Collmer A., Glazebrook J., Katagiri F. (2017). A plant effector-triggered immunity signaling sector is inhibited by pattern-triggered immunity. EMBO J. 36: 2758–2769. [DOI] [PMC free article] [PubMed] [Google Scholar]
- Heil M., Baldwin I.T. (2002). Fitness costs of induced resistance: emerging experimental support for a slippery concept. Trends Plant Sci. 7: 61–67. [DOI] [PubMed] [Google Scholar]
- Hillmer R.A., Tsuda K., Rallapalli G., Asai S., Truman W., Papke M.D., Sakakibara H., Jones J.D.G., Myers C.L., Katagiri F. (2017). The highly buffered Arabidopsis immune signaling network conceals the functions of its components. PLoS Genet. 13: e1006639. [DOI] [PMC free article] [PubMed] [Google Scholar]
- Huot B., Yao J., Montgomery B.L., He S.Y. (2014). Growth-defense tradeoffs in plants: a balancing act to optimize fitness. Mol. Plant 7: 1267–1287. [DOI] [PMC free article] [PubMed] [Google Scholar]
- Jaouannet M., Rodriguez P.A., Thorpe P., Lenoir C.J.G., MacLeod R., Escudero-Martinez C., Bos J.I.B. (2014). Plant immunity in plant-aphid interactions. Front. Plant Sci. 5: 663. [DOI] [PMC free article] [PubMed] [Google Scholar]
- Jirage D., Tootle T.L., Reuber T.L., Frost L.N., Feys B.J., Parker J.E., Ausubel F.M., Glazebrook J. (1999). Arabidopsis thaliana PAD4 encodes a lipase-like gene that is important for salicylic acid signaling. Proc. Natl. Acad. Sci. USA 96: 13583–13588. [DOI] [PMC free article] [PubMed] [Google Scholar]
- Jones J.D.G., Dangl J.L. (2006). The plant immune system. Nature 444: 323–329. [DOI] [PubMed] [Google Scholar]
- Kandoth P.K., Mitchum M.G. (2013). War of the worms: how plants fight underground attacks. Curr. Opin. Plant Biol. 16: 457–463. [DOI] [PubMed] [Google Scholar]
- Langfelder P., Horvath S. (2007). Eigengene networks for studying the relationships between co-expression modules. BMC Syst. Biol. 1: 54. [DOI] [PMC free article] [PubMed] [Google Scholar]
- Langfelder P., Horvath S. (2008). WGCNA: an R package for weighted correlation network analysis. BMC Bioinformatics 9: 559. [DOI] [PMC free article] [PubMed] [Google Scholar]
- Langfelder P., Luo R., Oldham M.C., Horvath S. (2011). Is my network module preserved and reproducible? PLOS Comput. Biol. 7: e1001057. [DOI] [PMC free article] [PubMed] [Google Scholar]
- Lewis L.A., et al. (2015). Transcriptional dynamics driving MAMP-triggered immunity and pathogen effector-mediated immunosuppression in Arabidopsis leaves following infection with Pseudomonas syringae pv tomato DC3000. Plant Cell 27: 3038–3064. [DOI] [PMC free article] [PubMed] [Google Scholar]
- Lu H., Zou Y., Feng N. (2010). Overexpression of AHL20 negatively regulates defenses in Arabidopsis. J. Integr. Plant Biol. 52: 801–808. [DOI] [PubMed] [Google Scholar]
- Macho A.P., Zipfel C. (2014). Plant PRRs and the activation of innate immune signaling. Mol. Cell 54: 263–272. [DOI] [PubMed] [Google Scholar]
- Mackey D., Holt B.F. III, Wiig A., Dangl J.L. (2002). RIN4 interacts with Pseudomonas syringae type III effector molecules and is required for RPM1-mediated resistance in Arabidopsis. Cell 108: 743–754. [DOI] [PubMed] [Google Scholar]
- Mackey D., Belkhadir Y., Alonso J.M., Ecker J.R., Dangl J.L. (2003). Arabidopsis RIN4 is a target of the type III virulence effector AvrRpt2 and modulates RPS2-mediated resistance. Cell 112: 379–389. [DOI] [PubMed] [Google Scholar]
- Maekawa T., Kufer T.A., Schulze-Lefert P. (2011). NLR functions in plant and animal immune systems: so far and yet so close. Nat. Immunol. 12: 817–826. [DOI] [PubMed] [Google Scholar]
- Mateos J.L., Madrigal P., Tsuda K., Rawat V., Richter R., Romera-Branchat M., Fornara F., Schneeberger K., Krajewski P., Coupland G. (2015). Combinatorial activities of SHORT VEGETATIVE PHASE and FLOWERING LOCUS C define distinct modes of flowering regulation in Arabidopsis. Genome Biol. 16: 31. [DOI] [PMC free article] [PubMed] [Google Scholar]
- McLeay R.C., Bailey T.L. (2010). Motif enrichment analysis: a unified framework and an evaluation on ChIP data. BMC Bioinformatics 11: 165. [DOI] [PMC free article] [PubMed] [Google Scholar]
- Meng X., Zhang S. (2013). MAPK cascades in plant disease resistance signaling. Annu. Rev. Phytopathol. 51: 245–266. [DOI] [PubMed] [Google Scholar]
- Meng X., Xu J., He Y., Yang K.Y., Mordorski B., Liu Y., Zhang S. (2013). Phosphorylation of an ERF transcription factor by Arabidopsis MPK3/MPK6 regulates plant defense gene induction and fungal resistance. Plant Cell 25: 1126–1142. [DOI] [PMC free article] [PubMed] [Google Scholar]
- Nakano T., Suzuki K., Fujimura T., Shinshi H. (2006). Genome-wide analysis of the ERF gene family in Arabidopsis and rice. Plant Physiol. 140: 411–432. [DOI] [PMC free article] [PubMed] [Google Scholar]
- Narusaka M., Shirasu K., Noutoshi Y., Kubo Y., Shiraishi T., Iwabuchi M., Narusaka Y. (2009). RRS1 and RPS4 provide a dual Resistance-gene system against fungal and bacterial pathogens. Plant J. 60: 218–226. [DOI] [PubMed] [Google Scholar]
- Ritter C., Dangl J.L. (1996). Interference between two specific pathogen recognition events mediated by distinct plant disease resistance genes. Plant Cell 8: 251–257. [DOI] [PMC free article] [PubMed] [Google Scholar]
- Roilides E., Simitsopoulou M., Katragkou A., Walsh T.J. (2015). How biofilms evade host defenses. Microbiol. Spectr. 3: 10.1128/microbiolspec.MB-0012-2014. [DOI] [PubMed] [Google Scholar]
- Ruhe J., Agler M.T., Placzek A., Kramer K., Finkemeier I., Kemen E.M. (2016). Obligate biotroph pathogens of the genus Albugo are better adapted to active host defense compared to niche competitors. Front. Plant Sci. 7: 820. [DOI] [PMC free article] [PubMed] [Google Scholar]
- Shannon P., Markiel A., Ozier O., Baliga N.S., Wang J.T., Ramage D., Amin N., Schwikowski B., Ideker T. (2003). Cytoscape: a software environment for integrated models of biomolecular interaction networks. Genome Res. 13: 2498–2504. [DOI] [PMC free article] [PubMed] [Google Scholar]
- Smakowska E., Kong J., Busch W., Belkhadir Y. (2016). Organ-specific regulation of growth-defense tradeoffs by plants. Curr. Opin. Plant Biol. 29: 129–137. [DOI] [PubMed] [Google Scholar]
- Son G.H., Wan J., Kim H.J., Nguyen X.C., Chung W.S., Hong J.C., Stacey G. (2012). Ethylene-responsive element-binding factor 5, ERF5, is involved in chitin-induced innate immunity response. Mol. Plant Microbe Interact. 25: 48–60. [DOI] [PubMed] [Google Scholar]
- Stokes T.L., Kunkel B.N., Richards E.J. (2002). Epigenetic variation in Arabidopsis disease resistance. Genes Dev. 16: 171–182. [DOI] [PMC free article] [PubMed] [Google Scholar]
- Stuttmann J., Hubberten H.M., Rietz S., Kaur J., Muskett P., Guerois R., Bednarek P., Hoefgen R., Parker J.E. (2011). Perturbation of Arabidopsis amino acid metabolism causes incompatibility with the adapted biotrophic pathogen Hyaloperonospora arabidopsidis. Plant Cell 23: 2788–2803. [DOI] [PMC free article] [PubMed] [Google Scholar]
- Tao Y., Yuan F., Leister R.T., Ausubel F.M., Katagiri F. (2000). Mutational analysis of the Arabidopsis nucleotide binding site-leucine-rich repeat resistance gene RPS2. Plant Cell 12: 2541–2554. [DOI] [PMC free article] [PubMed] [Google Scholar]
- Tsuda K., Katagiri F. (2010). Comparing signaling mechanisms engaged in pattern-triggered and effector-triggered immunity. Curr. Opin. Plant Biol. 13: 459–465. [DOI] [PubMed] [Google Scholar]
- Tsuda K., Somssich I.E. (2015). Transcriptional networks in plant immunity. New Phytol. 206: 932–947. [DOI] [PubMed] [Google Scholar]
- Tsuda K., Sato M., Stoddard T., Glazebrook J., Katagiri F. (2009). Network properties of robust immunity in plants. PLoS Genet. 5: e1000772. [DOI] [PMC free article] [PubMed] [Google Scholar]
- Tsuda K., Mine A., Bethke G., Igarashi D., Botanga C.J., Tsuda Y., Glazebrook J., Sato M., Katagiri F. (2013). Dual regulation of gene expression mediated by extended MAPK activation and salicylic acid contributes to robust innate immunity in Arabidopsis thaliana. PLoS Genet. 9: e1004015. [DOI] [PMC free article] [PubMed] [Google Scholar]
- van der Biezen E.A., Freddie C.T., Kahn K., Parker J.E., Jones J.D.G. (2002). Arabidopsis RPP4 is a member of the RPP5 multigene family of TIR-NB-LRR genes and confers downy mildew resistance through multiple signalling components. Plant J. 29: 439–451. [DOI] [PubMed] [Google Scholar]
- von Malek B., van der Graaff E., Schneitz K., Keller B. (2002). The Arabidopsis male-sterile mutant dde2-2 is defective in the ALLENE OXIDE SYNTHASE gene encoding one of the key enzymes of the jasmonic acid biosynthesis pathway. Planta 216: 187–192. [DOI] [PubMed] [Google Scholar]
- Wildermuth M.C., Dewdney J., Wu G., Ausubel F.M. (2001). Isochorismate synthase is required to synthesize salicylic acid for plant defence. Nature 414: 562–565. [DOI] [PubMed] [Google Scholar]
- Wirthmueller L., Zhang Y., Jones J.D.G., Parker J.E. (2007). Nuclear accumulation of the Arabidopsis immune receptor RPS4 is necessary for triggering EDS1-dependent defense. Curr. Biol. 17: 2023–2029. [DOI] [PubMed] [Google Scholar]
- Xu J., Meng J., Meng X., Zhao Y., Liu J., Sun T., Liu Y., Wang Q., Zhang S. (2016). Pathogen-responsive MPK3 and MPK6 reprogram the biosynthesis of indole glucosinolates and their derivatives in Arabidopsis immunity. Plant Cell 28: 1144–1162. [DOI] [PMC free article] [PubMed] [Google Scholar]
- Yamaguchi N., Winter C.M., Wu M.F., Kwon C.S., William D.A., Wagner D. (2014). Protocols: Chromatin immunoprecipitation from Arabidopsis tissues. Arabidopsis Book 12: e0170, doi/10.1199/tab.0170. [DOI] [PMC free article] [PubMed] [Google Scholar]
- Zhao J., Favero D.S., Peng H., Neff M.M. (2013). Arabidopsis thaliana AHL family modulates hypocotyl growth redundantly by interacting with each other via the PPC/DUF296 domain. Proc. Natl. Acad. Sci. USA 110: E4688–E4697. [DOI] [PMC free article] [PubMed] [Google Scholar]


