

Abstract
Background:
Until now, various types of combined therapy with nucleotide analogs and pegylated interferon (Peg-INF) in patients with hepatitis B patients have been tried. However, studies regarding the benefits of de novo combination, late-add on, and sequential treatment are very limited. The objective of the current study was to identify the efficacy of sequential treatment of Peg-INF after short-term antiviral treatment.
Methods:
Between June 2010 and June 2015, hepatitis B e antigen (HBeAg)-positive patients (n = 162) received Peg-IFN for 48 weeks (mono-treatment group, n = 81) and entecavir (ETV) for 12 weeks with a 48-week course of Peg-IFN starting at week 5 of ETV therapy (sequential treatment group, n = 81). The primary endpoint was HBeAg seroconversion at the end of follow-up period after the 24-week treatment. The primary endpoint was analyzed using Chi-square test, Fisher's exact test, and regression analysis.
Results:
HBeAg seroconversion rate (18.2% vs. 18.2%, t = 0.03, P = 1.000) and seroclearance rate (19.7% vs. 19.7%, t = 0.03, P = 1.000) were same in both mono-treatment and sequential treatment groups. The rate of alanine aminotransferase (ALT) normalization (45.5% vs. 54.5%, t = 1.12, P = 0.296) and serum hepatitis B virus (HBV)-DNA <2000 U/L (28.8% vs. 28.8%, t = 0.10, P = 1.000) was not different in sequential and mono-treatment groups at 24 weeks of Peg-INF. Viral response rate (HBeAg seroconversion and serum HBV-DNA <2000 U/L) was not different in the two groups (12.1% vs. 16.7%, t = 1.83, P = 0.457). Baseline HBV-DNA level (7 log10U/ml vs. 7.5 log10U/ml, t = 1.70, P = 0.019) and hepatitis B surface antigen titer (3.6 log10U/ml vs. 4.0 log10U/ml, t = 2.19, P = 0.020) were lower and predictors of responder in mono-treatment and sequential treatment groups, respectively.
Conclusions:
The current study shows no differences in HBeAg seroconversion rate, ALT normalization, and HBV-DNA levels between mono-therapy and sequential therapy regimens.
Trial Registration:
ClinicalTrials.gov, NCT01220596; https://clinicaltrials.gov/ct2/show/NCT01220596?term=NCT01220596&rank=1.
Keywords: Entecavir, Hepatitis B, Peginterferon Alfa-2a
INTRODUCTION
The current recommended standard therapy for chronic hepatitis B comprises of the interferon monotherapy or the oral antiviral drugs.[1,2] The interferon therapy is known to inhibit hepatitis B virus (HBV) protein synthesis and to reduce intrahepatic covalently closed circular DNA (cccDNA), thereby inducing hepatitis B surface antigen (HBsAg) loss.[3,4] On the other hand, although the oral antiviral therapy effectively suppresses viral replication in hepatitis B e antigen (HBeAg)-positive chronic hepatitis B patients, HBeAg/HBsAg loss or seroconversion rates are still low.[5,6] Many researchers had tried to improve the efficacy using various combinations such as de novo combination treatment, sequential, or the late and add-on treatments.[7,8]
Until now, the scarcity of sequential treatment studies and lack of supporting data limit the application of sequential treatment to be recommended clinically. For instance, for the first time, Serfaty et al.[9] performed sequential treatment using lamivudine and interferon in HBV patients. The antiviral response including HBsAg seroconversion was more in sequential treatment group compared to oral antiviral mono-treatment group. The number of studies applying the sequential nucleotide analogs (NUCs) to pegylated interferon (Peg-INF) strategy was limited, and the following two studies did not support previous result.[10] The current randomized controlled study investigated the treatment efficacy and adverse effects of sequential Peg-IFN treatment with short-term use of entecavir (ETV) for 12 weeks.
METHODS
Ethical approval
The study was conducted in accordance with the Declaration of Helsinki and was approved by the Hanyang University Hospital Institutional Review Board/Ethics Committee (IRB No. HYUH 20104003).
All patients signed an informed consent prior to study participation and all centers were monitored by an independent institution.
Study design
The current phase IIIb, randomized, open-label study was conducted in ten centers of South Korea between June 2010 and June 2015. Patients were divided into Peg-IFN monotherapy (Peginterferon Alfa-2α, Pegasys, F. Hoffmann-La Roche Ltd., Basel, Switzerland) 180 μg once weekly for 48 weeks and sequential treatment groups (ETV; Baraclude, Bristol-Myers Squibb, New York, USA) 0.5 mg once daily for 4 weeks followed by a combination of ETV and Pegasys (for 8 weeks), followed by Pegasys alone (for 40 weeks). The randomization was performed using the central computer.
During the treatment period of 48 weeks (+8 weeks), the patients were followed up at 4th, 8th, 12th, 24th, 36th, and 48th week. During each visit, biochemical and hematological assessments were made.
Inclusion and exclusion criteria
Individuals aged 18 years or older with chronic hepatitis B (i.e., HBsAg positive for more than 6 months, positive HBeAg or negative HBeAg, or detectable HBV DNA (>100,000 copies/ml by polymerase chain reaction], or anti-HBs negative) and with serum alanine aminotransferase (ALT) level >2 times the upper normal limit (UNL) but <10 times the UNL were included.
The following individuals were excluded from the study: individuals receiving antiviral treatment for chronic hepatitis B and those with positive results for hepatitis A virus IgM antibody (Ab), hepatitis C virus (HCV)-RNA or HCV-Ab, and hepatitis D virus Ab or human immunodeficiency virus Ab; patients diagnosed with hepatoma or suspected liver malignancy, or individuals with <1500 neutrophils/mm3 or <90,000 thrombocytes/mm3, or individuals with more than 1.5 times the UNL serum creatinine, or with signs of alcohol or drug abuse within <1 year before participating in study, and patients with pregnancy or lactation were excluded from the study. Individuals with a history of the following diseases were also excluded: serious mental disorders, especially depression, immunological infection, decompensated cirrhosis events (Child Pugh B-C), chronic liver failure, autoimmune hepatitis, alcoholic liver disease, chronic respiratory disorders, serious heart diseases, or serious seizure disorder. Moreover, patients contraindicated to Peg-IFN treatment including a history of thyroid disease, or taking anti-seizure drug, or received organ transplantation, were also excluded from the study.
Efficacy analysis
The primary endpoint was HBeAg seroconversion at the end of follow-up period after the 24-week treatment. The secondary endpoints were changes in HBsAg titer, HBeAg-negative chronic infection status (combined HBeAg seroconversion and HBV DNA <2000 U/ml), serum HBV DNA <300 copies/ml, ALT normalization, and HBsAg loss. Primary and secondary efficacy indexes were analyzed at the end of treatment and at the end of follow-up. Responder was defined as HBeAg-negative chronic infection status (HBeAg seroconversion + HBV DNA <2000 U/ml).
Safety analysis
After drug administration, safety analysis was performed on all patients at least once. Measures of safety included adverse events, hematologic measurements, clinical chemical measurements, and vital signs. The association between AEs and drug therapy was determined by researchers at each center. The preferred terms for AEs and categorization were adopted from the Medical Dictionary for Drug Regulatory Affairs.
Dose adjustment guideline
Pegasys dose was de-escalated or temporarily discontinued if neutrophil counts were <750/mm3 or <500/mm3, respectively. The treatment was restored when the neutrophil count increased to >1000/mm3. During treatment restoration, Pegasys dose (90 μg) and neutrophil count were carefully monitored. Moreover, at thrombocyte count <50,000/mm3, Pegasys dose was de-escalated (90 μg), while at <25,000/mm3, the dose was stopped. Whenever necessary, the first de-escalation was performed using 135 μg Pegasys (75%), while the second de-escalation was performed using 90 μg Pegasys (50%).
Statistical analysis
An intention-to-treat (ITT) analysis group included all patients who were randomly allocated and administered with Peg-INF at least twice during the clinical trial. The randomly allocated treatment groups were analyzed, and the primary and secondary variables for effectiveness were analyzed. The primary endpoint was analyzed using the Chi-square test, Fisher's exact test, and regression analysis. Patient characteristics were analyzed using Student's t-test and its nonparametric equivalent (Wilcoxon Rank-Sum test). SPSS for Windows version 16.0 (SPSS Inc., Chicago, IL, USA) was used for statistical analysis.
RESULTS
Study participants
A total of 186 patients were screened. Among the screened patients, 24 patients who were unable to satisfy the study criteria were excluded [Figure 1]. The remaining 162 patients were randomly divided into interferon monotherapy and sequential therapy groups. In both the groups, 15 patients were eliminated due to follow-up loss, side effects, treatment discontinuation, protocol violation, or declined participation.
Figure 1.
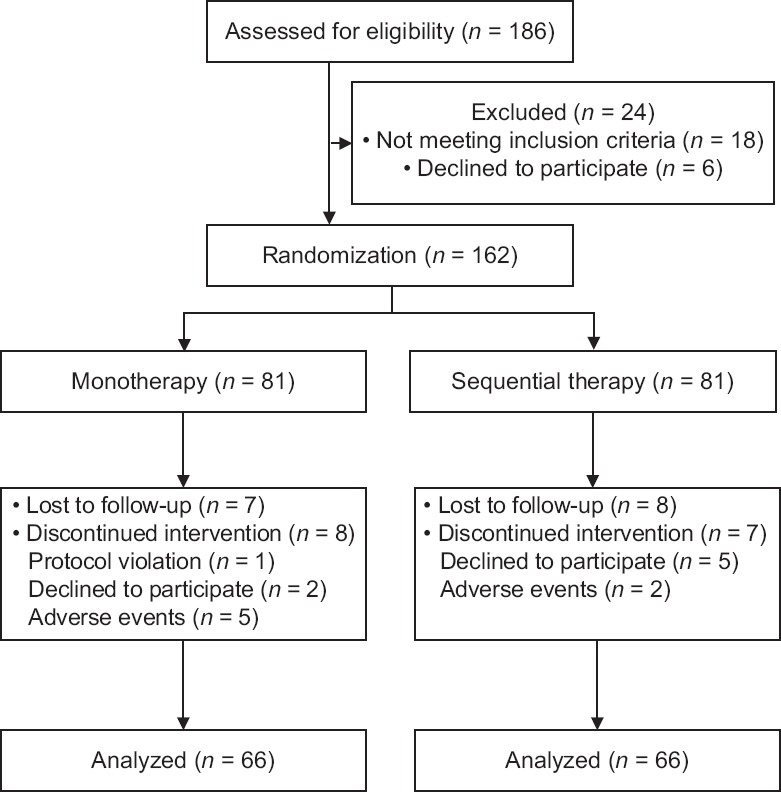
Flow diagram of enrolled patients in the study.
Basic characteristics
There was no difference in average age of patients in both the interferon monotherapy and the sequential therapy groups [Table 1]. One cirrhotic patient was included in the interferon monotherapy group (1.2%), while sequential therapy group had three cirrhotic patients (3.7%). There was no difference in HBV-DNA and HBsAg titers prior to treatment in both groups.
Table 1.
Baseline clinical characteristics of patients in the study
| Characteristics | Monotherapy (n = 81) | Sequential therapy (n = 81) | Statistics | P |
|---|---|---|---|---|
| Age (years) | 32.1 ± 8.2 | 32.5 ± 7.9 | −0.11* | 0.733 |
| Male | 51.0 (63.0) | 52.0 (64.2) | 0.09† | 0.870 |
| WBC (μl) | 5355 ± 1271 | 5717 ± 1591 | −1.63* | 0.112 |
| Hemoglobin (g/L) | 14.3 ± 1.5 | 14.4 ± 2.2 | −0.14* | 0.857 |
| Platelet count (103/μl) | 203 ± 74 | 204 ± 60 | −0.16* | 0.909 |
| Prothrombin time (INR) | 1.04 ± 0.15 | 1.05 ± 0.19 | −0.10* | 0.505 |
| AST (U/L) | 113 (55–140) | 108 (54.5–128.0) | 0.72‡ | 0.709 |
| ALT (U/L) | 194 (111–265) | 170 (108–210) | 1.59‡ | 0.099 |
| Total bilirubin (mg/L) | 9 (6–10) | 9 (5.7–10.0) | −0.24* | 0.813 |
| Albumin (g/L) | 4.2 ± 0.5 | 4.2 ± 0.4 | 0.34* | 0.933 |
| Glucose (mg/L) | 920 ± 160 | 930 ± 160 | 0.02* | 0.290 |
| HBV DNA (log10 U/ml) | 7.37 ± 0.89 | 7.44 ± 1.01 | −1.78* | 0.664 |
| HBsAg (log10 U/ml) | 3.89 ± 0.64 | 4.08 ± 0.64 | −1.23* | 0.067 |
| Cirrhosis (%) | 1 (1.2) | 3 (3.7) | 0.31† | 0.620 |
Data were presented as mean ± SD or medians (interquartile range) or n (%). *t value; †χ2 value; ‡Mann-Whitney U-test. WBC: White blood cell; AST: Aspartate transaminase; ALT: Alanine aminotransferase; HBV: Hepatitis B virus; DNA: Deoxyribonucleic acid; HBsAg: Hepatitis B surface antigen; INR: International normalized ratio; SD: Standard deviation.
Viral response rate by intention-to-treat analysis
An ITT analysis was carried out among 162 randomly allocated patients. There was no difference in HBeAg seroconversion rates between the two groups with 16.0% (13/81) and 14.8% (12/81) (t = 0.03, P = 0.828), respectively. There was also no difference in response rate (HBeAg seroconversion and serum HBV-DNA <2000 U/L) between the interferon monotherapy and sequential therapy groups with 11.1% (9/81) and 13.6% (11/81) (t = 1.60, P = 0.633), respectively.
Viral response rate per protocol analysis
Among the 162 patients, the per protocol analysis was applied on 132 patients who were treated according to the study protocol [Table 2]. After 12-week treatment, the interferon monotherapy group had more nonresponders compared to sequential therapy group. After 24 weeks, there was no difference in HBeAg seroclearance, HBeAb seroconversion, HBV DNA <2000 U/ml, HBV DNA <60 U/ml, responder rate (HBeAg seroconversion and serum HBV-DNA <2000 U/L), and ALT normalization between the two groups. Overall, during the entire treatment duration, there was no significant difference in HBV DNA and HBsAg levels between the two groups [Figure 2]. No HBsAg loss was observed in both the groups after 24-week treatment.
Table 2.
Clinical outcomes between peginterferon therapy and sequential treatment in per protocol analysis
| Variable | Monotherapy (n = 66) | Sequential therapy (n = 66) | χ2 | P |
|---|---|---|---|---|
| Primary nonresponse at 12 weeks | 8 (12.1) | 1 (1.5) | 2.07 | 0.033 |
| Change drug due to elevation of ALT or HBV DNA | 7 (10.6) | 11 (16.7) | 0.21 | 0.310 |
| HBeAg seroclearance | 13 (19.7) | 13 (19.7) | 0.03 | 1.000 |
| HBeAb positivity | 18 (27.3) | 22 (33.3) | 0.16 | 0.449 |
| HBeAg seroconversion | 12 (18.2) | 12 (18.2) | 0.03 | 1.000 |
| HBV DNA <2000 U/ml | 19 (28.8) | 19 (28.8) | 0.10 | 1.000 |
| HBeAg seroconversion + HBV DNA <2000 U/ml | 8 (12.1) | 11 (16.7) | 1.83 | 0.457 |
| HBV DNA <60 U/ml | 3 (4.5) | 5 (7.6) | 0.13 | 0.466 |
| ALT normalization | 30 (45.5) | 36 (54.5) | 1.12 | 0.296 |
Data were presented as n (%). ALT: Alanine aminotransferase; HBV: Hepatitis B virus; DNA: Deoxyribonucleic acid; HBeAg: Hepatitis B e antigen; HBeAb: Hepatitis B e antibody.
Figure 2.
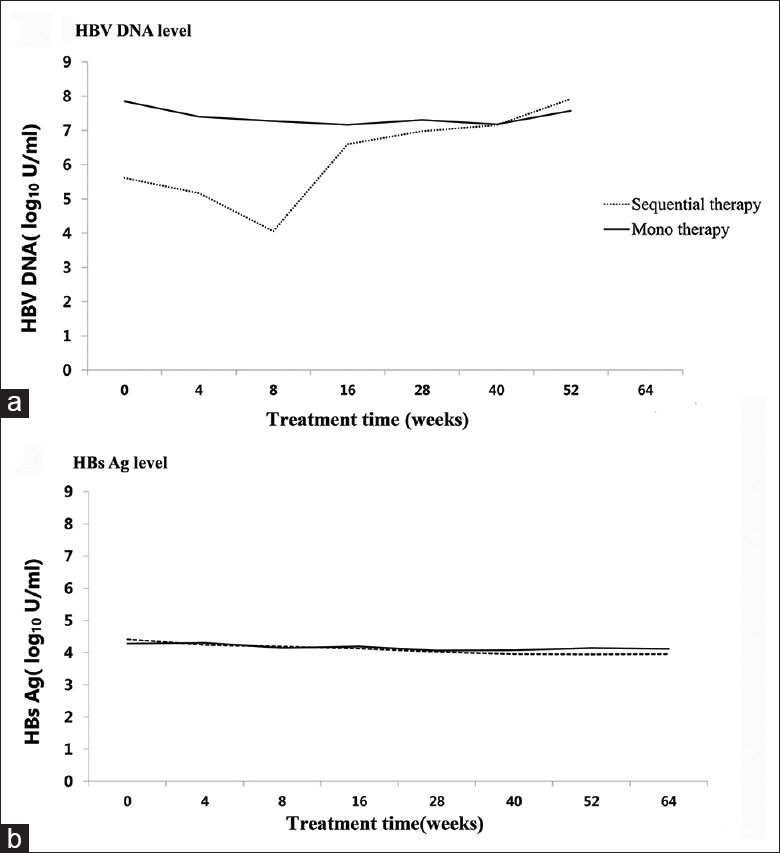
Comparison of HBV DNA level (a) and HBsAg level (b) between sequential therapy and monotherapy groups. HBV: Hepatitis B virus; DNA: Deoxyribonucleic acid; HBsAg: Hepatitis B surface antigen.
Adverse effects
Among the 162 participants, 69 patients experienced drug-related adverse effects, while 44 patients complained about side effects greater than grade II defined by the World Health Organization. However, there was no difference between the two groups. The interferon monotherapy group had more severe adverse reactions compared to sequential therapy group. No drug-related mortality was observed during the study [Table 3]. The dose adjustments were made in five patients in interferon monotherapy group and two patients in sequential therapy group.
Table 3.
Adverse events between peginterferon therapy and sequential treatment in randomized patients
| Variable | Monotherapy (n = 81) | Sequential therapy (n = 81) | χ2 | P |
|---|---|---|---|---|
| Patients with any drug-related adverse events | 36 (44.4) | 33 (40.7) | 1.57 | 0.634 |
| Patients experienced AE ≥ WHO Grade 2 | 23 (28.3) | 21 (25.9) | 1.43 | 0.693 |
| Alopecia | 2 | 8 | ||
| ALT elevation | 1 | 0 | ||
| Chest pain | 0 | 1 | ||
| Cough | 0 | 1 | ||
| Diverticulitis | 0 | 1 | ||
| Dyspnea | 0 | 1 | ||
| Enteritis | 1 | 0 | ||
| Fatigue | 0 | 1 | ||
| Fever | 2 | 0 | ||
| General weakness | 1 | 0 | ||
| Headache | 1 | 1 | ||
| Hepatitis | 2 | 1 | ||
| Hypothyroidism | 2 | 1 | ||
| Influenza-like symptom | 1 | 0 | ||
| Myalgia | 1 | 0 | ||
| Neutropenia | 3 | 2 | ||
| Pruritis | 1 | 1 | ||
| Skin lesion | 1 | 0 | ||
| Skin rash | 1 | 0 | ||
| Thrombocytopenia | 1 | 0 | ||
| Tonsillitis | 1 | 1 | ||
| Upper respiratory infection | 1 | 1 | ||
| Patients with any serious adverse event | 7 (8.6) | 1 (1.2) | 0.52 | 0.064 |
| ALT elevation | 1 | 0 | ||
| Pruritis | 1 | 0 | ||
| Gallstone, cholelithotomy | 2 | 0 | ||
| Hepatitis exacerbation | 2 | 0 | ||
| Operation for removing left leg pins | 0 | 1 | ||
| Pneumonia | 1 | 0 | ||
| Patients with any drug-related SAE | 2 (2.5) | 0 (0.0) | 0.497 | |
| ALT elevation | 1 | 0 | ||
| Dermatitis | 1 | 0 | ||
| Patients with any AE with an outcome of death | 0 (0.0) | 0 (0.0) |
Data were presented as n (%). AE: Adverse event; WHO: World Health Organization; ALT: Alanine aminotransferase; SAE: Serious adverse event.
Predicting factors for viral response
Among the 132 study participants, HBeAg seroconversion and HBV DNA concentration in serum of 19 patients remained below 2000 U/ml. Predicting factors for viral response (HBeAg seroconversion and HBV DNA <2000 U/ml) in interferon-based treatment were analyzed [Table 4]. Multivariate analysis showed that the baseline HBsAg titer was the only independent predictor of (<4 log10 U/ml) HBeAg seroconversion and HBV DNA <2000 U/ml in interferon-based treatment. The predicting factors determining responders and nonresponders were compared within the groups [Table 5]. Among the patients receiving Peg-IFN monotherapy, the low baseline HBV DNA levels were observed in both responders and nonresponders. In the sequential therapy group, the low baseline HBsAg titer, HBV DNA reduction after 12-week treatment, serves as a predictor of HBeAg seroconversion and HBV DNA <2000 U/ml.
Table 4.
Predictors of response in interferon-based treatment
| Variable | Response | Model 1 | Model 2 | |||||
|---|---|---|---|---|---|---|---|---|
| Responder (n = 19) | Nonresponder (n = 113) | Statistics | P | OR (95% CI)‡ | P | OR (95% CI)‡ | P | |
| Age (years) | 32.2 ± 9.8 | 32.9 ± 7.8 | 0.79* | 0.701 | ||||
| Age >30 | 67 (59.3) | 10 (52.6) | 0.586 | |||||
| Female (%) | 6 (31.6) | 40 (35.4) | 0.62† | 0.746 | ||||
| Platelet count (103/μl) | 196 ± 54 | 202 ± 71 | 0.07* | 0.723 | ||||
| Total bilirubin (mg/L) | 9 ± 3 | 9 ± 9 | 0.07* | 0.807 | ||||
| ALT (U/ml) | 147 ± 58 | 182 ± 94 | 0.94* | 0.034 | 0.99 (0.99–1.00) | 0.078 | 0.99 (0.99–1.00) | 0.151 |
| Albumin (g/L) | 4.1 ± 0.4 | 4.2 ± 0.5 | 0.46* | 0.795 | ||||
| Prothrombin time (INR) | 1.01 ± 0.25 | 1.04 ± 0.14 | 0.10* | 0.504 | ||||
| AFP | 19.9 ± 39.8 | 14.1 ± 30.1 | 0.80* | 0.463 | ||||
| HBV DNA (log10 U/ml) | 7.0 ± 0.8 | 7.5 ± 0.9 | 1.70* | 0.019 | ||||
| HBV DNA <7 log10 U/ml | 10 (52.6) | 27 (24.1) | 0.011 | 4.00 (1.42–11.25) | 0.009 | 2.38 (0.66–8.54) | 0.185 | |
| HBsAg (log10 U/ml) | 3.6 ± 0.6 | 4.0 ± 0.7 | 2.19* | 0.020 | ||||
| HBsAg <4 log10 U/ml | 11 (78.6) | 41 (39.0) | 0.008 | 5.02 (1.18–21.3) | 0.029 | |||
| Cirrhosis | 2 (10.5) | 2 (1.8) | 0.25† | 0.099 | ||||
| Sequential therapy | 11 (57.9) | 55 (48.7) | −0.27† | 0.457 | ||||
Data were presented as mean ± SD or n (%). *t value; †χ2 value; ‡Age- and sex-adjusted OR. Model 1: Age, sex, serum ALT, HBV DNA <7 log10 U/ml; Model 2: Age, sex, serum ALT, HBV DNA <7 log10 U/ml, HBsAg titer <4 log10 U/ml. ALT: Alanine aminotransferase; AFP: Alpha fetoprotein; HBV: Hepatitis B virus; DNA: Deoxyribonucleic acid; HBsAg: Hepatitis B surface antigen; INR: International normalized ratio; CI: Confidence interval; SD: Standard deviation; OR: Odds ratio.
Table 5.
Predictors of response using baseline parameters and on-treatment parameters
| Variable | Monotherapy (n = 66) | Sequential therapy (n = 66) | ||||||
|---|---|---|---|---|---|---|---|---|
| Responder (n = 8) | Nonresponder (n = 58) | t | P | Responder (n = 11) | Nonresponder (n = 55) | t | P | |
| Baseline | ||||||||
| HBV DNA (log10 U/ml) | 6.71 ± 0.76 | 7.44 ± 0.90 | 2.07 | 0.032 | 7.13 ± 0.86 | 7.53 ± 0.95 | 1.15 | 0.192 |
| HBsAg (log10 U/ml) | 3.62 ± 0.37 | 3.94 ± 0.67 | 1.35 | 0.211 | 3.60 ± 0.84 | 4.13 ± 0.65 | 1.79 | 0.041 |
| Peg-interferon after 12 weeks | ||||||||
| HBV DNA (log10 U/ml) | 4.67 ± 1.20 | 5.53 ± 1.94 | 1.42 | 0.230 | 1.64 ± 0.63 | 3.00 ± 1.20 | 1.23 | <0.001 |
| HBsAg (log10 U/ml) | 3.67 ± 0.35 | 3.69 ± 0.70 | 0.83 | 0.943 | 3.52 ± 0.70 | 3.76 ± 0.59 | 0.90 | 0.333 |
| Changes of viral load (Peg-interferon after 12 weeks – baseline) | ||||||||
| Δ HBV DNA (log10 U/ml) | 2.04 ± 1.29 | 1.92 ± 1.83 | 1.20 | 0.853 | 5.48 ± 0.66 | 4.55 ± 1.21 | 1.20 | 0.001 |
| ΔHBsAg (log10 U/ml) | −0.08 ± 0.15 | 0.22 ± 0.67 | 0.90 | 0.290 | −0.15 ± 0.49 | 0.33 ± 0.60 | 1.33 | 0.087 |
Data were presented as mean ± SD. In the monotherapy group, lower baseline HBV DNA level is associated with response of HBeAg seroconversion and HBV DNA <2000 U/ml. In the sequential therapy group, lower baseline HBsAg titer and HBV DNA decreasing volume at the 3rd month of treatment serve as predictors of HBeAg seroconversion and HBV DNA <2000 U/ml. HBV: Hepatitis B virus; DNA: Deoxyribonucleic acid; HBsAg: Hepatitis B surface antigen; SD: Standard deviation; HbeAg: Hepatitis B e antigen.
DISCUSSION
The current study found that there was no difference in efficacy and adverse effects between the sequential Peg-IFN treatment group and Peg-IFN mono-treatment group. A number of published studies compared the effectiveness of combined Peg-IFN and NUC in treating hepatitis B. The first pivotal study showed no difference in HBsAg loss among the Peg-IFN + lamivudine de novo combination therapy group and lamivudine and Peg-IFN monotherapy groups.[11] ARES study evaluated the efficacy of late “add-on” strategy. Add-on Peg-INF to ETV for 24 weeks showed better viral kinetics. However, there was no difference in HBeAg loss which was the primary endpoint.[12] NUC analogs of short-term pretreatment and late switch to Peg-INF regimens were adopted to evaluate the treatment effects on hepatitis B. However, to date, there are a limited number of studies utilizing the sequential NUC to Peg-INF strategy. For instance, there is only one published study regarding sequential NUC to Peg-INF strategy, which reported results similar to short-term ETV treatment.[10] In this study, 12-week ETV pretreatment could not increase Peg-IFN's HBeAg seroconversion rate (18.2%). Such difference is believed to be attributable to the fact that the current study is an investigator-initiated trial carried out in a real-life setting; dropout rate is high and genotype C is the predominant HBV genotype in Korea.[13]
The level and changes of HBV DNA at 12th week treatment were statistically significant (P < 0.001 and P = 0.001, respectively). In the OSST trial, ETV treatment led to HBe antigen loss; when HBsAg level was <1500 U/ml, treatment switching to Peg-IFN produced a great therapeutic effect with 22.2% HBsAg loss and 33.3% of HBeAg seroconversion.[14] Marcellin et al.[15] reported that 48-week combination therapy (Peg-IFN and tenofovir) had better results in HBsAg seroclearance (6.5%) than the 16-week combination therapy with Peg-IFN and tenofovir or the tenofovir monotherapy. Therefore, it is desirable to treat with interferon after full NUC treatment or add Peg-IFN and NUC for a longer period of time in order to enhance therapeutic action. It is also better to apply combination therapy more aggressively in patients with low baseline HBsAg level or high DNA-decreasing reduction at the 12th week of treatment. There was no significant difference in the safety profile of the current study and other previous monotherapy studies or Peg-IFN and ETV combination therapies. The limitations of the current study are as follows: first, the 6-month follow-up period was relatively short. Different results might have been produced if the follow-up period was prolonged. Second, HBV genotype test was not performed in the study groups. Previous studies suggest that HBsAg kinetics and HBeAg seroconversion rate are likely to vary according to genotypes. However, it would be impossible to find the difference by genotypes even though DNA genotype testing was carried out. The distribution of genotype C is nearly 100% in South Korea.[16]
Consequently, the current study found that pretreatment with ETV did not enhance the therapeutic benefit of Peg-IFN compared to monotherapy. There was no difference in HBeAg seroconversion rate, ALT normalization, and HBV-DNA levels between monotherapy and sequential therapy groups. Otherwise, baseline HBsAg titer (<4 log10 U/ml) was a predictor of responder in Peg-INF base treatment strategy.
Financial support and sponsorship
This study was supported by a grant from Roche.
Conflicts of interest
There are no conflicts of interest.
Footnotes
Edited by: Peng Lyu
REFERENCES
- 1.European Association for the Study of the Liver. EASL 2017 clinical practice guidelines on the management of hepatitis B virus infection. J Hepatol. 2017;67:370–98. doi: 10.1016/j.jhep.2017.03.021. doi: 10.1016/j.jhep.2017.03.021. [DOI] [PubMed] [Google Scholar]
- 2.Korean Association for the Study of the Liver. KASL clinical practice guidelines: Management of chronic hepatitis B. Clin Mol Hepatol. 2016;22:18–75. doi: 10.3350/cmh.2016.22.1.18. doi: 10.3350/cmh.2016.22.1.18. [DOI] [PMC free article] [PubMed] [Google Scholar]
- 3.Tjwa ET, van Oord GW, Hegmans JP, Janssen HL, Woltman AM. Viral load reduction improves activation and function of natural killer cells in patients with chronic hepatitis B. J Hepatol. 2011;54:209–18. doi: 10.1016/j.jhep.2010.07.009. doi: 10.1016/j.jhep.2010.07.009. [DOI] [PubMed] [Google Scholar]
- 4.Sonneveld MJ, Zoutendijk R, Hansen BE, Janssen HL. Pegylated interferon results in higher serological, but not virological, response rates when compared to continuous entecavir. Antivir Ther. 2012;17:1605–8. doi: 10.3851/IMP2319. doi: 10.3851/IMP2319. [DOI] [PubMed] [Google Scholar]
- 5.Reijnders JG, Perquin MJ, Zhang N, Hansen BE, Janssen HL. Nucleos(t)ide analogues only induce temporary hepatitis B e antigen seroconversion in most patients with chronic hepatitis B. Gastroenterology. 2010;139:491–8. doi: 10.1053/j.gastro.2010.03.059. doi: 10.1053/j.gastro.2010.03.059. [DOI] [PubMed] [Google Scholar]
- 6.Heathcote EJ, Marcellin P, Buti M, Gane E, De Man RA, Krastev Z, et al. Three-year efficacy and safety of tenofovir disoproxil fumarate treatment for chronic hepatitis B. Gastroenterology. 2011;140:132–43. doi: 10.1053/j.gastro.2010.10.011. doi: 10.1053/j.gastro.2010.10.011. [DOI] [PubMed] [Google Scholar]
- 7.Piratvisuth T, Lau G, Chao YC, Jin R, Chutaputti A, Zhang QB, et al. Sustained response to peginterferon alfa-2a (40kD) with or without lamivudine in Asian patients with HBeAg-positive and HBeAg-negative chronic hepatitis B. Hepatol Int. 2008;2:102–10. doi: 10.1007/s12072-007-9022-5. doi: 10.1007/s12072-007-9022-5. [DOI] [PMC free article] [PubMed] [Google Scholar]
- 8.Chan HL, Leung NW, Hui AY, Wong VW, Liew CT, Chim AM, et al. Arandomized, controlled trial of combination therapy for chronic hepatitis B: Comparing pegylated interferon-alpha2b and lamivudine with lamivudine alone. Ann Intern Med. 2005;142:240–50. doi: 10.7326/0003-4819-142-4-200502150-00006. doi: 10.7326/0003-4819-142-4-200502150-00006. [DOI] [PubMed] [Google Scholar]
- 9.Serfaty L, Thabut D, Zoulim F, Andreani T, Chazouillères O, Carbonell N, et al. Sequential treatment with lamivudine and interferon monotherapies in patients with chronic hepatitis B not responding to interferon alone: Results of a pilot study. Hepatology. 2001;34:573–7. doi: 10.1053/jhep.2001.26819. doi: 10.1053/jhep.2001.26819. [DOI] [PubMed] [Google Scholar]
- 10.Xie Q, Zhou H, Bai X, Wu S, Chen JJ, Sheng J, et al. A randomized, open-label clinical study of combined pegylated interferon alfa-2a (40KD) and entecavir treatment for hepatitis B “e” antigen-positive chronic hepatitis B. Clin Infect Dis. 2014;59:1714–23. doi: 10.1093/cid/ciu702. doi: 10.1093/cid/ciu702. [DOI] [PubMed] [Google Scholar]
- 11.Lau GK, Piratvisuth T, Luo KX, Marcellin P, Thongsawat S, Cooksley G, et al. Peginterferon Alfa-2a, lamivudine, and the combination for HBeAg-positive chronic hepatitis B. N Engl J Med. 2005;352:2682–95. doi: 10.1056/NEJMoa043470. doi: 10.1056/NEJMoa043470. [DOI] [PubMed] [Google Scholar]
- 12.Brouwer WP, Xie Q, Sonneveld MJ, Zhang N, Zhang Q, Tabak F, et al. Adding pegylated interferon to entecavir for hepatitis B e antigen-positive chronic hepatitis B: A multicenter randomized trial (ARES study) Hepatology. 2015;61:1512–22. doi: 10.1002/hep.27586. doi: 10.1002/hep.27586. [DOI] [PubMed] [Google Scholar]
- 13.Bae SH, Yoon SK, Jang JW, Kim CW, Nam SW, Choi JY, et al. Hepatitis B virus genotype C prevails among chronic carriers of the virus in Korea. J Korean Med Sci. 2005;20:816–20. doi: 10.3346/jkms.2005.20.5.816. doi: 10.3346/jkms.2005.20.5.816. [DOI] [PMC free article] [PubMed] [Google Scholar]
- 14.Ning Q, Han M, Sun Y, Jiang J, Tan D, Hou J, et al. Switching from entecavir to pegIFN alfa-2a in patients with HBeAg-positive chronic hepatitis B: A randomised open-label trial (OSST trial) J Hepatol. 2014;61:777–84. doi: 10.1016/j.jhep.2014.05.044. doi: 10.1016/j.jhep.2014.05.044. [DOI] [PubMed] [Google Scholar]
- 15.Marcellin P, Ahn SH, Chuang WL, Hui AJ, Tabak F, Mehta R, et al. Predictors of response to tenofovir disoproxil fumarate plus peginterferon alfa-2a combination therapy for chronic hepatitis B. Aliment Pharmacol Ther. 2016;44:957–66. doi: 10.1111/apt.13779. doi: 10.1111/apt.13779. [DOI] [PubMed] [Google Scholar]
- 16.Cho JH, Yoon KH, Lee KE, Park DS, Lee YJ, Moon HB, et al. Distribution of hepatitis B virus genotypes in Korea. Korean J Hepatol. 2009;15:140–7. doi: 10.3350/kjhep.2009.15.2.140. doi: 10.3350/kjhep.2009.15.2.140. [DOI] [PubMed] [Google Scholar]