

Abstract
Purpose
Deep Brain Stimulation of the subthalamic nucleus (STN-DBS) effectively treats cardinal symptoms of idiopathic Parkinson’s disease (PD) that cannot be satisfactorily managed with medication. Research is equivocal regarding speech changes associated with STN-DBS. This study investigated the impact of STN-DBS on vocalic transitions and the relationship to intelligibility.
Methods
Eight Quebec-French speakers with PD and eight healthy controls participated. The slope of the second formant frequency (F2 slope) for glides was obtained. Locus equations (LEs) were calculated to capture vocalic transitions in consonant-vowel sequences. A visual analog scale was used to obtain judgments of intelligibility. Measures for the PD group were obtained both On and Off stimulation.
Results
F2 slopes and LEs differed among groups, but there were no systematic differences for On versus Off STN-DBS. On an individual level, participants with PD exhibited heterogeneous changes with DBS stimulation. Intelligibility was significantly correlated with F2 slope.
Conclusion
F2 slope appears to be sensitive to articulatory impairment in PD and could be used in clinical settings to distinguish these speakers from healthy controls. However, acoustic metrics failed to identify systematic change with STN-DBS. The heterogeneity of results, as well as the clinical relevance of acoustic metrics are discussed.
Keywords: Dysarthria, Parkinson’s disease, Deep brain stimulation, Speech acoustics, Speech intelligibility, F2 slope
1. Introduction
Deep brain stimulation of the subthalamic nucleus (STN-DBS) is a surgical intervention that has been proven effective in treating the cardinal symptoms of PD (i.e. tremor, rigidity and bradykinesia). Studies have shown a marked improvement in quality of life for the vast majority of patients that undergo this surgical intervention (Volkmann, 2004). Over the past decade, research has begun investigating the impact of STN-DBS on non-cardinal symptoms of PD. This interest from the scientific community, sparked from clinical observations, demonstrated that these other facets of PD could be modified by STN-DBS. For example, STN-DBS may reduce sleeping disorders (Chahine, Ahmed, & Sun, 2011), pain (Kim et al., 2008) or olfaction impairment (Guo et al., 2008) for individuals with PD. Various explanations have been offered to account for the association between STN-DBS and the non-cardinal symptoms of PD. For example, it has been suggested that strong connectivity between neural sub-systems responsible for motor and non-motor functions explains the association between STN-DBS and the non-cardinal symptoms of PD. Another explanation is that electrical stimulation, particularly at higher voltages, spreads to neighboring regions around the STN (Tommasi et al., 2008).
Dysarthria is common in PD. More than 90% of people with PD develop dysarthria over the course of the disease (Sapir, Ramig, & Fox, 2013). Widely studied, hypokinetic dysarthria is characterised by altered prosody (i.e., reduced loudness and pitch variation, rate control anomalies), phonation (i.e., breathy and/or harsh voice) and articulation (i.e., imprecise consonants, centralized vowels) (Duffy, 2012). The neurology community is divided as to whether dysarthria should be considered a motor or non-motor symptoms of PD. For some movement disorders specialists, dysarthria is considered a non-motor symptom of PD (Seppi et al., 2011). This view is contested by those who consider speech production to be a fine motor skill that shares all of the characteristics of other fine motor skills, such as improvement with practice, automatization and being goal oriented in nature (Netsell, 1982).
While still relatively rare, research conducted over the past decade has begun to investigate speech outcomes following STN-DBS. These studies include those investigating the short and/or long-term effects of the intervention (i.e., “Pre-Post studies”) as well as studies investigating the direct effect of the electrical stimulation (i.e., “On-Off studies). Collectively, Pre-Post as well as On-Off studies report high inter-subject variability. The high inter-subject variability, in turn, contributes to equivocal outcomes across studies (Aldridge, Theodoros, Angwin, & Vogel, 2016; Schulz & Grant, 2000; Skodda, 2012) (Skodda, 2012). In addition, most Pre-Post studies indicate that speech is not improved by the intervention, and recent research suggests intelligibility is reduced, on average, in the years following surgery (Tripoliti et al., 2014). On the other hand, for some patients, the post-surgical reduction in required daily dosage of L-dopa is associated with improvement in some aspects of articulation (Martel-Sauvageau, Roy, Cantin et al., 2015).
Multiple hypotheses have been suggested to explain the lack of consistency regarding the outcomes of studies investigating the impact of STN-DBS on speech production in PD. One of these hypotheses concerns electrode placement during surgery or post-surgery electrode migration. The exact location of the implanted electrodes within the STN varies from participant to participant because this information requires an imaging procedure that is not routinely employed in clinical practice. However, in a rare study reporting detailed information regarding electrode placement, Tripoliti et al. (2011) reported that electrodes located more medially in the left STN were associated with higher risk of speech impairment.
Another explanation for the mixed results in studies investigating the impact of STN-DBS on speech production could be related to the choice of speech measures. While many studies have used perceptual measures to characterize the effects of STN-DBS on speech production (Aldridge et al., 2016; Skodda, 2012), acoustic measures of phonation, prosody and articulation have also been employed (Choi, 2012; D’Alatri et al., 2008; Hoffman-Ruddy, Schulz, Vitek, & Evatt, 2001). In a recent essay, Weismer and colleagues questioned the choice of measures used in many extant studies investigating the impact of STN-DBS on speech production (Weismer, Yunusova, & Bunton, 2012). It was further suggested that the ideal measure(s) for evaluating the effects of DBS on speech production should 1) have known sensitivity to dysarthria; 2) have relevance to functional communication or intelligibility; 3) be interpretable with respect to speech movement, and 4) be straightforward to obtain and interpret. The slope of the second formant (F2) frequency, an acoustic measure reflecting rate of vocal tract shape change was endorsed as a candidate measure for evaluating the effects of DBS on speech production. Bearing in mind the evaluative criteria suggested by Weismer et al. (2012), F2 slope is reduced for speakers with a variety of dysarthrias and neurological diagnoses relative to age and sex matched healthy controls (e.g. Kim, Kent & Weismer, 2011; Kim, Weismer, Kent & Duffy, 2009; Yunusova et al., 2012). F2 slope also is correlated with intelligibility as well as lingual movement speed, such that shallower slopes are associated with poorer intelligibility and slower speeds (e.g., Yunusova et al., 2012; Weismer et al., 2012). Acoustic measures like F2 slope also meet the criteria for ease and simplicity of application. However, despite a recent review concluding that STN-DBS prominently impacts articulation (Aldridge et al., 2016), F2 slope has thus far been reported in a single study STN-DBS study employing an On-Off paradigm (Dromey & Bjarnason, 2011).
Formant transition characteristics (i.e., F2 slope) of diphthongs, obstruent-vowel sequences, and semivowels have been studied a fair amount in dysarthria, albeit not in the context of STN-DBS (see review in Weismer et al., 2012). Collectively, these studies suggest that phonetic events requiring relatively rapid and large-scale changes in vocal tract shape are particularly sensitive to dysarthria. Locus equations (LE) are an alternative acoustic metric for characterizing segmental transition characteristics. By observing the transition of the second formant (F2) of different vowels in consonant-vowel (C-V) syllables, where the consonants consist of voiced plosives, it has been broadly demonstrated that for a single place of articulation, the relationship between F2 at the onset (F2onset) and F2 at the midpoint (F2mid) of all vowels follows a linear pattern (Lindblom & Sussman, 2012). In other words, for a given voiced plosive followed by a set of different vowels (e.g./ba/,/bi/,/be/, etc.), the F2 value at midpoint for each vowel can be linearly predicted by its F2 value at onset. One of the strengths of using LE measures to investigate vocalic transitions in C-V sequences is that the measure takes into account both anticipatory and carry-over coarticulation effects (Lindblom & Sussman, 2012). In fact, the F2 transition patterns of the vowel depend directly on the place of articulation of the preceding consonant. A variety of studies suggest that LEs are sensitive to pathological speech, including studies of childhood and acquired apraxia of speech (Sussman, Marquardt, & Doyle, 2000; Whiteside, Grobler, Windsor, & Varley, 2010), stuttering (Sussman, Byrd, & Guitar, 2011), hearing impairment (McCaffrey Morrison, 2008) and dysarthria (Kim & Hasegawa-Johnson, 2012; Martel-Sauvageau, Roy, Langlois, & Macoir, 2015). LEs have not been used to study the effects of STN-DBS. However, LEs meet many of the evaluative criteria suggested by Weismer et al. (2012) and capture transitional characteristics of phonetic events in a manner different from F2 slope.
Given questions regarding the relevance of metrics used in previous studies investigating the impact of STN-DBS on speech production in PD, and the suggestion that acoustic transitions could provide an adequate means to evaluate the effects of the intervention, the present study was undertaken. Using an On-Off paradigm, the current study had three main objectives: 1) to document the impact of STN-DBS in PD on two different metrics of vocalic transitions (F2 slopes in glides and Locus Equations in C-V sequences), 2) to document the link between these metrics and speech intelligibility, and 3) to compare these two metrics in terms of capacity to adequately evaluate the effects of STN-DBS on speech production.
Two previous studies have been published on the effects of STN-DBS on speech production in PD in a Quebec-French setting, with the speakers with PD in the current study being the same participants as those one of these. While these previously published studies also investigated vowel acoustics Pre- vs Post- DBS (Martel-Sauvageau, Roy, Cantin et al., 2015) and On- vs Off-DBS (Martel-Sauvageau et al., 2014) the present study expands on their findings and improves multiple methodological aspects. First, only static vowel measurements were obtained in previous studies, while the present project investigates dynamic changes in vowel in terms of transitions. Second, no perceptual measurements were completed in the previous studies while the present study investigates the association between acoustic change and intelligibility. Lastly, the present study compares PD participants with healthy speakers (see Section 2.1), while previous studies did not include healthy controls.
2. Methods
2.1. Participants
Two groups of participants (PD and Control) were included in this study. All participants were native speakers of Quebec French and had resided their entire life in Quebec. For the PD group, eight participants (5 women and 3 men) aged 53–72 years were recruited from an outpatient movement disorders clinic. While modest, subject numbers are consistent with published studies on STN-DBS from others laboratories (Dromey & Bjarnason, 2011; Sidtis, Alken, Tagliati, Alterman, & Van Lancker Sidtis, 2016). This topic is considered further in the discussion. All participants were diagnosed with idiopathic PD with an estimated onset of 9 to 25 years prior to the study. All participants were taking antiparkinsonian medications, with L-dopa equivalent dose ranging from 300 to 1500 mg per day. No changes were made to their medication during the study. All PD participants had undergone bilateral DBS of the STN surgery 2 to 5 years prior to the study. The DBS surgery was performed by the same neurosurgeon and all participants were regularly followed by the same neurologist. At the time of the study, the electrical parameters of the DBS had been stable for a period of at least 2 months. The configuration of the electrical parameters for each participant was selected and adjusted by their neurologist, based on observed and reported clinical symptoms of PD such as tremor, rigidity, speech difficulty and dyskinesia. The specific individual DBS parameters for these participants, as well as the severity of their motor symptoms (UPDRS-III scores) (Goetz et al., 2008) can be found in a previously published study (Martel-Sauvageau et al., 2014).
For the study, participants with PD completed the French version of the Voice Handicap Index (VHI) (Woisard, Bodin, & Puech, 2004). This instrument measures the impact of dysphonia on an individual in functional, emotional, and physical domains and has been applied to a variety of dysarthrias, including dysarthria secondary to PD (Frost, Tripoliti, Hariz, Pring, & Limousin, 2010). Higher values indicate greater voice handicap. Although the presence of a speech disorder or dysarthria was not a criterion to be eligible for this study, all participants reported speech difficulties. Table 1 summarizes participant characteristics for the PD group.
Table 1.
Demographic data of all participants.
| Participant pair | Sex | Age (CTa) | Age (PDb) | Years post-Dx | VHI scorec |
|---|---|---|---|---|---|
| 01 | M | 64 | 66 | 25 | 83 |
| 02 | F | 66 | 66 | 16 | 34 |
| 03 | M | 71 | 71 | 11 | 49 |
| 04 | F | 74 | 72 | 19 | 56 |
| 05 | F | 55 | 53 | 12 | 34 |
| 06 | F | 64 | 65 | 14 | 51 |
| 07 | F | 71 | 72 | 19 | 48 |
| 08 | M | 67 | 69 | 9 | 42 |
Notes.
CT = Control group.
PD = Parkinson’s Disease group.
VHI = Voice Handicap Index for the PD participants.
A group of eight healthy control participants was recruited for comparison to the PD group. Each of these control subjects were matched on an individual level with a PD participant (same sex and ± 2 years). Although no formal hearing evaluation was conducted, all participants had auditory acuity adequate for the purposes of the study, as judged by the first author, and no one reported a hearing impairment or used a hearing aid. Demographic data for participants is reported in Table 1.
2.2. Speech procedures
2.2.1. Recording sessions and equipment
For the PD group, two evaluation sessions for each participant took place on different days. Half of these participants were first recorded in the ON-stimulation state, then on a different following day in the OFF-stimulation state. For the other participants, OFF-stimulation recordings took place first and ON-stimulation recordings were made afterward. This design was chosen to counterbalance the possible habituation effects of the task between the two stimulation conditions. ON-stimulation recordings were made at home with no change to the stimulation settings used in the participant’s everyday life. OFF-stimulation recordings were made at the hospital under medical surveillance and took place one hour after the stimulator was turned OFF. All sessions took place in a quiet room at the same time of day for each participant to minimize variations in medication cycle. All participants took their anti-parkinsonian medication at least one hour prior to the sessions and were therefore considered to be in the On-state medication during the recordings. The recordings for the control group took place in a single evaluation session for each participant. These sessions also took place in a quiet room in each participant’s home.
All recordings were made using a Shure 510A head-mounted microphone and a Zoom H4n autonomous audio recorder at a sampling rate of 44.1 kHz. Mouth-to-microphone distance was approximately 5 cm for each participant and remained constant throughout the recording session.
2.2.2. Speech samples
Two speech tasks were performed by all participants to allow for measurement of the two primary acoustic variables in this study, including F2 slopes for glides and locus equations. As discussed in a following section, articulation rate also was obtained, as a means of accounting for the effects of rate or duration on F2 slope. The first task, aimed at measuring articulation rate and F2 slopes for glides, was a text reading of ‘La bise et le soleil’ (International Phonetic Association, 1949). This is a standardized French text commonly used in French phonetic experiments to study normal or disordered speech (Martel-Sauvageau, Roy, Langlois et al., 2015). This short text (6 sentences, 122 words, 176 syllables) is considered a French equivalent of the English text The Rainbow Passage (Fairbanks, 1960). The participants were first asked to read the text silently before being recorded only once. This procedure was intended to broadly familiarize participants with the content of the text prior to recording.
Speakers also produced CVCV tokens in a carrier phrase for use in calculating locus equations, with the target vowels/i//u/and/ a/and the consonants/b/,/d/and/g/. These voiced plosives were selected because locus equations are mainly used to measure coarticulation in these contexts (Lindblom & Sussman, 2012; Modarresi, Sussman, Lindblom, & Burlingame, 2005; Sussman et al., 2000). The use of these C-V sequences allowed LE to be derived for each place of articulation of the consonant. These tokens were embedded in the carrier phrase “Je pense CVCV cette fois” (“I think CVCV this time”) in order to standardize the prosody and accentuation of productions. Each individual token was repeated 8 times, for a total of 72 productions for each participant per recording session. The order of presentation for these tokens was randomized, but this sequence remained the same between all participants and throughout all recording sessions.
2.3. Acoustic analyses
Acoustic analyses were performed using Praat software v5.4.04 (Boersma & Weenink, 2013) running on Windows OS. Acoustic measures are described in detail in the following sections.
2.3.1. Articulation rate
Since vocalic transitions are dynamic measures potentially influenced by duration, measures of articulation rate were obtained. Articulation rate, in syllables per second, was measured in the text reading task for each speaker. Articulation rate was calculated by dividing total speech time, excluding interword pauses greater than 200 ms, by the number of syllables produced. Using the combined waveform and wide-band (300–400 Hz) spectrographic display, standard acoustic criteria were used to identify utterance onsets and offsets.
2.3.2. Glide slopes
Glide F2 slopes were also measured in the text reading task. Three different glide contexts were analyzed:/wa/,/ja/and/εj/. Each glide occurred between three and four times throughout the text. The first and the third glides are characterised by a positive F2 slope, while the second is characterised by a negative F2 slope. Glides onset and offset were first identified and labeled from the wideband spectrogram and waveform displays of Praat. F2 tracks of fixed 5 ms consecutive timeframes were generated for each production and computer-generated tracking errors were manually corrected. Instantaneous slope was computed for each point as a change in frequency (Hz) divided by the change in time (ms). These values were subsequently used to identify the onset and offset of each raising or falling transitions using the operational criteria approximating the 20 Hz/20 ms rule (Weismer, Kent, Hodge, & Martin, 1988). The slope of this precisely delimited transition was finally measured by dividing the overall frequency change (transition extent) by the transition duration. This same procedure has been used in past studies investigating diphthong slopes in dysarthria (Tjaden, Richards, Kuo, Wilding, & Sussman, 2013).
2.3.3. Locus equations
Locus equations were measured for CVCV tokens produced in a carrier phrase. Locus equations are measured by calculating linear regression functions using F2 vowel onset and F2 vowel target (temporal mid-point). These formant frequencies were obtained for the second, accented vowel in CVCV tokens. F2 Onset of vowels were measured at the first discernible glottal pulse after the plosive burst. F2 vowel Targets were measured by averaging formant values in the 25-ms temporal center of the vowels. Both values were measured using a 500-ms analysis window. This procedure follows the guidelines suggested by Sussman, McCaffrey Morrison, and Matthews (1991) for LE measurements and has been used in a previous study investigating coarticulation in PD following LSVT® (Martel-Sauvageau, Roy, Langlois et al., 2015). Using these F2 data, linear regression functions were calculated for each of the three initial consonants representing different places of articulation,/b//d/and/g/, with F2 Onset as the dependent variable and F2 Target as the predictor variable. The general form of these equations is F2onset = k x F2mid + c, where k and c are constants, slope and y-intercept, respectively.
Constants serve as acoustic markers for place of consonant articulation. The distinctiveness between equations corresponding to each place of articulation is a composite metric that reflects the way transition patterns occur between a single stop and the following vowel. One of the advantages of the distinctiveness metric is that it allows for broad analysis of CV transitions as a simplified and reduced system. This variable was measured using the mathematical parameters of the equations (slope and the y-intercept) as dimensions of a defined higher-order triangular locus space. To provide the same numerical scale for slope and y-intercept values, the y-intercepts were normalized by dividing by 2000. The area of this triangular locus space can be calculated from Euclidean distances between/b/-/d/-/g/coordinates. This locus space surface serves as the distinctiveness criteria. This method has been used in previous studies on LE and has proven sensitive to a variety of clinical populations, including stuttering (Sussman et al., 2011), hearing impairment (McCaffrey Morrison, 2012), child apraxia of speech (Sussman, Fruchter, Hilbert, & Sirosh, 1998) and dysarthria (Martel-Sauvageau, Roy, Langlois et al., 2015).
2.3.4. Reliability of acoustic data
To verify the reliability of F2 slope and LE metrics, the two acoustic measures of primary interest, 20% of the extracted F2 values in the glide slopes and the locus equations measurements were re-analyzed for each speaker by an independent investigator using the same criteria for vowel segmentation and formant adjustments. Correlation coefficients between the two data sets were high for both metrics (e.g., r = 0.94 and r = 0.97 for F2 slope and LEs, respectively).
2.4. Perceptual analyses
2.4.1. Speech intelligibility
Speech intelligibility was assessed for both groups (PD and Controls), and in DBS state for the PD group (On-DBS and Off-DBS). Three speech-language pathologists with at least six years of clinical experience with dysarthria independently judged overall speech intelligibility on the passage reading for each speaker (PD and Control) and DBS state (On- and Off-DBS). A total of 24 recordings (8 On-DBS, 8 Off-DBS, 8 Control) were presented to individual speech pathologists in a quiet room. The samples were presented via over ear headphones (Sennheiser HD380) in the same randomized order for each listener. The judges were blinded to the neurological and DBS status of every recording. To assure that each sample was listened to at an adequate intensity level, the first segment of the first sentence (“La bise et le soleil […]”) of each sample was presented to each listener and they were instructed to adjust the volume to a comfortable level. Once the volume was adjusted, the listener heard the entire sample. Following McHenry (2011), listeners judged intelligibility using a visual analog scale (VAS). SLPs were asked to place a vertical mark on an undifferentiated 229-mm horizontal line to indicate how much they understood of what the person said (from “understood none” to “understood all”). Similar visual analog scales have been used in previous studies to assess general intelligibility in clinical populations and have been strongly correlated to more time-consuming tasks such as orthographic or phonetic transcription (Huttunen & Sorri, 2004).
2.4.2. Reliability of intelligibility measurement
In order to measure intra-listener reliability, 25% of the samples were judged a second time by each listener. Pearson product moment correlation coefficients for the first and second presentation of samples for all three judges ranged from 0.96 to 0.98. Interjudge reliability was assessed using the Intraclass correlation coefficient (ICC) to determine the consistency of ratings among the three judges. The item level ICC, which reflects reliability among the judges at the level of every single recording they listened to, was 0.89. The average level ICC, which reflects the average agreement among all judges and stimuli, was 0.96. Thus, listeners demonstrated excellent agreement on a per item basis and on average All ICC’s also were statistically significant (p < 0.001).
2.5. Statistical analyses
All statistical analyses were performed using SPSS v.20 (IBM Corporation, 2014). For all analyses, all datasets part of the same participant group and DBS state were treated as part of the same dataset, creating three different Conditions in the study: PD On-DBS, PD Off-DBS and Control. The term “Condition” will therefore be used in the following paragraphs to refer to these three different datasets. This terminology has been used in previously published articles (i.e. Sidtis et al., 2016) where control participants were matched to PD participants on an individual level.
The effect of Condition on each dependent variable was analyzed using a mixed model analysis of variance (ANOVA). The Condition factor was entered in the model as a random repeated factor and was based on an unstructured covariance matrix, which allowed for unequal variance between each repeated measure (Tabachnik & Fidell, 2013). Participants were entered in the model as a random factor and were based on a scaled identity covariance matrix. Finally, Condition (PD Off-DBS, PD On-DBS and Control) was treated as a fixed factor. Post-hoc pair-wise comparisons using Bonferonni corrections were conducted when required. Prior to all group analyses, all repetitions of the same token (for F2 slopes) or stop (for LEs) within a variable were averaged. This procedure follows the guidelines suggested for phonetics research in Max and Onghena (1999).
3. Results
3.1. Articulation rate
For average articulation rate in syllables per second, no statistical difference was observed between the PD Off-DBS (M = 4.45, SD = 0.34), the PD On-DBS (M = 4.63, SD = 0.35) and the Control group (M = 5.08, SD = 0.12): F (2,8) = 3.36, p = 0.09. Thus, articulation rate in the text reading did not differ across conditions, either between the PD and the control group or with DBS state.
3.2. Glide slopes
Table 2 reports means and standard deviations for transition duration (ms), F2 transition extent (Hz) and F2 Slope (Hz/ms) in each Condition. Table 2 also reports details regarding the statistical analyses. Fig. 1 displays F2 slope values for the three glide contexts. There was a significant effect of Condition for all F2 slope metrics (/wa/, p = 0.006;/ja/, p = 0.002;/εj/; p = 0.001). Table 2 further indicates that this difference was mostly due to differences in transition extent, as opposed to transition duration. Post-hoc comparisons indicated that the mean F2 slopes for the control group were significantly steeper than those of both PD On-DBS (/wa/, p = 0.014;/ja/; p = 0.001;/εj/, p = 0.020) and PD Off-DBS (/wa/, p = 0.006;/ja/, p = 0.001;/εj/, p = 0.003). PD On-DBS and PD Off-DBS also did not differ significantly DBS (/wa/, p = 1.000;/ja/, p = 1.000;/εj/, p = 1.000). No statistically significant interactions were present. Observation of individual data for the participants of the PD group further indicated that three participants produced steeper slopes for On-DBS, one participant produced shallower slopes for On-DBS, while the remaining four participants did not show clear variation with DBS.
Table 2.
Average glide duration, F2 change and F2 slope for PD Off-DBS, PD On-DBS and control: means (standard deviations), F-statistic and p values.
| /wa/ | /ja/ | /εj/ | |||||||
|---|---|---|---|---|---|---|---|---|---|
|
|
|
|
|||||||
| Transition Duration (ms) | Transition extent (Hz) | Slope (Hz/ ms) | Transition Duration (ms) | Transition extent (Hz) | Slope (Hz/ ms) | Transition Duration (ms) | Transition extent (Hz) | Slope (Hz/ ms) | |
| PD | 118.8 | 935.8 | 8.257 | 113.8 | −359.2 | −3.273 | 127.7 | 356.8 | 2.88 |
| Off-DBS | −23 | −290.8 | −3.482 | −36.4 | −95.8 | −0.943 | −44 | −171.9 | −1.309 |
| PD | 119.5 | 986.1 | 8.706 | 100.6 | −326.5 | −3.265 | 122.1 | 405.4 | 3.323 |
| On-DBS | −26.9 | −166.3 | −2.371 | −24.3 | −127.1 | −0.938 | −15.5 | −138.5 | −1.037 |
| Control | 103.9 | 1326.8 | 12.953 | 105.6 | −604.8 | −5.78 | 118.3 | 582.7 | 5.034 |
| −4.7 | −204.2 | −1.973 | −16.6 | −212.3 | −1.525 | −35.9 | −190.8 | −1.057 | |
| F-statistic | 1.935 | 23.036 | 10.345 | 0.817 | 9.651 | 15.207 | 0.13 | 4.081 | 18.732 |
| dfs | 2, 7.91 | 2, 8.26 | 2, 7.84 | 2, 7.92 | 2, 7.98 | 2, 7.88 | 2, 7.90 | 2, 7.94 | 2, 7.91 |
| p | 0.208 | < 0.001* | 0.006* | 0.481 | 0.007* | 0.002* | 0.881 | 0.062 | 0.001* |
Note:
significant effect.
Fig. 1.
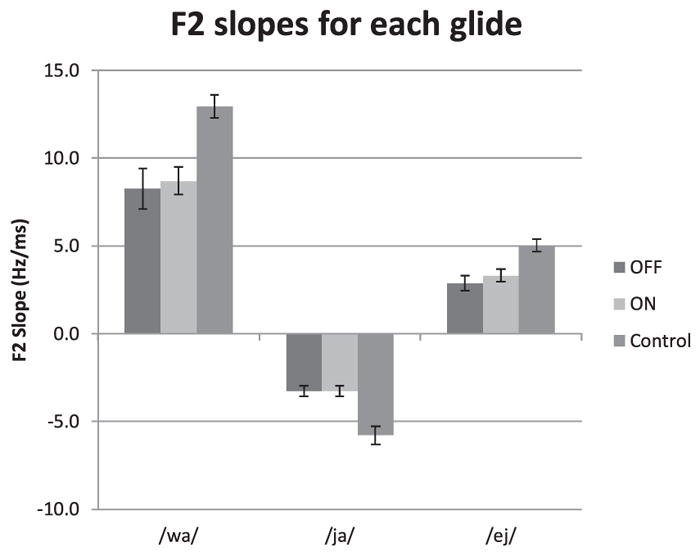
Average F2 slopes (with standard deviations) for the analyzed diphthong in each condition.
3.3. Locus equations
Table 3 reports locus equations parameters (slope and y-intercept) corresponding to each consonant place of articulation as well as LE distinctiveness (squared slope units). Table 3 also reports details of the statistical analyses. Fig. 2 displays normalized locus equation spaces. Statistical analyses indicated a significant effect of Condition for LE distinctiveness surface (p = 0.022). Post-hoc comparisons indicated that the LE distinctiveness for the control group was significantly higher than for PD On-DBS (p = 0.026). Table 3 suggests that this difference was mostly due to a shallower LE slope in the/d/context for healthy participants as well as a steeper slope in the/g/context. PD On-DBS and PD Off-DBS also were not significantly different (p = 1.000). Observation of individual data for the participants of the PD group indicated that four participants produced more distinct equations at On-DBS (on average, an 320% increase in slope units), one produced less distinct equations at On-DBS (a 23% decrease in slope units), while the remaining participant did not show clear variation with DBS.
Table 3.
Locus equation parameters and equation distinctiveness for each group: means, F-statistic and p values.
| Slope | Intercept | LE distinctiveness surface (slope units squared) | ||
|---|---|---|---|---|
| PD. Off-DBS | /b/ | 0.630 | 608.6 | 0.0180 |
| /d/ | 0.532 | 907.0 | ||
| /g/ | 0.931 | 251.7 | ||
| PD On-DBS | b/ | 0.721 | 465.5 | 0.0239 |
| /d/ | 0.484 | 995.8 | ||
| /g/ | 0.950 | 188.5 | ||
| Control | /b/ | 0.673 | 506.6 | 0.0535 |
| /d/ | 0.287 | 1331.2 | ||
| /g/ | 1.039 | 134.2 | ||
| F-statistic | 4.745 | |||
| dfs | 2, 8 | |||
| p | =0.044* |
Note.
significant effect.
Fig. 2.

Locus space defined by equations parameters (slope and normalized y-intercept) for each condition.
3.4. Intelligibility measures
Fig. 3 reports intelligibility judgments averaged across listeners. Higher scale values represent greater speech intelligibility. Statistical analyses indicated a significant effect of Condition F (2,8) = 4.990, p = 0.04. Post-hoc comparisons indicated that for the control group, intelligibility was significantly higher compared to both PD On-DBS (p = 0.03) and PD Off-DBS (p = 0.03). PD On-DBS and PD Off-DBS also did not differ significantly (p = 1.000). Observation of individual data for the participants of the PD group indicated that three participants were judged to be more intelligible at On-DBS (on average, an 18% increase), three were judged less intelligible at On-DBS (on average, a 10% decrease), while the remaining two participants did not show clear variation with DBS.
Fig. 3.
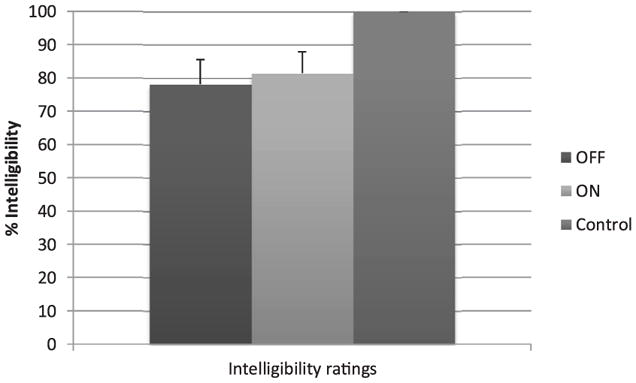
Averaged intelligibly levels (with standard deviations) for each condition.
Finally, Table 4 reports Spearman correlation coefficients between speech intelligibility and the different acoustic measures of vocalic transitions. Overall, coefficients suggest moderate to high association between intelligibility and the three F2 slopes in glides, with steeper slopes associated with greater intelligibility (ranging, in absolute values, from r = 0.706, p < 0.001 to r = 0.741, p < 0.001). On the other hand, the correlation between intelligibility and locus equation distinctiveness was not statistically significant (r = 0.368, p = 0.066). All p-values were strictly corrected (Bonferroni) in the analyses for multiple (4) comparisons.
Table 4.
Spearman correlation coefficients between speech intelligibility the different vocalic transition measures.
| Average intelligibility | F2 slope for/wa/ | F2 slope for/ja/ | F2 slope for/εj/ | |
|---|---|---|---|---|
| Average intelligibility. | – | – | – | – |
| F2 slope for/wa/ | 0.754* | – | – | – |
| F2 slope for/ja/ | −0.706* | −0.843* | – | – |
| F2 slope for/εj/ | 0.741* | 0.891* | −0.801* | – |
| Locus equation distinctiveness | 0.368 | 0.250 | −0.263 | 0.343 |
Notes.
Correlation is significant at the p < 0.001 level.
Observation of individual data for the participants of the PD group indicated a relationship between F2 slope and intelligibility for only half (4/8) of the participants. Surprisingly, a single participant also exhibited a relationship between the acoustic and the perceptual measures in the direction opposite to that expected. This result will be discussed in the following section.
4. Discussion
This study investigated the impact STN-DBS on speech production in participants with Parkinson’s Disease. Two metrics of vocalic transitions were analyzed, including F2 slopes for glides as well as Locus Equations for consonant-vowel sequences. The association between these metrics and speech intelligibility was also investigated. The following sections first consider the findings regarding the On versus Off effects of STN-DBS, followed by the findings regarding the metrics used in this study. Potential clinical implications are briefly considered, as are limitations.
4.1. On-Off effects of STN-DBS
In general, past studies investigating the impact of On vs Off STN-DBS stimulation on speech production/intelligibility in PD have reported mixed results (Skodda, 2012). For example, Dromey and Bjarnason (2011) analyzed multiple acoustic parameters at On vs Off STN-DBS in six participants with PD. No clear or consistent trend across speakers was found for any dependent variables, with some speakers improving while others worsening depending on the particular measure. Similar mixed results were found in the present study. A recent perceptual study by Tsuboi et al. (2014) may help to explain these types of mixed results. Tsuboi et al. (2014) investigated the On-Off impacts of STN-DBS on multiple perceptual variables in a large cohort of patients with PD (n = 76). Using the Grade, Roughness, Breathiness, Asthenia, Strain (GRBAS) voice scale and the Assessment of Motor Speech for Dysarthria (AMSD), the authors were able to distinguish 6 different phenotypes of dysarthria based on prominent perceptual symptoms. They concluded that speech intelligibility was worsened under STN-DBS mostly for patients exhibiting rate control deficits (“Stuttering type”) or phonation hyperfunction (“Strained voice type”). On the other hand, patients with mild or no speech impairment (“Relatively good speech type”) or with hypophonia (“Breathy voice type”) did not exhibit marked changes in intelligibly between On- or Off-stimulation conditions. These findings provide a useful framework to interpret the current results. In the present study, three participants were judged to be more intelligible On-stimulation, three were judged less intelligible On-stimulation, while two did not show clear change. Taking into considerations the sub-types identified by Tsuboi and colleagues, a post-hoc qualitative perceptual analysis was undertaken in which a trained SLP (VMS) with experience in dysarthria assigned each participant with PD to a phenotype using the experimental reading passages. Of the eight participants, two showed signs of stuttering/palilalia and were judged to be worse at On-stimulation. One participant was judged to exhibit vocal hyperfunction and also to be worse at On-stimulation. In addition, all other participants judged to be better at On-stimulation (n = 3) or who did not clearly vary exhibited (n = 2) either mild articulatory impairment or mostly hypophonia. These qualitative findings, while limited, support the hypothesis that different dysarthria phenotypes in PD may respond differently to STN-DBS. In other words, depending on the main speech characteristics of a patient, the response to the stimulation of STN-DBS could vary. These findings also illustrate the importance of careful consideration of individual speaker data.
4.2. Vocalic transitions and speech intelligibility
Weismer et al. (2012) acknowledged mixed findings regarding the impact of STN-DBS on dysarthria in PD and considered various metrics that could be used to adequately measure the effects of this surgical treatment. On the one hand, they suggested that F2 slopes “is well suited to make inferences to speech motion and to predict speech intelligibility” (p.74). On the other hand, they added that the “use of other measures should not be ruled out, however, and we encourage further development of evaluative criteria for speech measures designed to probe the effects of DBS or any treatment with potential effects on speech production”. Following these recommendations, F2 slopes in glides were obtained in the present study, as well as Locus Equations in C-V sequences, which have been shown sensitive to behavioral treatment for dysarthria in a past study (Martel-Sauvageau, Roy, Langlois et al., 2015).
Regarding the F2 slope metric, the majority of past studies have investigated diphthong F2 slope. Fine motor control, as well as adequate articulatory performance are required for diphthongs to be produced effectively in English because they require large and rapid changes in vocal tract shape. Diphthongs appear in multiple languages, but are not typical of European French. While frequent in Quebec French (Sigouin & Arnaud, 2015), their use in normal speech is dependent on numerous factors, such as geographic localization, speaking context, the age of the speaker or even education level (Leblanc, 2012; Ostiguy & Tousignant, 2008). These socio-linguistics variations make diphthongs difficult to study in Quebec French. On the other hand, glides are an alternative transitional segment that are present in French, but are not influenced by these factors. In the present study, glide F2 slopes were found to differentiate speakers with PD and healthy controls. In addition, F2 slope was positively correlated with speech intelligibility on a group level, but was negatively correlated for one participant on an individual level. This specific participant, for whom steeper F2 slopes were associated with reduced intelligibility, raises challenging questions. One hypothesis is that for this individual, intelligibility was mostly driven by factors other than articulation, such as voice quality or suprasegmental features.
In a recent conference paper, Knowles, Adams, Abeyesekera, Manicinelli, and Jog (2016) investigated the impact of the individual electrical parameters of STN-DBS on multiple acoustic and perceptual speech variables, including F2 slope and intelligibility. They reported that F2 transition extent in diphthongs was significantly correlated with intelligibility, while overall F2 slope was not. In the present study, F2 slopes were strongly correlated with intelligibility. One explanation for this difference could be that articulation rate did not vary with STN-DBS in our study, while it may have in the study of Knowles and colleagues.
Finally, different results were found for F2 slopes and LEs, even though both metrics focus on vocalic transitions. One reason might be that the precise nature of the transition assessed by each metric differs. Specifically, F2 slopes capture articulatory range and speed (Yunusova et al., 2012), while locus equations measure anticipatory and carry-over coarticulation (Agwuele, Sussman, & Lindblom, 2008). In the present study, only F2 slopes were associated with speech intelligibility. This finding is consistent with previous literature suggesting intelligibility impairment in PD might not primarily be driven by coarticulation impairments (Tjaden, 2000, 2003). Conservatively, is it to be noted that in the present study, the two acoustic metrics of vocalic transitions were extracted from different speech tasks (text reading vs carrier phrases). This variation in the performance associated with different speaking contexts might have generated atypical acoustic/articulatory phenomena. For example, the carrier phrase task may have elicited a more canonical or formal style of articulation that could have minimized group differences. Additional research is required on this point in the PD STN-DBS population.
4.3. Limitations and directions for future research
As for other studies investigating speech outcomes following STN-DBS, the current findings are based on a restricted N. Large scale studies, similar to work by Tripoliti et al. (2014) are needed to delineate measures and methods ideally suited for quantifying the effects of STN-DBS on speech production and intelligibility. As noted previously, acoustic measures and judgments of intelligibility also were obtained for a variety of speech tasks. Task-related differences in performance have been reported in a variety of non-surgical PD studies (e.g., Kempler & Lancker, 2002; Tjaden & Wilding, 2011), but speech task effects or factors following STN-DBS are only beginning to be studied (see Aldridge et al., 2016; Van Lancker Sidtis, Rogers, Godier, Tagliati, & Sidtis, 2010).
Currently, STN-DBS is the most widely used surgical intervention for PD. An alternative stimulation site is the internal segment of the globus pallidus (Gpi) (see review in Moldovan et al., 2015). Interestingly, no significant difference in efficacy has been shown between the STN and the Gpi with respect to motor function and activities of daily living (Liu et al., 2014; Weaver et al., 2012). Speech production/intelligibility outcomes following Gpi-DBS have not been systematically studied. In light of several studies reporting reduced intelligibility following STN-DBS (see review in Aldridge et al., 2016), research is needed to directly compare speech outcomes following GPI-DBS versus STN-DBS. This line of inquiry would inform clinical decisions concerning the optimal target point for DBS, which remains open to debate (Moldovan et al., 2015).
5. Conclusions
This study is the first to investigate the changes that occur with STN-DBS in PD on two different measures of vocalic transition: F2 slopes in glides and Locus Equations in consonant-vowel sequences. Consistent with prior non-surgical studies of PD, speakers with PD have different vocalic transitions than healthy normal controls on both metrics. Comparing these metrics with speech intelligibility, we found that only F2 slopes were good predictors of intelligibility. Finally, mixed results were found among participants regarding the direct effect of the electrical stimulations on acoustic measures and intelligibility. Future studies will investigate this heterogeneity, in terms of dysarthria phenotype.
Acknowledgments
This study was supported by a post-doctoral grant from the Fonds de Recherche Société et Culture du Québec and by funding from the Centre Interdisciplinaire de Recherche en Réadaptation et Intégration Sociale. The second author’s contribution to this work was supported by R01DC004689. The authors thank the participants of the study, as well as the neurology team at CHU de Québec.
References
- Agwuele A, Sussman HM, Lindblom B. The effect of speaking rate on consonant vowel coarticulation. Phonetica. 2008;65(4):194–209. doi: 10.1159/000192792. [DOI] [PubMed] [Google Scholar]
- Aldridge D, Theodoros D, Angwin A, Vogel AP. Speech outcomes in Parkinson’s disease after subthalamic nucleus deep brain stimulation: A systematic review. Parkinsonism & Related Disorders. 2016 doi: 10.1016/j.parkreldis.2016.09.022. [DOI] [PubMed]
- Boersma P, Weenink D. Praat: Doing phonetics by computer. 2013 Retrieved from http://www.fon.hum.uva.nl/praat/
- Chahine LM, Ahmed A, Sun Z. Effects of STN DBS for Parkinson’s disease on restless legs syndrome and other sleep-related measures. Parkinsonism and Related Disorders. 2011;17(3):208–211. doi: 10.1016/j.parkreldis.2010.11.017. [DOI] [PubMed] [Google Scholar]
- Choi SH. Effects of deep brain stimulation (DBS) on speech and voice in Parkinson’s disease: Acoustic measures of vowels from sustained phonation and running speech using perturbation and nonlinear dynamic analysis. Korean Journal of Communication Disorders. 2012;17:143–155. [Google Scholar]
- D’Alatri L, Paludetti G, Contarino M, Galla S, Marchese M, Bentivoglio A. Effects of bilateral subthalamic nucleus stimulation and medication on parkinsonian speech impairment. Journal of Voice. 2008;22(3):365–372. doi: 10.1016/j.jvoice.2006.10.010. [DOI] [PubMed] [Google Scholar]
- Dromey C, Bjarnason S. A preliminary report on disordered speech with deep brain stimulation in individuals with Parkinson’s disease. Parkinson’s Disease. 2011;2011:1–11. doi: 10.4061/2011/796205. [DOI] [PMC free article] [PubMed] [Google Scholar]
- Duffy JR. Motor speech disorders: Substrates, differential diagnosis, and management. 3. St. Louis, MO: Elsevier Health Sciences; 2012. [Google Scholar]
- Fairbanks G. Voice and articulation drillbook. New York, NY: Harper & Row; 1960. [Google Scholar]
- Frost E, Tripoliti E, Hariz MI, Pring T, Limousin P. Self-perception of speech changes in patients with Parkinson’s disease following deep brain stimulation of the subthalamic nucleus. International Journal of Speech-Language Pathology. 2010;12(5):399–404. doi: 10.3109/17549507.2010.497560. [DOI] [PubMed] [Google Scholar]
- Goetz CG, Tilley BC, Shaftman SR, Stebbins GT, Fahn S, Martinez-Martin P, … LaPelle N. Movement disorder society-sponsored revision of the unified parkinson’s disease rating scale (MDS-UPDRS): Scale presentation and clinimetric testing results. Movement Disorders. 2008;23(15):2129–2170. doi: 10.1002/mds.22340. [DOI] [PubMed] [Google Scholar]
- Guo X, Gao G, Wang X, Li L, Li W, Liang Q, Zhang H. Effects of bilateral deep brain stimulation of the subthalamic nucleus on olfactory function in Parkinson’s disease patients. Stereotactic and Functional Neurosurgery. 2008;86(4):237–244. doi: 10.1159/000131662. [DOI] [PMC free article] [PubMed] [Google Scholar]
- Hoffman-Ruddy B, Schulz G, Vitek J, Evatt M. A preliminary study of the effects of subthalamic nucleus (STN) deep brain stimulation (DBS) on voice and speech characteristics in Parkinson’s Disease (PD) Clinical Linguistics & Phonetics. 2001;15(1):97–101. doi: 10.3109/02699200109167638. [DOI] [PubMed] [Google Scholar]
- Huttunen K, Sorri M. Methodological aspects of assessing speech intelligibility among children with impaired hearing. Acta Oto-Laryngologica. 2004;124(4):490–494. doi: 10.1080/00016480310000557. [DOI] [PubMed] [Google Scholar]
- IBM Corporation. IBM SPSS statistics for windows. Armonk, NY, USA: IBM Corp; 2014. [Google Scholar]
- International Phonetic Association. The principles of the international phonetic association. London, UK: Department of Phonetics, University College; 1949. [Google Scholar]
- Kempler D, Lancker DV. Effect of Speech Task on Intelligibility in Dysarthria: A Case Study of Parkinson’s Disease. Brain and Language. 2002;80(3):449–464. doi: 10.1006/brln.2001.2602. [DOI] [PubMed] [Google Scholar]
- Kim H, Hasegawa-Johnson M. Second-formant locus patterns in dysarthric speech. Journal of Acoustical Society of America. 2012;132(3):2089. doi: 10.1121/1.4755719. [DOI] [Google Scholar]
- Kim HJ, Paek SH, Kim JY, Lee JY, Lim YH, Kim MR, … Jeon BS. Chronic subthalamic deep brain stimulation improves pain in Parkinson disease. Journal of Neurology. 2008;255(12):1889–1894. doi: 10.1007/s00415-009-0908-0. [DOI] [PubMed] [Google Scholar]
- Kim Y, Weismer G, Kent RD, Duffy JR. Statistical models of F2 slope in relation to severity of dysarthria. Folia Phoniatrica et Logopaedica. 2009;61(6):329–355. doi: 10.1159/000252849. [DOI] [PMC free article] [PubMed] [Google Scholar]
- Kim YJ, Kent RD, Weismer G. An acoustic study of the relationships among neurologic disease, dysarthria type, and severity of dysarthria. Journal of Speech, Language and Hearing Research. 2011 Apr;54:417–429. doi: 10.1044/1092-4388(2010/10-0020)a. [DOI] [PMC free article] [PubMed] [Google Scholar]
- Knowles T, Adams S, Abeyesekera A, Manicinelli C, Jog M. Deep brain stimulation parameter optimization for speech intelligibility and vowel acoustics in Parkinson’s disease. International clinical phonetics and linguistics association conference. 2016 doi: 10.1044/2017_JSLHR-S-17-0157. [DOI] [PubMed] [Google Scholar]
- Leblanc G. Étude acoustique des voyelles orales susceptibles D’Être diphtonguées en français québécois. Université Laval; 2012. [Google Scholar]
- Lindblom B, Sussman HM. Dissecting coarticulation: How locus equations happen. Journal of Phonetics. 2012;40(1):1–19. doi: 10.1016/j.wocn.2011.09.005. [DOI] [Google Scholar]
- Liu Y, Li W, Tan C, Liu X, Wang X, Gui Y, … Chen L. Meta-analysis comparing deep brain stimulation of the globus pallidus and subthalamic nucleus to treat advanced Parkinson disease. Journal of Neurosurgery. 2014;121(3):709–718. doi: 10.3171/2014.4.JNS131711. [DOI] [PubMed] [Google Scholar]
- Martel-Sauvageau V, Macoir J, Langlois M, Prud’homme M, Cantin L, Roy JP. Changes in vowel articulation with subthalamic nucleus deep brain stimulation in dysarthric speakers with parkinson’s disease. Parkinson’s Disease. 2014;2014:1–9. doi: 10.1155/2014/487035. [DOI] [PMC free article] [PubMed] [Google Scholar]
- Martel-Sauvageau V, Roy JP, Cantin L, Prud’homme M, Langlois M, Macoir J. Articulatory changes in vowel production following STN DBS and levodopa intake in parkinson’s disease. Parkinson’s Disease. 2015;2015:1–7. doi: 10.1155/2015/382320. [DOI] [PMC free article] [PubMed] [Google Scholar]
- Martel-Sauvageau V, Roy J-P, Langlois M, Macoir J. Impact of the LSVT® on vowel articulation and coarticulation in Parkinson’s disease. Clinical Linguistics & Phonetics. 2015:1–17. doi: 10.3109/02699206.2015.1012301. [Early Online] [DOI] [PubMed] [Google Scholar]
- Max L, Onghena P. Some issues in the statistical analysis of completely randomized and repeated measures designs for speech, language, and hearing research. Journal of Speech, Language and Hearing Research. 1999;42(2):261–270. doi: 10.1044/jslhr.4202.261. [DOI] [PubMed] [Google Scholar]
- McCaffrey Morrison H. The locus equation as an index of coarticulation in syllables produced by speakers with profound hearing loss. Clinical Linguistics & Phonetics. 2008;22(9):726–740. doi: 10.1080/02699200802176402. [DOI] [PubMed] [Google Scholar]
- McCaffrey Morrison H. Coarticulation in early vocalizations by children with hearing loss: A locus perspective. Clinical Linguistics & Phonetics. 2012;26(3):288–309. doi: 10.3109/02699206.2011.614718. [DOI] [PubMed] [Google Scholar]
- McHenry M. An exploration of listener variability in intelligibility judgments. American Journal of Speech Language Pathology. 2011 May;20:119–124. doi: 10.1044/1058-0360(2010/10-0059)interval. [DOI] [PubMed] [Google Scholar]
- Modarresi G, Sussman HM, Lindblom B, Burlingame E. Locus equation encoding of stop place: Revisiting the voicing/VOT issue. Journal of Phonetics. 2005;33(1):101–113. doi: 10.1016/j.wocn.2004.06.002. [DOI] [Google Scholar]
- Moldovan AS, Groiss SJ, Elben S, Südmeyer M, Schnitzler A, Wojtecki L. The treatment of Parkinson’s disease with deep brain stimulation: current issues. Neural Regeneration Research. 2015;10(7):1018–1022. doi: 10.4103/1673-5374.160094. [DOI] [PMC free article] [PubMed] [Google Scholar]
- Netsell R. Speech motor control and selected neurologic disorders. In: Grillner S, Lindblow B, Lubker J, Persson A, editors. Speech motor control. London: Oxford Pergamon Press; 1982. [Google Scholar]
- Ostiguy L, Tousignant C. In: Les prononciations du rançais québécois: Normes et usages. 2 Guerin, editor. 2008. [Google Scholar]
- Sapir S, Ramig LO, Fox C. Voice, speech, and swallowing disorders. In: Pahwa R, Lyons KE, editors. Handbook of parkinson’s disease. 5. Boca Raton, FL: Taylor & Francis Group; 2013. pp. 539–569. [Google Scholar]
- Schulz G, Grant MK. Effects of speech therapy and pharmacologic and surgical treatments on voice and speech in Parkinson’s disease A review of the literature. Journal of Communication Disorders. 2000;33(1):59–88. doi: 10.1016/S0021-9924(99)00025-8. [DOI] [PubMed] [Google Scholar]
- Seppi K, Weintraub D, Coelho M, Perez-Lloret S, Fox S, Katzenschlager R, … Sampaio C. The movement disorder society evidence-based medicine review update: Treatments for the non-motor symptoms of Parkinson’s disease. Movement Disorders. 2011;26(Suppl 3):42–80. doi: 10.1002/mds.23884. [DOI] [PMC free article] [PubMed] [Google Scholar]
- Sidtis JJ, Alken AG, Tagliati M, Alterman R, Van Lancker Sidtis D. Subthalamic stimulation reduces vowel space at the initiation of sustained production: Implications for articulatory motor control in Parkinson’s disease. Journal of Parkinson’s Disease. 2016;6(2):361–370. doi: 10.3233/JPD-150739. [DOI] [PMC free article] [PubMed] [Google Scholar]
- Sigouin C, Arnaud V. Quebec French close vowels in lengthening contexts: Tense, lax or diphthongised? An acoustic study. 18th international congress of phonetic sciences.2015. [Google Scholar]
- Skodda S. Effect of deep brain stimulation on speech performance in Parkinson’s disease. Parkinson’s Disease. 2012;2012:1–10. doi: 10.1155/2012/850596. [DOI] [PMC free article] [PubMed] [Google Scholar]
- Sussman HM, McCaffrey Morrison H, Matthews SA. An investigation of locus equations as a source of relational invariance for stop place categorization. Journal of Acoustical Society of America. 1991;90(3):1309–1325. [Google Scholar]
- Sussman HM, Fruchter D, Hilbert J, Sirosh J. Linear correlates in the speech signal: The orderly output constraint. Behavioral and Brain Sciences. 1998;21(2):241–259. 260–299. doi: 10.1017/s0140525x98001174. [DOI] [PubMed] [Google Scholar]
- Sussman HM, Marquardt TP, Doyle J. An acoustic analysis of phonemic integrity and contrastiveness in developmental apraxia of speech. Journal of Medical Speech-Language Pathology. 2000;8(4):301–313. [Google Scholar]
- Sussman HM, Byrd CT, Guitar B. The integrity of anticipatory coarticulation in fluent and non-fluent tokens of adults who stutter. Clinical Linguistics & Phonetics. 2011;25(3):169–186. doi: 10.3109/02699206.2010.517896. [DOI] [PubMed] [Google Scholar]
- Tabachnik BG, Fidell LS. Using multivariate statistics. 6. New York, NY: Pearson Education; 2013. [Google Scholar]
- Tjaden K, Richards E, Kuo C, Wilding GE, Sussman J. Acoustic and perceptual consequences of clear and loud speech. Folia Phoniatrica Et Logopaedica. 2013;65(4):214–220. doi: 10.1159/000355867. [DOI] [PMC free article] [PubMed] [Google Scholar]
- Tjaden K. An acoustic study of coarticulation in dysarthric speakers with Parkinson disease. Journal of Speech, Language and Hearing Research. 2000;43(6):1466–1480. doi: 10.1044/jslhr.4306.1466. [DOI] [PubMed] [Google Scholar]
- Tjaden K. Anticipatory coarticulation in multiple sclerosis and Parkinson’s disease. Journal of Speech, Language and Hearing Research. 2003;46(4):990–1008. doi: 10.1044/1092-4388(2003/077). [DOI] [PubMed] [Google Scholar]
- Tjaden K, Wilding GE. Effects of speaking task on intelligibility in Parkinson’s disease. Clinical Linguistics & Phonetics. 2011;25(2):155–168. doi: 10.3109/02699206.2010.520185. [DOI] [PMC free article] [PubMed] [Google Scholar]
- Tommasi G, Krack P, Fraix V, Le Bas JF, Chabardès S, Benabid AL, Pollak P. Pyramidal tract side effects induced by deep brain stimulation of the subthalamic nucleus. Journal of Neurology, Neurosurgery, and Psychiatry. 2008;79(7):813–819. doi: 10.1136/jnnp.2007.117507. [DOI] [PubMed] [Google Scholar]
- Tripoliti E, Zrinzo L, Martinez-Torres I, Frost E, Pinto S, Foltynie T, … Limousin P. Effects of subthalamic stimulation on speech of consecutive patients with Parkinson disease. Neurology. 2011;76(80):80–86. doi: 10.1212/WNL.0b013e318203e7d0. [DOI] [PMC free article] [PubMed] [Google Scholar]
- Tripoliti E, Limousin P, Foltynie T, Candelario J, Aviles-Olmos I, Hariz MI, Zrinzo L. Predictive factors of speech intelligibility following sub-thalamic nucleus stimulation in consecutive patients with Parkinson’s disease. Movement Disorders. 2014;27(4):532–538. doi: 10.1002/mds.25816. [DOI] [PMC free article] [PubMed] [Google Scholar]
- Tsuboi T, Watanabe H, Tanaka Y, Ohdake R, Yoneyama N, Hara K, … Sobue G. Distinct phenotypes of speech and voice disorders in Parkinson’s disease after subthalamic nucleus deep brain stimulation. Journal of Neurology, Neurosurgery, and Psychiatry. 2014;0:1–9. doi: 10.1136/jnnp-2014-308043. [DOI] [PubMed] [Google Scholar]
- Van Lancker Sidtis D, Rogers T, Godier V, Tagliati M, Sidtis JJ. Voice and fluency changes as a function of speech task and deep brain stimulation. Journal of Speech Language and Hearing Research. 2010;53(5):1167–1177. doi: 10.1044/1092-4388(2010/09-0154). [DOI] [PMC free article] [PubMed] [Google Scholar]
- Volkmann J. Deep brain stimulation for the treatment of parkinson’s disease. Journal of Clinical Neurophysiology. 2004;21(1):6–17. doi: 10.1097/00004691-200401000-00003. [DOI] [PubMed] [Google Scholar]
- Weaver FM, Follett KA, Stern M, Luo P, Harris CL, Kwan H, … Reda DJ. Randomized trial of deep brain stimulation for Parkinson disease: thirty-six-month outcomes. Neurology. 2012;79(1):55–65. doi: 10.1212/WNL.0b013e31825dcdc1. [DOI] [PMC free article] [PubMed] [Google Scholar]
- Weismer G, Kent RD, Hodge MM, Martin R. The acoustic signature for intelligibility test words. Journal of Acoustical Society of America. 1988;84(4):1281–1291. doi: 10.1121/1.396627. [DOI] [PubMed] [Google Scholar]
- Weismer G, Yunusova Y, Bunton K. Measures to evaluate the effects of DBS on speech production. Journal of Neurolinguistics. 2012;25(2):74–94. doi: 10.1016/j.jneuroling.2011.08.006. [DOI] [PMC free article] [PubMed] [Google Scholar]
- Whiteside SP, Grobler S, Windsor F, Varley R. An acoustic study of vowels and coarticulation as a function of utterance type: A case of acquired apraxia of speech. Journal of Neurolinguistics. 2010;23(2):145–161. doi: 10.1016/j.jneuroling.2009.12.002. [DOI] [Google Scholar]
- Woisard V, Bodin S, Puech M. Le Voice Handicap Index: Impact de la traduction française sur la validation. Revue De Laryngologie, D’otologie Et De Rhinologie. 2004;125(5):307–312. [PubMed] [Google Scholar]
- Yunusova Y, Green JR, Greenwood L, Wang J, Pattee GL, Zinman L. Tongue movements and their acoustic consequences in amyotrophic lateral sclerosis. Folia Phoniatrica et Logopaedica. 2012;64(2):94–102. doi: 10.1159/000336890. [DOI] [PMC free article] [PubMed] [Google Scholar]