

Abstract
Glycerol monolaurate (GML) is a monoglyceride with potent antimicrobial properties that suppresses T cell receptor (TCR)-induced signaling and T cell effector function. Actin rearrangement is needed for the interaction of T cells with antigen presenting cells and for migration to sites of infection. Because of the critical role actin rearrangement plays in T cell effector function, we analyzed the effect of GML on the rearrangement of the actin cytoskeleton after TCR activation. We found that GML-treated human T cells were less adherent than untreated T cells and did not form actin ring structures, but instead developed numerous inappropriate actin-mediated filopodia. The formation of these filopodia was not due to disruption of TCR-proximal regulators of actin or microtubule polymerization. Instead, total internal reflection fluorescence microscopy demonstrated mislocalization of actin nucleation protein Arp2 microclusters, but not those containing the adaptor proteins SLP-76 and WASp, or the actin nucleation protein ARPC3, which are necessary for TCR-induced actin rearrangement. Additionally, SLP-76 microclusters colocalized with WASp and WAVE microclusters, but not LAT. Together, our data suggest that GML alters actin cytoskeletal rearrangements and identify diverse functions for GML as a T cell-suppressive agent.
Introduction
T cells encounter and respond to various stimuli by sensing specific peptide-MHC complexes on antigen-presenting cells (APCs) through the T cell receptor (TCR) (1). TCR signaling cascades connect extrinsic activation signals with actin polymerization pathways that regulate intracellular signaling, adhesion, and migration of T cells (2, 3). TCR activation at the original point of contact between the T cell and the APC results in an expanding wave of lamellar actin that maximizes surface contact between these cells. This stimulates T cells to form a dense actin network at the periphery of the cell that is rich in adhesive structures, termed the distal supermolecular activation cluster (dSMAC) (3). The dSMAC surrounds a region rich in actomyosin structures called the peripheral supermolecular activation cluster (pSMAC), which contains large multiprotein signaling clusters (3). Retrograde movement of actin from the dSMAC and actomyosin “arcs” from the pSMAC are critical to accumulate signaling complexes in the center of the cell and drive the formation of an actin-depleted central supermolecular activation cluster (cSMAC) (2–4). Together, the dSMAC, pSMAC, and cSMAC form the immunological synapse, which is necessary for TCR signal transduction and T cell function.
The formation of the actin structures at the dSMAC and pSMAC is regulated by two classes of actin-nucleation factors, the formin family and the Arp2/3 complex. These proteins compete for actin monomers and negatively regulate each other’s function (5, 6). Formins bind to the barbed edge of actin filaments and prevent the association of actin with actin-capping proteins (7). Formins regulate the assembly of structures in the pSMAC and are critical for the retrograde flow of signaling clusters into the cSMAC (8, 9). In contrast, the activated Arp2/3 complex mediates the branching of actin filaments that ultimately drives the formation of the dense lamellipodia structures in the dSMAC (8, 10). The Arp2/3 complex is activated by actin nucleation-promoting factors, such as Wiskott-Aldrich Syndrome protein (WASp) and WASp family verprolin-homologous protein-2 (WAVE2) (11–14), which have distinct functions in actin rearrangement in T cells. WAVE2 promotes the formation of lamellar actin structures found in the dSMAC (13–15), whereas WASp regulates actin structures associated with signaling complexes in the pSMAC (3, 15, 16). The activation of both WASp and WAVE2 requires the adaptor protein linker for activation of T cells (LAT) (15). LAT phosphorylation promotes recruitment of the adaptor protein SLP-76 (or SH2 Domain-Containing Leukocyte Protein Of 76 KDa) and its binding partners. This leads to the activation of the small GTPases CDC42 (or Cell division control protein 42 homolog) and Rac1 (Rac family small GTPase 1), which are critical for the activation of WASp and WAVE2 (17, 18). Both WASp and WAVE2 colocalize with LAT- and SLP-76-containing clusters at early timepoints after T cell activation but then migrate to different cellular structures at later times (14). Thus, TCR activation stimulates dynamic actin polymerization that is tightly controlled by the formation of LAT-dependent signaling complexes.
Triglycerides containing the twelve-carbon fatty acid lauric acid exist naturally in mammalian breast milk and coconut oil. Lauric acid triglyceride is metabolized to the monoglyceride, glycerol monolaurate (GML), where it is absorbed in the intestine (19). GML is on the FDA’s Generally Recognized as Safe list (GRAS) and incorporated in numerous commercial products, such as deodorants, lotions, cosmetics, food preservatives, and homeopathic supplements (20–22). GML has potent antimicrobial properties and suppresses the growth and virulence of a broad spectrum of pathogens, including Gram-positive and Gram-negative bacteria, select fungi species, and enveloped viruses (23–27). Because of this, topical GML is currently being tested as a therapeutic for Toxic Shock Syndrome, HIV transmission, and surgical site infections (28–30). However, GML also suppresses T cell activation by disturbing ordered lipid domains in the plasma membrane, which leads to reduced formation of punctate signaling clusters of LAT and PLC-γ1 (31–33). This in turn leads to defective PLC-γ1- mediated cytosolic calcium influx, PI3K and AKT activation, and ultimately reduced cellular proliferation and cytokine production.
Due to the intimate link between T cell activation and cytoskeletal rearrangement, we hypothesized that GML affected the function of the T cell cytoskeleton. To test this, we characterized how GML affected actin polymerization in human T cells. We observed that GML reduced TCR-mediated cellular adhesion and disrupted actin ring formation. The actin molecules instead formed aberrant filopodia structures at the plasma membrane due to the increased activation of the Arp2/3 complex. Mislocalization of SLP-76, WASp, WAVE2, and the ARPC3 protein subunit of the Arp2/3 complex away from clusters of Arp2 resulted from the impaired association between LAT and SLP-76 microcluster units at the plasma membrane. Together, these findings suggest that GML disrupted the formation of microclusters of signaling protein that are necessary for appropriate actin-cytoskeletal rearrangements in T cells.
Results
GML disrupts actin ring formation and stimulates development of filopodia structures
GML inhibits T cell effector functions by disrupting the ordered lipid domains and LAT microclusters at the plasma membrane that are necessary for efficient TCR signaling (33). Because formation of the LAT signaling complexes directly affects actin polymerization (11, 14, 34) and filamentous actin is enriched in ordered lipid domains after TCR activation (35, 36), we investigated whether GML also affected the cellular adhesion and actin dynamics required for TCR signaling. Using a fluorescence-based plate adherence assay (37), we found that GML-treated human T cells were less adherent than vehicle-treated T cells (Fig. 1A). This defect was dose-dependent and statistically significant at higher concentrations of GML. Assessing actin ring formation, we found that, consistent with previous reports (34, 37, 38), T cells activated with anti-CD3 coated on planar surfaces spread and formed a ring of polymerized actin molecules along the periphery of the cell contact (Fig. 1B). Furthermore, when quantifying the intensity of actin polymerization along the central axis of the cell, two peaks with high pixel intensity values that correlated with actin-rich regions at the cell edges were observed. In contrast, GML-treated T cells did not form an intact actin ring (Fig. 1B). These results suggest that GML reduces cellular adhesion due to improper formation of actin ring structures at the cell periphery.
Figure 1. GML reduces T cell adhesion, disrupts actin ring formation, and induces filopodia formation at the plasma membrane.
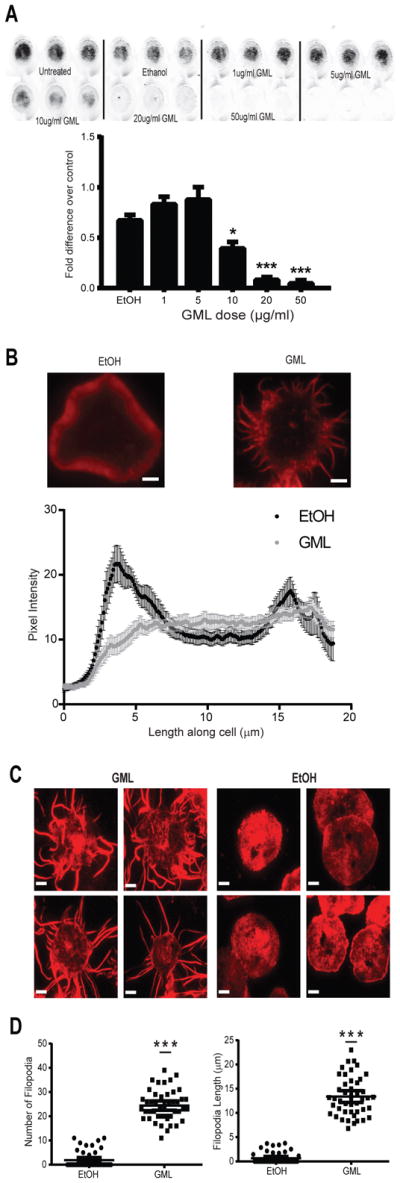
(A) Activated T cells were treated with or without ethanol or the indicated doses of GML, stained with membrane dye, and incubated on anti-CD3 coated plates. Adhesive cells were imaged and quantified using Licor Odyssey software. Top: Images are representative of 4 independent experiments. Bottom: Normalized fluorescence intensity data are means ± SEM. ** denotes p<0.01 and *** denotes p<0.001 by one-way ANOVA with multiple comparisons. (B) Epifluorescence microscopy of activated T cells treated with ethanol or GML that were stimulated with anti-CD3 and stained with TMR-conjugated phalloidin to visualize actin ring formation. Top: Images are representative of 3 independent experiments. Bottom: Pixel intensity data along the long median axis are means ± SEM of 15 cells. Peaks at 4 and 15 μm on the cell axis represent pixel intensity derived from the actin ring. Scale bar, 4 μm. (C) TIRF microscopy of activated T cells restimulated in the presence of either ethanol or GML and stained with TMR-conjugated phalloidin. Images are representative of 3 independent experiments. Scale bar, 4μm. (D) Quantification of the number and length of filopodia per cell in (C). Data are means ± SEM of 60 cells. *** denotes p<0.001 by unpaired t test with Welch’s correction.
We observed that the GML-treated cells developed protrusive structures that were positive for phalloidin staining under epifluorescence. To further characterize these actin structures at the plasma membrane, we used total internal reflection fluorescence (TIRF) microscopy, which enabled us to isolate the imaging plane within 150 nm of the T cell membrane contact site. In contrast to control T cells, which had cortical actin staining at the membrane without protrusions, GML-treated T cells developed numerous long, thin filopodia (Fig. 1C). Quantification showed that GML-treated T cells had on average ~20 filopodia that were greater than 2 μm in length as compared to ~2 filopodia in control T cells. Additionally, the mean length of the longest filopodium in GML-treated T cells was ~12 μm, but was less than 2 μm in control T cells (Fig. 1D). The effects of GML were quite rapid. After only 5 min of exposure, GML-treated T cells developed significantly more filopodial structures of >1 μm than did the control T cells. (Fig. S1). These results show that GML induces aberrant actin-mediated filopodia structures after TCR stimulation.
GML does not affect proximal TCR signaling or regulators of actin polymerization
Because GML disrupts the formation of LAT-PLC-γ1-AKT microclusters at the cell membrane (33), we tested the effect of GML on the activation of other TCR signaling proteins that regulate actin polymerization, such as the Src family kinases Lck and Fyn, focal adhesion kinase (FAK), protein tyrosine kinase 2 beta (PTK2B or Pyk2), and Paxillin (37, 39–41). We found that GML-treated T cells had no defect in the phosphorylation of Lck and Fyn (Y416), FAK (Y397), Pyk2 (Y402), or Paxillin (Y31) after TCR stimulation (Fig. 2). These data indicate that GML does not affect the activation of key signaling regulators upstream of actin polymerization.
Figure 2. GML does not affect the phosphorylation of upstream regulators of actin polymerization.

(A). Western blotting analysis of phosphorylated Lck and Fyn, FAK, Pyk2, and Paxillin was performed at the indicated times after restimulation of activated T cells treated with GML or ethanol. Blots are representative of 4 independent experiments (B). Quantification of the Western blots represented in (A). Normalized band intensity data are means ± SEM.
Formin function is critical for GML-mediated filopodia formation
Filopodia formation depends on formin-dependent polymerization of parallel actin fibers and microtubule bundling (42–44). To determine which activity was affected by GML, we used small-molecule inhibitors to block GML-dependent filipodia formation. Activated T cells treated with colchicine, an inhibitor of microtubule polymerization, did not resemble GML-treated T cells by gross appearance (45) and formed fewer, shorter filopodia than did GML-treated T cells (Fig 3A). Activated T cells treated with GML alone or concurrently with with GML and colchicine had similar numbers of filopodia structures. However, the filopodia in the cells treated with both GML and colchicine were significantly longer in length, averaging ~20 μm compared to ~10 μm for the T cells treated with GML alone. These data suggest that GML regulates filopodia formation independently of microtubule polymerization. To disrupt formin-actin filament interactions, we used SMIFH2 (small-molecule inhibitor of formin homology 2 domains), which does not affect Arp2/3 complex-dependent cytoskeletal structures (46). Similar to colchicine-treated cells, activated T cells treated with SMIFH2 did not resemble GML-treated cells but developed fewer, shorter filopodia compared to those of T cells treated with GML alone (Fig 3B). Furthermore, activated T cells treated with both SMIFH2 and GML displayed fewer filopodia than did T cells treated with GML alone. Additionally, the filipodia induced after GML treatment were shorter in the presence of SMIFH2 than in its absence. These data suggest that the filopodia formed after GML treatment are driven by the function of formins.
Figure 3. GML-induced filopodia form due to Arp2/3 complex dysfunction and not microtubule or formin inhibition.
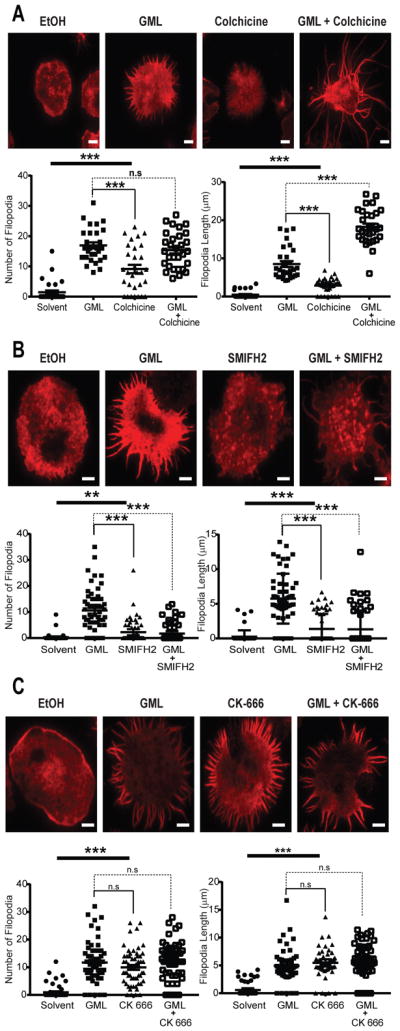
(A to C) TIRF microscopy of activated T cells that were restimulated with anti-CD3 in the presence of ethanol or GML, with or without the indicated small-molecule inhibitors, and stained with TMR-conjugated phalloidin. (A) To disrupt microtubules, cells were treated with 100 μM colchine. (B) To disrupt formin activity, cells were treated with 10 μM SMIFH2. (C) To disrupt the Arp2/3 complex, cells were treated with 10μM CK-666. Top: Images are representative of 3 independent experiments. Bottom: The number and length of filipodia per cell are means ± SEM of 60 cells. Scale bar, 4 μm. * denotes p<0.05 and *** denotes p<0.001 by one-way ANOVA with Tukey’s multiple comparisons test.
GML stimulates formation of filopodia structures through Arp2/3 complex dysfunction
The polarized filopodia structures formed after GML treatment are phenotypically similar to structures found in Arp2- and Arp3-deficient T cells or T cells treated with Arp2/3 inhibitors (8, 9). To determine whether GML induced filopodia formation by inhibiting Arp2/3 complex activity, we used the small molecule inhibitor CK-666, which stabilizes the inactive state of the Arp2/3 complex by preventing the Arp2 and Arp3 subunits from moving into the activated filament-like conformation (47). In contrast to inhibitors of microtubules and formins, CK-666 stimulated formation of filopodia that were similar in appearance, number, and length to those observed in GML-treated T cells (Fig. 3C). Furthermore, activated T cells treated with both CK-666 and GML developed filopodia structures that were unchanged as compared to those in T cells treated with CK-666 or GML alone. These data suggest that GML caused Arp2/3 complex dysfunction, which induced the formation of abnormal filopodial structures in activated T cells.
GML does not alter the activation or membrane clustering of the Arp2/3 complex
Because GML appeared to dysregulate Arp2/3 complex function, we examined whether GML affected the activation of Rac1, CDC42, and WASp, key regulatory molecules of Arp2/3 activation. To measure the activation of Rac1 and CDC42, we used agarose beads bound to the activated Rac1- and CDC42-binding domain of human p21-activated kinase 1 protein (48). We found that treatment of T cells with GML did not alter Rac1 or CDC42 activation compared to that in control cells for all times tested (Fig. 4A). Furthermore, we examined whether GML affected the total protein amounts of WASp, Arp2, and ARPC3, as well as the TCR-stimulated phosphorylation of WASp by Western blotting. We found that GML did not alter the total amounts of these proteins nor did it affect the phosphorylation of WASp at Tyr290 (Fig. 4B and C). These data suggest that GML does not substantially alter the amounts or the activation of Arp2/3 complex regulatory molecules.
Figure 4. GML does not affect regulatory molecules involved in Arp2/3 complex activation.
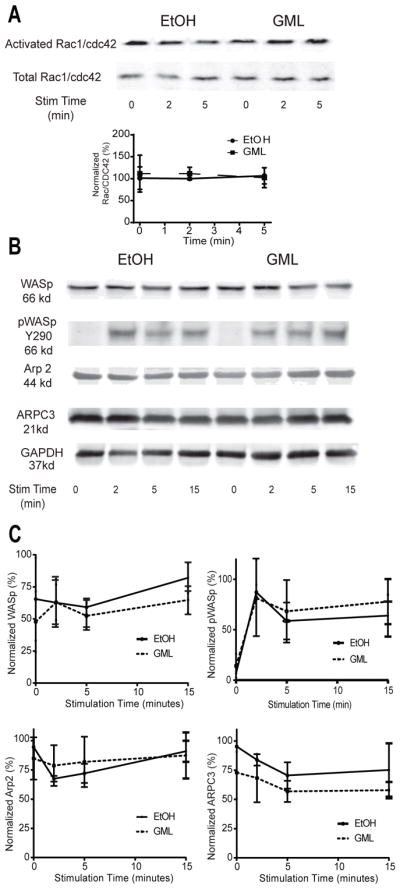
(A) Western blotting analysis of active GTP-bound Rac1 and CDC42 was performed at the indicated times after restimulation of activated T cells in the presence of ethanol or GML. Top: Blots are representative of 3 independent experiments. Bottom: Normalized band intensity data are means ± SEM. (B and C) Western blotting analysis of total WASp, Arp2, ARPC3, and phosphorylated WASp Y290 was performed at the indicated times after restimulation of activated T cells treated with GML or ethanol. Blots (B) are representative of 3 independent experiments. Normalized band intensity data (C) are means ± SEM.
TCR activation results in the formation of membrane-localized microclusters that are highly enriched in the signaling adaptor LAT, which associates with the actin nucleation factor WASp (34, 49–51). Because GML reduces the extent of LAT microcluster formation at the membrane (33), we used TIRF microscopy to test whether GML altered the recruitment of WASp and components of the Arp2/3 complex to LAT microclusters. We found that GML did not alter the formation of microclusters of Arp2, phosphorylated WASp, ARPC3, and phosphorylated SLP-76 as compared to that in control cells (Fig. 5). Additionally, no differences in WASp-ARPC3 association were detected by co-immunoprecipitation studies (Fig. 6A).
Figure 5. GML does not affect the clustering of Arp2, WASp, SLP-76, or ARPC3 at the plasma membrane.

(A to D) TIRF microscopy of activated T cells that were restimulated in the presence of ethanol or GML and stained for (A) Arp2, (B) WASp, (C) ARPC3, or (D) SLP-76. Left: Images are representative of 3 independent experiments. Right: Pixel intensity data are means ± SEM of 60 cells. Scale bars, 4 μm.
Figure 6. GML causes altered localization of WASp, SLP-76, and ARPC3 microclusters and decreased colocalization of LAT and SLP-76 microclusters.
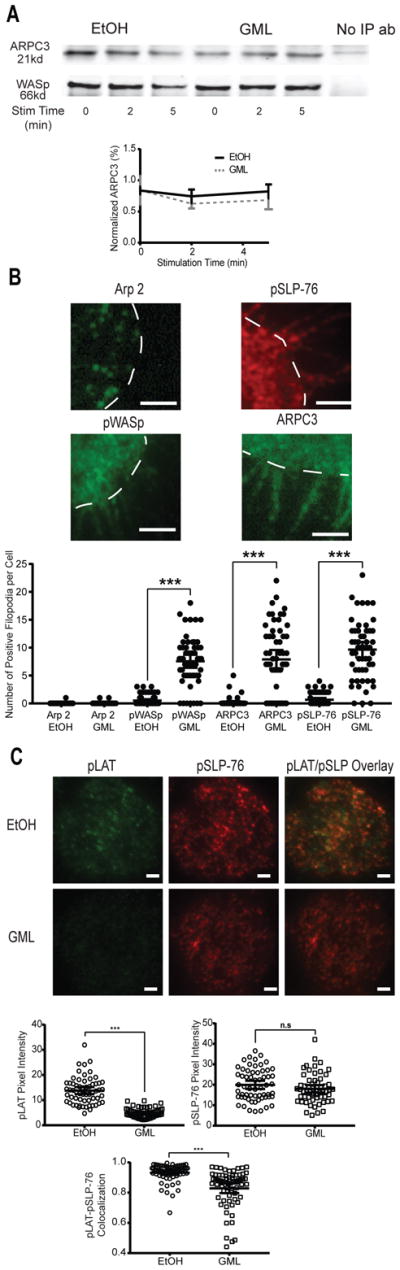
(A) Co-immunoprecipitation analysis of WASp and ARPC3 was performed at the indicated times after stimulation of activated T cells in the presence of ethanol or GML. Top: Western blots are representative of 4 independent experiments. Bottom: Normalized band intensity data are means ± SEM. (B) TIRF microscopy of activated T cells that were restimulated in the presence of ethanol or GML and stained for Arp2, WASp, SLP-76, and ARPC3. Top: Images are representative of GML-treated T cells from 3 independent experiments. White dashed lines outline the cell periphery. Bottom: Number of fluorescent filopodia. Data are means ± SEM of 60 cells. *** denotes p<0.001 by one-way ANOVA with Tukey’s multiple comparisons test. Scale bars, 2 μm. (C) TIRF microscopy of activated T cells that were restimulated in the presence of ethanol or GML and stained for phosphorylated LAT and phosphorylated SLP-76. Top: Images are representative of 2 independent experiments. Bottom: Pixel intensity and co-localization data are means ± SEM of 60 cells. Scale bars, 4 μm. *** indicates p<0.001 by unpaired t test with Welch’s correction.
GML causes defective localization of WASp, ARPC3, and SLP-76 by preventing the colocalization of LAT and SLP-76 microclusters
Although our earlier results showed that all components of the Arp2/3 complex clustered at the plasma membrane after T cell activation regardless of treatment, we noted that the membrane and filopodia microclustering patterns of WASp, ARPC3, and SLP-76 were different from that of Arp2 (Fig. 5). To further investigate these differences, we analyzed the localization of Arp2, WASp, ARPC3, and SLP-76 in greater detail in GML-treated T cells using TIRF microscopy. We found that whereas Arp2 was only present within the contours of the cell border, phosphorylated WASP, ARPC3, and phosphorylated SLP-76 were positively stained in the filopodial structures induced by GML (Fig 6B, top). We quantified this phenomenon by counting the number of fluorescently positive filopodial structures per T cell in control and GML-treated cells. Quantitation of Arp2-stained cells confirmed the minimal localization of this protein within filopodia regardless of treatment. However, WASp, ARPC3, and SLP-76 exhibited significantly increased localization to filopodia only after GML treatment (Fig. 6B, bottom). These data suggest that GML alters the localization of WASp, ARPC3, and SLP-76, but not Arp2, in activated T cells.
WASp and ARPC3 are downstream of SLP-76-mediated signaling (34, 52). To determine whether GML altered the localization of WASp and ARPC3 in activated T cells by abrogating the association of upstream signaling microclusters, we analyzed the localization of phosphorylated SLP-76 and phosphorylated LAT by TIRF microscopy. Consistent with our previous study (33), we observed that the treatment of T cells with GML suppressed the formation of phosphorylated LAT microclusters but not phosphorylated SLP-76 microclusters (Fig. 6C), which also exhibited reduced co-localization with pSLP-76 microclusters. Therefore, GML may also disturb the interaction between LAT microclusters and SLP-76 microclusters.
GML does not prevent the association of WASp and WAVE2 with LAT-independent SLP-76 microclusters
SLP-76 microclusters can form independently of LAT microclusters (53). Because WASp and WAVE proteins are integral signaling activators of the Arp2/3 complex (15), we hypothesized that LAT-independent SLP-76 microclusters associated with WASp and WAVE. Using TIRF microscopy, we found that GML did not affect the association between phosphorylated SLP-76 microclusters and phosphorylated WASp microclusters in activated T cells (Fig. 7A) or between phosphorylated SLP-76 microclusters and phosphorylated WAVE2 microclusters (Fig. 7B). We also found that similar to phosphorylated WASp microclusters, pWAVE2 microclusters were localized within filopodia in GML-treated T cells (Fig. 7C). These data suggest that GML may decrease the association between SLP-76 microclusters with LAT microclusters, but spare their association with WASp and WAVE2.
Figure 7. GML does not alter SLP-76 microcluster association with WASp or WAVE2.
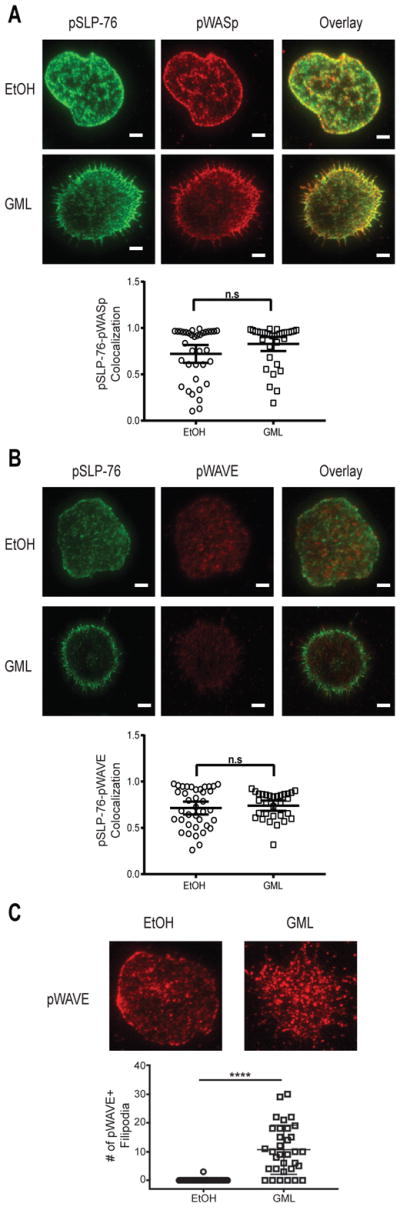
(A) TIRF microscopy of activated T cells that were restimulated in the presence of ethanol or GML and stained for phosphorylated WASp and phosphorylated SLP-76. Top: Images are representative of from 2 donors. Bottom: Co-localization data are means ± SEM of 60 cells. Scale bars, 4 μm. (B) TIRF microscopy of activated T cells that were restimulated in the presence of ethanol or GML and stained for phosphorylated WAVE and phosphorylated SLP-76. Top: Images are representative of 2 independent experiments. Scale bars, 4μm. Bottom: Co-localization data are means ± SEM of 30 cells. (C) TIRF microscopy of activated T cells that were restimulated in the presence of ethanol or GML and stained for phosphorylated WAVE. Images are representative of 2 independent experiments. Bottom: Number of filapodia. Data are means ± SEM of 30 cells. **** denotes p<0.0001 by unpaired t test with Welch’s correction.
Discussion
Our data suggest that aberrant filopodia formation after treatment of activated T cells with GML may result from dysregulation of LAT and SLP-76 microclusters. In unstimulated cells, LAT is organized in nanocluster-scale units that are composed of 5 molecules or less. After TCR activation, these proteins oligomerize into microcluster-scale units that are composed of >25 molecules (49–51, 53–55). However, there is a disconnect between SLP-76- and LAT-mediated signaling. Inhibition of actin polymerization by Latrunculin A substantially inhibits LAT clustering, but not SLP-76 clustering (53). Additionally, T cells deficient in Gads, an adaptor protein that canonically links SLP-76 to LAT, exhibit suppressed PLC-γ1-mediated responses because of the recruitment of PLC-γ1 to LAT microclusters (56), but no defect in SLP-76 phosphorylation or downstream actin polymerization (56). Finally, whereas both TCR stimulation and integrin activation lead to the formation of SLP-76 microclusters, only TCR stimulation results in the formation of LAT microclusters (57). Thus, SLP-76 clusters exist in two populations, those that are recruited to LAT microclusters and those that are not.
The LAT-dependent and LAT-independent SLP-76 clusters have distinct functions. LAT independent SLP-76 clusters can activate WASp through the canonical signaling pathway involving Nck, Vav, Rac1, and CDC42 (52). In support of this, we found that GML-treated T cells did not have altered Rac1 or CDC42 activation (Fig. 4A), Arp2, WASp, WAVE2, ARPC3, or SLP-76 microcluster formation (Fig. 5 and Fig. 7) (33), or ARPC3-WASp association (Fig 6A). In contrast, LAT-dependent SLP-76 clusters have a direct role in activating the Arp2/3 complex and actin polymerization. After TCR engagement, WASp and WAVE2 are rapidly recruited to the LAT signaling complex (14, 58), although they disassociate to form separate structures after longer stimulation times (14). The association of WASp, WAVE2, and SLP-76 with LAT may be important for coordinating the correct spatial context to initiate the actin polymerization necessary for dSMAC and pSMAC formation. Under normal conditions, LAT microclusters are associated with SLP-76 microclusters after TCR activation. This leads to the canonical activation of WASp, WAVE2, and the Arp2/3 complex, actin polymerization, lamellipodia formation, and cellular adhesion (Fig. S2A). Indeed, we found that GML disrupted the formation of LAT microclusters, which suggests that LAT-independent SLP-76 microclusters are the predominant type of SLP-76 microcluster. Our data imply that LAT-independent SLP-76 microclusters may drive the altered localization of WASp, WAVE2 and the ARPC3 subunit of the Arp2/3 complex. Additionally, the reduced association of the ARPC3 and Arp2 subunits likely contributed to Arp2/3 complex dysfunction and stimulated filopodia formation (Fig. S2B).
The Arp2/3 complex is composed of the actin-like subunits Arp2 and Arp3 with five additional subunits, ARPC1 to ARPC5, which mediate actin branching by nucleating new actin filaments (59). Arp2 and Arp3 associate with the pointed end of the newly polymerizing actin filament, whereas ARPC2 and ARPC4 are important subunits that interact with the parental filament; the other subunits, ARPC1, ARPC3, and ARPC5 have regulatory roles (60, 61). In particular, the ARPC3 subunit regulates the actin nucleation activity of the complex. ARPC3 is implicated in crosstalk between the Arp2/3 complex and nucleation-promotion factors, such as WASp and WAVE2 (62–64). Furthermore, a purified recombinant Arp2/3 complex that lacks ARPC3 nucleates actin filaments at a considerably slower rate than does the full Arp2/3 complex (65). We observed that although GML-treated T cells had intact Rac1, CDC42, and WASp activation, they exhibited the mislocalization of ARPC3 from Arp2. These data support the model that ARPC3 is critical for Arp2/3 complex activity. Furthermore, our data imply that ARPC3 may be an important signaling intermediate between WASp and the Arp2/3 complex, and that lack of proper ARPC3 localization could result in defective Arp2/3 complex function. Additionally, decreased Arp2/3 complex formation may increase the activation of the formins that are necessary for the formation of the actin cytoskeleton (9). In support of this, we found that formin inhibition decreased the GML-induced formation of filopodial structures in T cells (Fig. 3B).
Overall, our observations shed light on how GML suppresses T cells and provide insight into the therapeutic applications of GML. Whereas GML reduces T cell function by disturbing ordered lipid microdomains in the plasma membrane (33) and altering actin polymerization, these pathways likely synergize to inhibit cytokine production. Impairment of T cell activation by GML warrants the further investigation of GML as an immunosuppressant. However, the T cell suppressive property of GML is likely limited to topical applications because of the strong binding affinity of albumin that renders GML biologically inactive in the circulation (66). Topical GML formulations could suppress T cell responses and ameliorate skin diseases, such as eczema and psoriasis, whereas oral ingestion of GML may reduce gut inflammation in Crohn’s disease and ulcerative colitis. Additionally, GML incorporated into tampons or prophylactics could inhibit pathological T cell activation at the vaginal mucosal site and suppress chemokine receptor proteins that are important for HIV viral entry. In these mucosal sites, only doses greater than 20 μg/ml retain biological activity and are able to suppress T cell function (66). Because we did not use media containing albumin in our experiments, we found that GML exerted its effects at doses less than 20 μg/ml, which is consistent with other published work describing its effects (24, 33). These concentrations are achievable in a clinical setting. Vaginal treatment with 5 mg/mL GML in an ethanol gel resulted in a two-log decrease in the counts of Candida species (25), equivalent to the growth reduction achieved in vitro with GML at a concentration of 100 μg/mL (25). Finally, the antibiotic properties of GML synergize with its T cell suppressive properties to treat both the pathogen and host aspects of infectious disease pathology. For example, GML inhibits both Staphylococcal virulence and the T cell-mediated cytokine storm in menstrual-associated toxic shock syndrome. Together, our data suggest that GML could be used as an immunosuppressive agent for T cell functions, which disturbs both actin cytoskeletal rearrangement and plasma membrane lipid-mediated signaling after TCR activation.
Materials and Methods
Primary human T cell isolation and GML preparation
Whole blood was obtained from de-identified healthy donors at the DeGowin Blood Center at the University of Iowa Hospitals and Clinics. The recruitment protocol and written informed consent document were approved by the Institutional Review Board for the University of Iowa. PBMCs were isolated from leukocyte reduction system (LRS) cones using Hypaque-Ficoll density-gradient separation as previously described (33). T cells were then expanded and activated with anti-CD3- and anti-CD28-coated beads (Invitrogen) and human IL-2 for 5 days. Cells were then re-suspended in fresh medium without stimulatory beads or IL-2 for 24 hours. Activated T cells were resuspended in serum-free RPMI 1640 before GML treatment. GML was solubilized at room temperature in 95% ethanol and diluted into the appropriate working concentration. We added 95% ethanol as a comparative vehicle control at final concentrations that did not exceed 0.5%. Activated T cells were treated with ethanol or various doses of GML in serum-free medium for various assays.
Plate-bound adhesion assay
The plate-bound adhesion assay were performed as previously described (37). In brief, RIA/EIA plates were coated overnight at 4°C with anti-CD3 antibodies diluted in PBS. The plates were washed three times with PBS and blocked with 1% BSA in PBS for 2 hours at 37°C. Activated T cells were stained with the Licor CellVue Burgundy kit (Licor), treated with GML or ethanol, and added to the wells of the blocked anti-CD3-coated plates for 15 min. Nonadherent cells were washed off and adherent cells were imaged using the Licor Odyssey Infrared Imager.
Western blotting
Activated T cells were treated with GML (10 μg/ml) or ethanol (0.1%) control, and then incubated on ice with anti-CD3 and anti-CD4 antibodies for 20 min. Cells were then incubated at 37°C for 10 min and stimulated with IgG crosslinking antibody for various times. Both anti-CD3 and anti-CD4 antibodies were used because detectable TCR-mediated signaling is optimally detectable using both anti-CD3 and anti-CD4 antibodies and not anti-CD3 antibody alone (67). Cells were then lysed with 2X sample buffer, heated to 95°C, and sonicated. Cell lysates were analyzed by Western blotting and imaged using Licor Odyssey (Lincoln, NE, USA). The following antibodies were used: Src family kinases Lck and Fyn pY416 (Cell Signaling), Pyk2 pY402 (Life Technologies), Fak pY397 (Cell Signaling), Paxillin pY31 (Life Technologies), WASp (Santa Cruz), WASp pY290 (Invitrogen), Arp2 (Cell Signaling), ARPC3 (Millipore), and GAPDH (Meridian Life Sciences). IRDye 800CW or IRDye680-conjugated secondary antibodies were used (Licor). Western blot band intensity was quantified using Odyssey’s v3.0 software and the abundances of phosphorylated forms of proteins were normalized to that of GAPDH. To minimize variability between human donors, band intensities were further normalized to band intensity of the two-minute timepoint for the ethanol treatment.
Immunoprecipitation and Rac1/CDC42 activation assay
Activated T cells were treated and stimulated as described earlier. The cells were then lysed with immunoprecipitation buffer [25mM Tris (pH 8.0), 150 mM NaCl, 1% Brij-97, 0.5% n-Octyl-β-D-glucopyranoside, 5 mM EDTA, 1 mM Na3VO4, and complete protease inhibitor tablets] and pre-cleared with protein A/G plus agarose (Santa Cruz). For WASp immunoprecipitation experiments, the lysates were incubated with protein A/G plus agarose with or without the WASp antibody (Santa Cruz) overnight at 4°C. In Rac1/CDC42 activation experiments, lysates were incubated with PAK-PBD glutathione-conjugated agarose beads (Cytoskeleton) overnight at 4°C. The samples were washed, eluted, and the bound proteins were detected by Western blotting. Band intensity was quantified using Odyssey’s v3.0 software. To minimize variability between human donors, band intensities were further normalized to the band intensity of the two-minute timepoint for the ethanol treatment.
Total Internal reflection fluorescence (TIRF) and epifluorescence microscopy
Activated T cells were stimulated in the presence of ethanol or GML with plate-bound anti-CD3 on glass coverslips for 15 min. In experiments with inhibitors of cytoskeletal processes, 100 μM Colchine (Cayman Chemicals), 10 μM SMIFH2 (Calbiochem), or 10 μM CK-666 (Calbiochem) solubilized in DMSO were added to the activated T cells at the same time as the GML or solvent. Cells were fixed with 4% paraformaldehyde for 30 min, permeabilized with 0.25% Triton-X for 5 min, and then stained with the appropriate reagents. To detect actin, TMR-Phalloidin (Sigma) was incubated with the fixed and permeabilized cells for 2 hours at 37°C. To detect microcluster formation of signaling proteins, cells were stained with antibodies specific for Arp2 (Cell Signaling), WAVE2 (Cell Signaling), phosphorylated WASp Y290 (Invitrogen), ARPC3 (Millipore), phosphorylated SLP-76 Y128 (BD Pharmingen), and phosphorylated LAT Y191 (Millipore). Staining was detected with the conjugated secondary antibodies DyLight 488 Goat anti-rabbit IgG or Alexa Fluor 568 goat anti-mouse IgG1 (Thermo Fisher). TIRF images were captured by the Leica AM TIRF MC system using a 100x magnification oil immersion objective lens at the University of Iowa Central Microscopy Research Facility. Actin ring structures were imaged using the same microscope using the epifluorescence channels.
Image quantification
Microscopy images were processed and analyzed with ImageJ software. Quantification of membrane clustering was performed by measuring the mean pixel intensity in the longest axis of cells. Quantification of filopodial structures was performed by measuring the length of the longest protruding filopodium per cell and counting the number of filopodial structures that were longer than 2 μm per cell. Quantification of actin ring structures was performed with the Plot Profile tool in ImageJ to obtain pixel intensity values along the long cell axis. Quantification of WASp-, Arp2-, or ARPC3-positive filopodial structures was performed by counting the number of filopodial structures that were longer than 2 μm per cell. Pixel co-localization analysis was performed with the Coloc 2 plugin in ImageJ. The Manders Correlation coefficient was determined using this method and plotted.
Statistical analysis
Statistical analysis was performed with GraphPad Prism using statistical tests appropriate for the experimental data. The individual tests used for each analysis are described in the figure legends. All statistical analysis of Western blotting data was performed with paired analysis. All statistical analysis was performed in consultation with the Biostatistics Core Facility in the Holden Comprehensive Cancer Center at the University of Iowa.
Supplementary Material
Fig. S1. Time-course of GML-induced filopodia formation.
Fig. S2. Model depicting the effects of GML on T cell adhesion.
Acknowledgments
We thank Tom Moninger (University of Iowa) for help with TIRF microscopy. We thank Dr. Patrick Schlievert for project inspiration and providing reagents. We thank Aline Sandouk for critical review of manuscript and intellectual contributions.
Funding: This work was supported by grants from NIH (R01 CA136729 to JCDH, and T32 GM007337 to MSZ and internal funding from the University of Iowa.
Footnotes
Author contributions: M.S.Z. designed the experiments, performed the work, analyzed the data, and wrote the manuscript. P.M.T., A.J.W., M.M.T., and M.F. designed the experiments, performed the work, and analyzed the data. J.C.D.H. designed the experiments, analyzed the data, and wrote the manuscript.
Competing interests: The authors declare that they have no competing interests.
Data and materials availability: All data needed to evaluate the conclusions in the paper are present in the paper or the Supplementary Materials.
References and Notes
- 1.Comrie WA, Burkhardt JK. Action and Traction: Cytoskeletal Control of Receptor Triggering at the Immunological Synapse. Frontiers in immunology. 2016;7:68. doi: 10.3389/fimmu.2016.00068. [DOI] [PMC free article] [PubMed] [Google Scholar]
- 2.Yu Y, Smoligovets AA, Groves JT. Modulation of T cell signaling by the actin cytoskeleton. J Cell Sci. 2013;126:1049–1058. doi: 10.1242/jcs.098210. [DOI] [PubMed] [Google Scholar]
- 3.Kumari S, Curado S, Mayya V, Dustin ML. T cell antigen receptor activation and actin cytoskeleton remodeling. Biochimica et biophysica acta. 2014;1838:546–556. doi: 10.1016/j.bbamem.2013.05.004. [DOI] [PMC free article] [PubMed] [Google Scholar]
- 4.Yi J, Wu XS, Crites T, Hammer JA., 3rd Actin retrograde flow and actomyosin II arc contraction drive receptor cluster dynamics at the immunological synapse in Jurkat T cells. Molecular biology of the cell. 2012;23:834–852. doi: 10.1091/mbc.E11-08-0731. [DOI] [PMC free article] [PubMed] [Google Scholar]
- 5.Suarez C, Carroll RT, Burke TA, Christensen JR, Bestul AJ, Sees JA, James ML, Sirotkin V, Kovar DR. Profilin regulates F-actin network homeostasis by favoring formin over Arp2/3 complex. Developmental cell. 2015;32:43–53. doi: 10.1016/j.devcel.2014.10.027. [DOI] [PMC free article] [PubMed] [Google Scholar]
- 6.Rotty JD, Wu C, Haynes EM, Suarez C, Winkelman JD, Johnson HE, Haugh JM, Kovar DR, Bear JE. Profilin-1 serves as a gatekeeper for actin assembly by Arp2/3-dependent and -independent pathways. Developmental cell. 2015;32:54–67. doi: 10.1016/j.devcel.2014.10.026. [DOI] [PMC free article] [PubMed] [Google Scholar]
- 7.Bogdan S, Schultz J, Grosshans J. Formin’ cellular structures: Physiological roles of Diaphanous (Dia) in actin dynamics. Communicative & integrative biology. 2013;6:e27634. doi: 10.4161/cib.27634. [DOI] [PMC free article] [PubMed] [Google Scholar]
- 8.Gomez TS, Kumar K, Medeiros RB, Shimizu Y, Leibson PJ, Billadeau DD. Formins regulate the actin-related protein 2/3 complex-independent polarization of the centrosome to the immunological synapse. Immunity. 2007;26:177–190. doi: 10.1016/j.immuni.2007.01.008. [DOI] [PMC free article] [PubMed] [Google Scholar]
- 9.Murugesan S, Hong J, Yi J, Li D, Beach JR, Shao L, Meinhardt J, Madison G, Wu X, Betzig E, Hammer JA. Formin-generated actomyosin arcs propel T cell receptor microcluster movement at the immune synapse. J Cell Biol. 2016;215:383–399. doi: 10.1083/jcb.201603080. [DOI] [PMC free article] [PubMed] [Google Scholar]
- 10.Billadeau DD, Nolz JC, Gomez TS. Regulation of T-cell activation by the cytoskeleton. Nature reviews Immunology. 2007;7:131–143. doi: 10.1038/nri2021. [DOI] [PubMed] [Google Scholar]
- 11.Zhang J, Shehabeldin A, da Cruz LA, Butler J, Somani AK, McGavin M, Kozieradzki I, dos Santos AO, Nagy A, Grinstein S, Penninger JM, Siminovitch KA. Antigen receptor-induced activation and cytoskeletal rearrangement are impaired in Wiskott-Aldrich syndrome protein-deficient lymphocytes. J Exp Med. 1999;190:1329–1342. doi: 10.1084/jem.190.9.1329. [DOI] [PMC free article] [PubMed] [Google Scholar]
- 12.Rotty JD, Wu C, Bear JE. New insights into the regulation and cellular functions of the ARP2/3 complex. Nature reviews Molecular cell biology. 2013;14:7–12. doi: 10.1038/nrm3492. [DOI] [PubMed] [Google Scholar]
- 13.Nolz JC, Gomez TS, Zhu P, Li S, Medeiros RB, Shimizu Y, Burkhardt JK, Freedman BD, Billadeau DD. The WAVE2 complex regulates actin cytoskeletal reorganization and CRAC-mediated calcium entry during T cell activation. Curr Biol. 2006;16:24–34. doi: 10.1016/j.cub.2005.11.036. [DOI] [PMC free article] [PubMed] [Google Scholar]
- 14.Pauker MH, Reicher B, Joseph N, Wortzel I, Jakubowicz S, Noy E, Perl O, Barda-Saad M. WASp family verprolin-homologous protein-2 (WAVE2) and Wiskott-Aldrich syndrome protein (WASp) engage in distinct downstream signaling interactions at the T cell antigen receptor site. J Biol Chem. 2014;289:34503–34519. doi: 10.1074/jbc.M114.591685. [DOI] [PMC free article] [PubMed] [Google Scholar]
- 15.Alekhina O, Burstein E, Billadeau DD. Cellular functions of WASP family proteins at a glance. J Cell Sci. 2017 doi: 10.1242/jcs.199570. [DOI] [PMC free article] [PubMed] [Google Scholar]
- 16.Kumari S, Depoil D, Martinelli R, Judokusumo E, Carmona G, Gertler FB, Kam LC, Carman CV, Burkhardt JK, Irvine DJ, Dustin ML. Actin foci facilitate activation of the phospholipase C-gamma in primary T lymphocytes via the WASP pathway. eLife. 2015;4 doi: 10.7554/eLife.04953. [DOI] [PMC free article] [PubMed] [Google Scholar]
- 17.Becart S, Altman A. SWAP-70-like adapter of T cells: a novel Lck-regulated guanine nucleotide exchange factor coordinating actin cytoskeleton reorganization and Ca2+ signaling in T cells. Immunol Rev. 2009;232:319–333. doi: 10.1111/j.1600-065X.2009.00839.x. [DOI] [PMC free article] [PubMed] [Google Scholar]
- 18.Missy K, Hu B, Schilling K, Harenberg A, Sakk V, Kuchenbecker K, Kutsche K, Fischer KD. AlphaPIX Rho GTPase guanine nucleotide exchange factor regulates lymphocyte functions and antigen receptor signaling. Mol Cell Biol. 2008;28:3776–3789. doi: 10.1128/MCB.00507-07. [DOI] [PMC free article] [PubMed] [Google Scholar]
- 19.Schlievert PM, Deringer JR, Kim MH, Projan SJ, Novick RP. Effect of glycerol monolaurate on bacterial growth and toxin production. Antimicrobial agents and chemotherapy. 1992;36:626–631. doi: 10.1128/aac.36.3.626. [DOI] [PMC free article] [PubMed] [Google Scholar]
- 20.21.CFR.184.1505, in Code of Federal Regulations. (2010).
- 21.U. E. Hoppe, Ulrich; Sauermann, Gerhard; Engel, Walter; Pape, Wolfgang. (Beiersdorf Aktiengesellschaft, United States 20. Apr. 1999), vol. 4921694, chap. US5895643 A.
- 22.Blaszyk M, Holley RA. Interaction of monolaurin, eugenol and sodium citrate on growth of common meat spoilage and pathogenic organisms. International journal of food microbiology. 1998;39:175–183. doi: 10.1016/s0168-1605(97)00134-7. [DOI] [PubMed] [Google Scholar]
- 23.Projan SJ, Brown-Skrobot S, Schlievert PM, Vandenesch F, Novick RP. Glycerol monolaurate inhibits the production of beta-lactamase, toxic shock toxin-1, and other staphylococcal exoproteins by interfering with signal transduction. Journal of bacteriology. 1994;176:4204–4209. doi: 10.1128/jb.176.14.4204-4209.1994. [DOI] [PMC free article] [PubMed] [Google Scholar]
- 24.Schlievert PM, Peterson ML. Glycerol monolaurate antibacterial activity in broth and biofilm cultures. PLoS One. 2012;7:e40350. doi: 10.1371/journal.pone.0040350. [DOI] [PMC free article] [PubMed] [Google Scholar]
- 25.Strandberg KL, Peterson ML, Lin YC, Pack MC, Chase DJ, Schlievert PM. Glycerol monolaurate inhibits Candida and Gardnerella vaginalis in vitro and in vivo but not Lactobacillus. Antimicrobial agents and chemotherapy. 2010;54:597–601. doi: 10.1128/AAC.01151-09. [DOI] [PMC free article] [PubMed] [Google Scholar]
- 26.Clarke NM, May JT. Effect of antimicrobial factors in human milk on rhinoviruses and milk-borne cytomegalovirus in vitro. Journal of medical microbiology. 2000;49:719–723. doi: 10.1099/0022-1317-49-8-719. [DOI] [PubMed] [Google Scholar]
- 27.Li Q, Estes JD, Schlievert PM, Duan L, Brosnahan AJ, Southern PJ, Reilly CS, Peterson ML, Schultz-Darken N, Brunner KG, Nephew KR, Pambuccian S, Lifson JD, Carlis JV, Haase AT. Glycerol monolaurate prevents mucosal SIV transmission. Nature. 2009;458:1034–1038. doi: 10.1038/nature07831. [DOI] [PMC free article] [PubMed] [Google Scholar]
- 28.Haase AT, Rakasz E, Schultz-Darken N, Nephew K, Weisgrau KL, Reilly CS, Li Q, Southern PJ, Rothenberger M, Peterson ML, Schlievert PM. Glycerol Monolaurate Microbicide Protection against Repeat High-Dose SIV Vaginal Challenge. PLoS One. 2015;10:e0129465. doi: 10.1371/journal.pone.0129465. [DOI] [PMC free article] [PubMed] [Google Scholar]
- 29.Strandberg KL, Peterson ML, Schaefers MM, Case LC, Pack MC, Chase DJ, Schlievert PM. Reduction in Staphylococcus aureus growth and exotoxin production and in vaginal interleukin 8 levels due to glycerol monolaurate in tampons. Clinical infectious diseases: an official publication of the Infectious Diseases Society of America. 2009;49:1711–1717. doi: 10.1086/644614. [DOI] [PubMed] [Google Scholar]
- 30.Mueller EA, Schlievert PM. Non-aqueous glycerol monolaurate gel exhibits antibacterial and anti-biofilm activity against Gram-positive and Gram-negative pathogens. PLoS One. 2015;10:e0120280. doi: 10.1371/journal.pone.0120280. [DOI] [PMC free article] [PubMed] [Google Scholar]
- 31.Witcher KJ, Novick RP, Schlievert PM. Modulation of immune cell proliferation by glycerol monolaurate. Clinical and diagnostic laboratory immunology. 1996;3:10–13. doi: 10.1128/cdli.3.1.10-13.1996. [DOI] [PMC free article] [PubMed] [Google Scholar]
- 32.Peterson ML, Schlievert PM. Glycerol monolaurate inhibits the effects of Gram-positive select agents on eukaryotic cells. Biochemistry. 2006;45:2387–2397. doi: 10.1021/bi051992u. [DOI] [PMC free article] [PubMed] [Google Scholar]
- 33.Zhang MS, Sandouk A, Houtman JC. Glycerol Monolaurate (GML) inhibits human T cell signaling and function by disrupting lipid dynamics. Scientific reports. 2016;6:30225. doi: 10.1038/srep30225. [DOI] [PMC free article] [PubMed] [Google Scholar]
- 34.Barda-Saad M, Braiman A, Titerence R, Bunnell SC, Barr VA, Samelson LE. Dynamic molecular interactions linking the T cell antigen receptor to the actin cytoskeleton. Nat Immunol. 2005;6:80–89. doi: 10.1038/ni1143. [DOI] [PubMed] [Google Scholar]
- 35.Dinic J, Riehl A, Adler J, Parmryd I. The T cell receptor resides in ordered plasma membrane nanodomains that aggregate upon patching of the receptor. Scientific reports. 2015;5:10082. doi: 10.1038/srep10082. [DOI] [PMC free article] [PubMed] [Google Scholar]
- 36.Harder T, Simons K. Clusters of glycolipid and glycosylphosphatidylinositol-anchored proteins in lymphoid cells: accumulation of actin regulated by local tyrosine phosphorylation. Eur J Immunol. 1999;29:556–562. doi: 10.1002/(SICI)1521-4141(199902)29:02<556::AID-IMMU556>3.0.CO;2-2. [DOI] [PubMed] [Google Scholar]
- 37.Chapman NM, Yoder AN, Houtman JC. Non-catalytic functions of Pyk2 and Fyn regulate late stage adhesion in human T cells. PLoS One. 2012;7:e53011. doi: 10.1371/journal.pone.0053011. [DOI] [PMC free article] [PubMed] [Google Scholar]
- 38.Bunnell SC, Kapoor V, Trible RP, Zhang W, Samelson LE. Dynamic actin polymerization drives T cell receptor-induced spreading: a role for the signal transduction adaptor LAT. Immunity. 2001;14:315–329. doi: 10.1016/s1074-7613(01)00112-1. [DOI] [PubMed] [Google Scholar]
- 39.Chapman NM, Houtman JC. Functions of the FAK family kinases in T cells: beyond actin cytoskeletal rearrangement. Immunol Res. 2014;59:23–34. doi: 10.1007/s12026-014-8527-y. [DOI] [PMC free article] [PubMed] [Google Scholar]
- 40.Ostergaard HL, Lysechko TL. Focal adhesion kinase-related protein tyrosine kinase Pyk2 in T-cell activation and function. Immunol Res. 2005;31:267–282. doi: 10.1385/IR:31:3:267. [DOI] [PubMed] [Google Scholar]
- 41.Schaller MD. Cellular functions of FAK kinases: insight into molecular mechanisms and novel functions. J Cell Sci. 2010;123:1007–1013. doi: 10.1242/jcs.045112. [DOI] [PubMed] [Google Scholar]
- 42.Faix J, Breitsprecher D, Stradal TE, Rottner K. Filopodia: Complex models for simple rods. Int J Biochem Cell Biol. 2009;41:1656–1664. doi: 10.1016/j.biocel.2009.02.012. [DOI] [PubMed] [Google Scholar]
- 43.Hashimoto-Tane A, Saito T. Dynamic Regulation of TCR-Microclusters and the Microsynapse for T Cell Activation. Frontiers in immunology. 2016;7:255. doi: 10.3389/fimmu.2016.00255. [DOI] [PMC free article] [PubMed] [Google Scholar]
- 44.Hong JH, Kwak Y, Woo Y, Park C, Lee SA, Lee H, Park SJ, Suh Y, Suh BK, Goo BS, Mun DJ, Sanada K, Nguyen MD, Park SK. Regulation of the actin cytoskeleton by the Ndel1-Tara complex is critical for cell migration. Scientific reports. 2016;6:31827. doi: 10.1038/srep31827. [DOI] [PMC free article] [PubMed] [Google Scholar]
- 45.Borisy GG, Taylor EW. The mechanism of action of colchicine. Binding of colchincine-3H to cellular protein. J Cell Biol. 1967;34:525–533. doi: 10.1083/jcb.34.2.525. [DOI] [PMC free article] [PubMed] [Google Scholar]
- 46.Rizvi SA, Neidt EM, Cui J, Feiger Z, Skau CT, Gardel ML, Kozmin SA, Kovar DR. Identification and characterization of a small molecule inhibitor of formin-mediated actin assembly. Chemistry & biology. 2009;16:1158–1168. doi: 10.1016/j.chembiol.2009.10.006. [DOI] [PMC free article] [PubMed] [Google Scholar]
- 47.Hetrick B, Han MS, Helgeson LA, Nolen BJ. Small molecules CK-666 and CK-869 inhibit actin-related protein 2/3 complex by blocking an activating conformational change. Chemistry & biology. 2013;20:701–712. doi: 10.1016/j.chembiol.2013.03.019. [DOI] [PMC free article] [PubMed] [Google Scholar]
- 48.Papadimitriou E, Kardassis D, Moustakas A, Stournaras C. TGFbeta-induced early activation of the small GTPase RhoA is Smad2/3-independent and involves Src and the guanine nucleotide exchange factor Vav2. Cellular physiology and biochemistry: international journal of experimental cellular physiology, biochemistry, and pharmacology. 2011;28:229–238. doi: 10.1159/000331734. [DOI] [PubMed] [Google Scholar]
- 49.Bunnell SC, Hong DI, Kardon JR, Yamazaki T, McGlade CJ, Barr VA, Samelson LE. T cell receptor ligation induces the formation of dynamically regulated signaling assemblies. J Cell Biol. 2002;158:1263–1275. doi: 10.1083/jcb.200203043. [DOI] [PMC free article] [PubMed] [Google Scholar]
- 50.Yokosuka T, Sakata-Sogawa K, Kobayashi W, Hiroshima M, Hashimoto-Tane A, Tokunaga M, Dustin ML, Saito T. Newly generated T cell receptor microclusters initiate and sustain T cell activation by recruitment of Zap70 and SLP-76. Nat Immunol. 2005;6:1253–1262. doi: 10.1038/ni1272. [DOI] [PubMed] [Google Scholar]
- 51.Balagopalan L, Kortum RL, Coussens NP, Barr VA, Samelson LE. The Linker for Activation of T cells (LAT) signaling hub: from signaling complexes to microclusters. J Biol Chem. 2015 doi: 10.1074/jbc.R115.665869. [DOI] [PMC free article] [PubMed] [Google Scholar]
- 52.Zeng R, Cannon JL, Abraham RT, Way M, Billadeau DD, Bubeck-Wardenberg J, Burkhardt JK. SLP-76 coordinates Nck-dependent Wiskott-Aldrich syndrome protein recruitment with Vav-1/Cdc42-dependent Wiskott-Aldrich syndrome protein activation at the T cell-APC contact site. J Immunol. 2003;171:1360–1368. doi: 10.4049/jimmunol.171.3.1360. [DOI] [PubMed] [Google Scholar]
- 53.Sherman E, Barr V, Manley S, Patterson G, Balagopalan L, Akpan I, Regan CK, Merrill RK, Sommers CL, Lippincott-Schwartz J, Samelson LE. Functional nanoscale organization of signaling molecules downstream of the T cell antigen receptor. Immunity. 2011;35:705–720. doi: 10.1016/j.immuni.2011.10.004. [DOI] [PMC free article] [PubMed] [Google Scholar]
- 54.Balagopalan L, Barr VA, Kortum RL, Park AK, Samelson LE. Cutting edge: cell surface linker for activation of T cells is recruited to microclusters and is active in signaling. J Immunol. 2013;190:3849–3853. doi: 10.4049/jimmunol.1202760. [DOI] [PMC free article] [PubMed] [Google Scholar]
- 55.Coussens NP, Hayashi R, Brown PH, Balagopalan L, Balbo A, Akpan I, Houtman JC, Barr VA, Schuck P, Appella E, Samelson LE. Multipoint binding of the SLP-76 SH2 domain to ADAP is critical for oligomerization of SLP-76 signaling complexes in stimulated T cells. Mol Cell Biol. 2013;33:4140–4151. doi: 10.1128/MCB.00410-13. [DOI] [PMC free article] [PubMed] [Google Scholar]
- 56.Bilal MY, Zhang EY, Dinkel B, Hardy D, Yankee TM, Houtman JC. GADS is required for TCR-mediated calcium influx and cytokine release, but not cellular adhesion, in human T cells. Cell Signal. 2015;27:841–850. doi: 10.1016/j.cellsig.2015.01.012. [DOI] [PMC free article] [PubMed] [Google Scholar]
- 57.Baker RG, Hsu CJ, Lee D, Jordan MS, Maltzman JS, Hammer DA, Baumgart T, Koretzky GA. The adapter protein SLP-76 mediates “outside-in” integrin signaling and function in T cells. Mol Cell Biol. 2009;29:5578–5589. doi: 10.1128/MCB.00283-09. [DOI] [PMC free article] [PubMed] [Google Scholar]
- 58.Matalon O, Reicher B, Barda-Saad M. Wiskott-Aldrich syndrome protein--dynamic regulation of actin homeostasis: from activation through function and signal termination in T lymphocytes. Immunol Rev. 2013;256:10–29. doi: 10.1111/imr.12112. [DOI] [PubMed] [Google Scholar]
- 59.Campellone KG, Welch MD. A nucleator arms race: cellular control of actin assembly. Nature reviews Molecular cell biology. 2010;11:237–251. doi: 10.1038/nrm2867. [DOI] [PMC free article] [PubMed] [Google Scholar]
- 60.Beltzner CC, Pollard TD. Identification of functionally important residues of Arp2/3 complex by analysis of homology models from diverse species. Journal of molecular biology. 2004;336:551–565. doi: 10.1016/j.jmb.2003.12.017. [DOI] [PubMed] [Google Scholar]
- 61.Rouiller I, Xu XP, Amann KJ, Egile C, Nickell S, Nicastro D, Li R, Pollard TD, Volkmann N, Hanein D. The structural basis of actin filament branching by the Arp2/3 complex. J Cell Biol. 2008;180:887–895. doi: 10.1083/jcb.200709092. [DOI] [PMC free article] [PubMed] [Google Scholar]
- 62.Zhao X, Yang Z, Qian M, Zhu X. Interactions among subunits of human Arp2/3 complex: p20-Arc as the hub. Biochemical and biophysical research communications. 2001;280:513–517. doi: 10.1006/bbrc.2000.4151. [DOI] [PubMed] [Google Scholar]
- 63.Machesky LM, Insall RH. Scar1 and the related Wiskott-Aldrich syndrome protein, WASP, regulate the actin cytoskeleton through the Arp2/3 complex. Curr Biol. 1998;8:1347–1356. doi: 10.1016/s0960-9822(98)00015-3. [DOI] [PubMed] [Google Scholar]
- 64.Yarar D, To W, Abo A, Welch MD. The Wiskott-Aldrich syndrome protein directs actin-based motility by stimulating actin nucleation with the Arp2/3 complex. Curr Biol. 1999;9:555–558. doi: 10.1016/s0960-9822(99)80243-7. [DOI] [PubMed] [Google Scholar]
- 65.Gournier H, Goley ED, Niederstrasser H, Trinh T, Welch MD. Reconstitution of human Arp2/3 complex reveals critical roles of individual subunits in complex structure and activity. Mol Cell. 2001;8:1041–1052. doi: 10.1016/s1097-2765(01)00393-8. [DOI] [PubMed] [Google Scholar]
- 66.Zhang MS, Houtman JC. Human Serum Albumin (HSA) Suppresses the Effects of Glycerol Monolaurate (GML) on Human T Cell Activation and Function. PLoS One. 2016;11:e0165083. doi: 10.1371/journal.pone.0165083. [DOI] [PMC free article] [PubMed] [Google Scholar]
- 67.Houtman JC, Houghtling RA, Barda-Saad M, Toda Y, Samelson LE. Early phosphorylation kinetics of proteins involved in proximal TCR-mediated signaling pathways. J Immunol. 2005;175:2449–2458. doi: 10.4049/jimmunol.175.4.2449. [DOI] [PMC free article] [PubMed] [Google Scholar]
Associated Data
This section collects any data citations, data availability statements, or supplementary materials included in this article.
Supplementary Materials
Fig. S1. Time-course of GML-induced filopodia formation.
Fig. S2. Model depicting the effects of GML on T cell adhesion.