

Abstract
β‐Catenin in hepatocytes, under the control of Wnts, regulates pericentral gene expression. It also contributes to liver regeneration (LR) after partial hepatectomy (PH) by regulating cyclin‐D1 gene expression as shown in the β‐catenin and Wnt coreceptors low‐density lipoprotein receptor‐related protein 5/6 conditional knockouts (KO). However, conditional deletion of Wntless (Wls), required for Wnt secretion, in hepatocytes, cholangiocytes, or macrophages lacked any impact on zonation, while Wls deletion in macrophages only marginally affected LR. Here, we address the contribution of hepatic endothelial cells (ECs) in zonation and LR by characterizing EC‐Wls‐KO generated by interbreeding Wls‐floxed and lymphatic vessel endothelial hyaluronan receptor (Lyve1)‐cre mice. These mice were also used to study LR after PH. While Lyve1 expression in adult liver is limited to sinusoidal ECs only, Lyve1‐cre mice bred to ROSA26‐Stopflox/flox‐enhanced yellow fluorescent protein (EYFP) mice showed EYFP labeling in sinusoidal and central vein ECs. EC‐Wls‐KO mice showed decreased liver weights; lacked glutamine synthetase, cytochrome P450 2e1, and cytochrome P450 1a2; and were resistant to acetaminophen‐induced liver injury. After PH, EC‐Wls‐KO showed quantitative and qualitative differences in cyclin‐D1 expression at 24‐72 hours, which led to a lower hepatocyte proliferation at 40 hours but a rebound increase by 72 hours. ECs and macrophages isolated from regenerating livers at 12 hours showed significant up‐regulation of Wnt2 and Wnt9b messenger RNA; these are the same two Wnts involved in baseline β‐catenin activity in pericentral hepatocytes. Conclusion: At baseline, ECs secrete Wnt proteins essential for β‐catenin activation in pericentral hepatocytes. During LR, sinusoidal and central vein ECs and secondarily macrophages secrete Wnt2, while predominantly central vein ECs and secondarily macrophages are the likely source of Wnt9b. This process spatiotemporally regulates β‐catenin activation in hepatocytes to induce cell proliferation. (Hepatology Communications 2018;2:845‐860)
Abbreviations
- APAP
acetaminophen
- β‐catenin‐LKO
liver‐specific β‐catenin knockout
- CD
clusters of differentiation
- CON
control
- Cyp
cytochrome P450
- EC
endothelial cell
- EYFP
enhanced yellow fluorescent protein
- Glu
glutamate‐ammonia ligase
- GS
glutamine synthetase
- HBSS
Hank's balanced salt solution
- IP
immunoprecipitation
- KO
knockout
- LR
liver regeneration
- LRP
low‐density lipoprotein receptor‐related protein
- LRP5‐6‐LDKO
liver‐specific dual knockout of low‐density lipoprotein receptor‐related protein 5 and 6
- Lyve‐1
lymphatic vessel endothelial hyaluronan receptor 1
- mRNA
messenger RNA
- NPC
nonparenchymal cell
- PBS
phosphate‐buffered saline
- PCNA
proliferating cell nuclear antigen
- PH
partial hepatectomy
- qPCR
quantitative polymerase chain reaction
- TCF
T‐cell factor
- WB
western blot
- Wls
Wntless
Wnt signaling is critical for normal development and growth of many organs, and its aberrant activation can be causative for diseases, including cancers.1 During canonical signaling, β‐catenin is activated by a Wnt ligand. Wnts are insoluble glycoproteins secreted to act through autocrine or paracrine binding to a Frizzled receptor and low‐density lipoprotein receptor‐related protein 5/6 (LRP5/6) coreceptors. Eventually, the signaling cascade leads to β‐catenin accumulation in the cytoplasm, translocation into the nucleus, and interaction with the T‐cell factor (TCF) family of transcription factors to help transcribe target genes involved in diverse cellular processes.
In liver, the role of β‐catenin is reported in normal development, metabolic zonation, and regeneration (reviewed in Monga2). Mice with liver‐specific β‐catenin knockout (β‐catenin‐LKO) have been instrumental in discerning its many roles in hepatic physiology. These mice showed absence of pericentral gene expression validating pathway target genes, such as glutamine synthetase (GS), cytochrome P450 2E1 (Cyp2e1), and Cyp1a2.3, 4, 5, 6 A follow‐up study showed that dual KO of Wnt coreceptors LRP5 and LRP6 in the liver (LRP5‐6‐LDKO) also led to absent metabolic zonation.7 More recently, endothelial cells (ECs) lining the central vein have been shown to be the primary source of Wnts required for β‐catenin activation in pericentral hepatocytes.8 That study identified Wnt2 and Wnt9b as major determinants of pericentral β‐catenin activation. Additionally, β‐catenin has been shown to play an important role in liver regeneration (LR) after partial hepatectomy (PH), a tightly regulated process requiring precise cellular communication and spatiotemporal signaling.9 β‐Catenin‐LKO has delayed LR until 72 hours.6, 10 This was due to inadequate up‐regulation of β‐catenin target cyclin‐D1, which is critical for the G1‐ to S‐phase transition of hepatocytes.6, 11 Regulation of cyclin‐D1 by β‐catenin during the LR process has been independently validated.12 A similar delay in LR was also evident in LRP5‐6‐LDKO after PH, suggesting β‐catenin to be under Wnt control during regeneration. This also argues that most Wnts in liver physiology are canonical and act through β‐catenin. To address cell source and identification of Wnts and because there are 19 Wnts in the mammalian genome with several expressed in various hepatic cells,13 we used mice that allowed cell‐specific deletion of Wntless (Wls), a cargo receptor essential for all Wnt secretion.14 Conditional deletion of Wls from liver ECs showed no effect on zonation or LR, while its loss from macrophages did not impact zonation but marginally affected hepatocyte proliferation at 40 hours after PH.7 Conditional loss of Wls from all ECs (tyrosine kinase 2 [Tie2]‐Cre) was embryonic lethal and precluded analysis for zonation and LR.7
In the current study, we generated hepatic EC‐specific Wls KO by interbreeding Wlsflox/flox mice and transgenic mice expressing Cre‐recombinase driven by the lymphatic vessel endothelial hyaluronan receptor 1 (Lyve‐1) promoter (Lyve1‐cre).15 EC‐Wls‐KO showed recombination of Wls in sinusoidal and central venous ECs. These mice lacked β‐catenin‐dependent pericentral gene expression and showed defects in LR similar to β‐catenin‐LKO and LRP5‐6‐LDKO. We identified Wnt2 and Wnt9b, the same Wnts that are expressed at baseline, to be massively up‐regulated in ECs and macrophages after PH. Altogether, our data elucidate the spatiotemporal cellular–molecular circuitry of Wnt/β‐catenin signaling in baseline livers and during LR.
Materials and Methods
MICE AND BREEDING
All animal husbandry and experimental procedures, including animal housing and diet, were performed under the guidelines and approval of the National Institutes of Health and the Institutional Animal Care and Use Committee at the University of Pittsburgh. Mice were fed regular chow in standard caging and kept under a 12‐hour light–dark cycle with no enrichment. Lyve1‐cre mice were purchased from Jackson Laboratories15 and bred with Wlsflox/flox mice.7, 14 Lyve1‐cre+/–;Wlsflox/flox are hereafter referred to as EC‐Wls‐KO. Mice with Lyve1‐cre–/–;Wlsflox/flox or Lyve1‐cre+/–;Wls–/– genotypes were used as littermate controls (EC‐Wls‐CON). Lyve1‐cre mice were also bred to ROSA26‐Stopflox/flox‐enhanced yellow fluorescent protein (EYFP) mice to label cells effectively targeted by Lyve1‐cre.16 β‐catenin‐LKO mice were used for microdissection and are described elsewhere.6
PARTIAL HEPATECTOMY
Two‐month‐old male and female EC‐Wls‐KO and CON mice were subjected to PH as described.17 At time 0 (n = 2 males, n = 3 females), 24 hours (n = 2 males, n = 2 females), 40 hours (n = 3 males, n = 2 females), or 72 hours (n = 3 males, n = 2 females), mice were euthanized by isoflurane inhalation and cervical dislocation. Livers were harvested and lobes were flash frozen or paraffin embedded for further analysis.
ACETAMINOPHEN TOXICITY STUDIES
Male 10‐week‐old EC‐Wls‐CON (n = 3) and male EC‐Wls‐KO (n = 5) mice were fasted overnight and injected intraperitoneally with 450 mg/kg acetaminophen in 0.9% saline. Animals were killed 24 hours postinjection as described above. Blood was drawn through the inferior vena cava, and serum was submitted to the University of Pittsburgh Medical Center Clinical Chemistry laboratory, which is part of the Pittsburgh Liver Research Center, for alanine aminotransferase and aspartate aminotransferase testing.
IMMUNOFLUORESCENCE
Liver sections were fixed in 2% paraformaldehyde for 2 hours and then with 30% sucrose in phosphate‐buffered saline (PBS) overnight. For immunofluorescence (IF), sections were frozen in optimal cutting temperature compound and cut in 5‐μm sections. Samples were permeabilized with 0.1% Triton and blocked in 2% serum in PBS with Tween 20. Primary antibodies (information in http://onlinelibrary.wiley.com/doi/10.1002/hep4.1196/full) were incubated overnight. Secondary antibodies conjugated to Alexa Fluor 555 or 488 (Life Technologies) were incubated at 1:400 in PBS with Tween 20 for 3 hours prior to 4′,6‐diamidino‐2‐phenylindole. Images were taken on a Nikon A1 spectral confocal microscope located at the Center for Biological Imaging at the University of Pittsburgh.
PROTEIN ISOLATION, WESTERN BLOT ANALYSIS, AND IMMUNOPRECIPITATION
Whole‐cell protein lysate preparation was performed using radio immunoprecipitation assay buffer7, and 30 μg of protein was used for gel electrophoresis for western blots (WBs). Immunoprecipitation (IP) was performed using 750 μg of precleared protein and A/G agarose beads, as described.18 For a complete list of antibodies used, see http://onlinelibrary.wiley.com/doi/10.1002/hep4.1196/full. Secondary antibodies conjugated to horseradish peroxidase were used at 1 to 10,000.
MICRODISSECTION
Baseline livers from control mice and regenerating livers from 12 hours after PH of liver‐specific‐β‐catenin KO or control mice were harvested and frozen in optimal cutting temperature compound until use. Two males per genotype were used. We cut 10‐μm sections on a microtome and stained these with hematoxylin and eosin. For microdissection, specific areas were scraped manually under the microscope and materials from specific zones were pooled together from multiple areas and slides as described.19, 20 RNA was extracted as described below. The purity of each zone was verified by expression analysis for markers that are known to be zonated in location (http://onlinelibrary.wiley.com/doi/10.1002/hep4.1196/full).
RNA ISOLATION AND QUANTITATIVE REVERSE‐TRANSCRIPTION POLYMERASE CHAIN REACTION ANALYSIS
RNA was obtained using RNeasy Mini Kit (Qiagen), and 1‐2 μg was reverse transcribed using Superscript III (Invitrogen). Real‐time quantitative polymerase chain reaction (qPCR) was performed using SYBR Green on an ABI Prism 7300 sequence detection system (Applied Biosystems), and values were normalized to glyceraldehyde 3‐phosphate dehydrogenase. For a list of primer sequences, see http://onlinelibrary.wiley.com/doi/10.1002/hep4.1196/full.
HISTOLOGY AND IMMUNOHISTOCHEMISTRY
Hematoxylin and eosin staining was performed on 4‐μm paraffin sections for discerning histology. Mitotic figures were identified in hepatocytes. For quantification, hepatocytes with mitotic figures were counted in three to five random 200 × fields from three livers from each group at 24, 40, and 72 hours. For immunohistochemistry (IHC), paraffin sections were processed as described.6, 7 Antibody dilutions are listed in http://onlinelibrary.wiley.com/doi/10.1002/hep4.1196/full. Heat‐mediated antigen retrieval was performed for IHC. Secondary antibodies conjugated to biotin were used at 1 to 400, and staining was detected with 3,3′‐diaminobenzidine detection systems after incubation with the Avidin–Biotin Complex Kit (Vector). For quantification, proliferating cell nuclear antigen (PCNA)‐positive hepatocytes were counted in three to five random 200 × fields from three livers from each group at 40 and 72 hours. For quantification of cyclin‐D1‐positive hepatocytes immediately bordering the central vein, we counted the number of cyclin‐D1‐positive hepatocytes lining the central vein over total hepatocytes lining that central vein and presented this as a percentage; at least five central veins were randomly chosen for counting hepatocytes at 200×, and at least three mice from each group at 24, 40, and 72 hours after PH were analyzed.
LIVER PERFUSION
Two‐month‐old C57bl6 male mice were anesthetized with Nembutal, and an incision was made to open the peritoneum. A 24‐gauge catheter was inserted into the inferior vena cava and another in the portal vein; the inferior vena cava below the heart was clamped. Through the portal vein catheter, the liver was washed with 100 mL calcium (–) magnesium (–) Hank's balanced salt solution (HBSS) with 50 mM 4‐(2‐hydroxyethyl)‐1‐piperazine ethanesulfonic acid (Gibco) and 25 mM ethylene glycol tetraacetic acid at 2‐3 mL/minute. Next, the liver was digested with 0.3 mg/g collagenase type IV (Sigma) and 50 mM 4‐(2‐hydroxyethyl)‐1‐piperazine ethanesulfonic acid in HBSS with calcium. Upon digestion, liver was removed and dispersed in 30 mL HBSS. Dispersed cells were filtered by mesh (100 μm) and centrifuged at 50g for 5 minutes twice to isolate hepatocytes. Then, supernatant was spun down at 700 g for 10 minutes to obtain nonparenchymal cells (NPCs).
EC AND MACROPHAGE SEPARATION
For cell separation studies, 2‐month‐old male C57LB6 mice (n = 2; Jackson Laboratories) were used for two‐step liver perfusion 12 hours after PH, and parenchymal and NPC fractions were separated. Magnetic bead separation was used to isolate ECs and macrophages. Cells from two livers were pooled for analysis. The NPC fraction was incubated with anti‐mouse biotin‐F4/80 antibody (Biolegend) at 1:10 for 30 minutes on ice. Cells were washed and incubated with streptavidin microbeads (Miltenyi Biotech) at 1:10 for 20 minutes on ice. Samples were passed through LS columns (Miltenyi Biotech) to obtain F4/80‐positive cells (macrophages). The F4/80‐negative fraction was incubated with anti‐mouse biotin‐clusters of differentiation (CD)31 antibody (Biolegend) at 1:20 for 30 minutes on ice. They were washed once and incubated with streptavidin‐microbeads at 1:20 for 20 minutes on ice. Then LD columns (Miltenyi Biotech) were used to obtain CD31‐positive cells (ECs). F4/80‐positive and CD31‐positive fractions were then processed for RNA analysis.
STATISTICS
Data are presented as mean, SD, and/or individual data points. Graphs were generated using Graphpad or Microsoft Excel. P values were calculated using the two‐tailed Student t test or one‐way analysis of variance for multiple comparisons with either Tukey's posttest correction or Fisher's least significant difference test; P < 0.05 was considered statistically significant.
Results
SUCCESSFUL RECOMBINATION OF FLOXED ALLELES IN HEPATIC SINUSODIAL AND CENTRAL VENOUS ECs BY Lyve1‐Cre
Because Lyve1 is a known lymphatic endothelial cell marker,21 we first wanted to confirm which ECs in the liver undergo recombination. Lyve1‐cre mice were crossed with ROSA26‐Stopflox/flox‐EYFP reporter mice. Confocal imaging showed YFP localization in sinusoidal ECs as well as in ECs lining central veins, as highlighted by GS‐expressing pericentral hepatocytes (Fig. 1A). Because Lyve1 expression in adult liver has been reported in sinusoidal ECs but not in ECs lining central veins, we stained normal adult liver for Lyve1.22, 23 Indeed, Lyve1 localized to hepatic sinusoidal ECs and not to venous ECs (Fig. 1B). We also costained for Lyve1 and biliary marker epithelial cell adhesion molecule to distinguish portal from pericentral regions (Fig. 1C). Additional confirmation of Lyve1‐cre‐driven recombination in hepatic sinusoidal and central venous ECs was seen by colocalization of pan‐EC maker CD31 and YFP in ROSA26‐Stopflox/flox‐EYFP, Lyve1+/– but not in ROSA26‐Stopflox/flox‐EYFP, and Lyve1–/– controls (http://onlinelibrary.wiley.com/doi/10.1002/hep4.1196/full). Thus, while Lyve1 was only expressed in hepatic sinusoidal ECs in adult liver, it did recombine reporter genes in venous ECs.
Figure 1.

Lyve1‐cre efficiently recombines floxed stop codon allowing expression of YFP in hepatic endothelia. (A) Representative confocal images show IF staining for YFP (red), GS (green), and DAPI (blue) revealing YFP positivity in ECs lining the central vein flanked by GS‐positive hepatocytes in addition to sinusoidal ECs in liver from ROSA26‐Stopflox/flox‐EYFP; Lyve1‐cre+/− mice. (B) Representative confocal images for IF for Lyve1 and DAPI (blue) in control adult liver shows localization in predominantly hepatic sinusoidal ECs but no staining in ECs lining central veins (*). (C) Representative confocal images for IF for Lyve1 (red), EpCAM (green), and DAPI (blue) reveals predominant Lyve1 expression in sinusoidal ECs in zones 1 and 2 and lack of Lyve1 in ECs lining central veins (*). EpCAM was used to outline bile ducts to help recognize the periportal region. Abbreviations: DAPI, 4′,6‐diamidino‐2‐phenylindole; EpCAM, epithelial cell adhesion molecule. Images taken at 100x.
EC CELL‐DERIVED Wnt PROTEINS ARE REQUIRED FOR EXPRESSION OF PERICENTRAL β‐CATENIN TARGETS AND METABOLIC ZONATION
To assess the role of EC Wnts in the liver, we conditionally deleted Wls by using Lyve1‐Cre through the generation of EC‐Wls‐KO as described above. Similar to β‐catenin‐LKO and LRP5‐6‐LDKO, we observed a significantly lower liver weight to body weight ratio in EC‐Wls‐KO6, 7, 14 (Fig. 2A). No additional phenotype at baseline was grossly evident.
Figure 2.

Characterization of EC‐Wls‐KO reveals low liver weights and defective metabolic zonation. (A) EC‐Wls‐KO mice (n = 6) have significantly lower LW/BW ratio at baseline compared to littermate controls (n = 7). (B) Representative WB shows noteworthy decreases in Cyp2e1, GS, Cyp1a2, and active‐β‐catenin in EC‐Wls‐KO at baseline while total β‐catenin is unaltered. (C) Representative IHC shows the presence of GS, Cyp2e1, and Cyp1a2 in EC‐Wls‐CON in zone 3 hepatocytes and their absence in EC‐Wls‐KO (magnification × 50). (D) Significantly lower serum ALT and AST shows complete protection in EC‐Wls‐KO at 24 hours in response to a single intraperitoneal injection of 450 mg/kg of acetaminophen compared to EC‐Wls‐CON. (*P < 0.05; ***P < 0.001). Abbreviations: ALT, alanine aminotransferase; AST, aspartate aminotransferase; LW/BW, liver weight to body weight. In graphs, each data point represents one animal, and the mean and standard deviations are represented by the horizontal lines.
A recent study showed that the central vein ECs are the source of Wnt2 and Wnt9b, which are essential for pericentral β‐catenin activation.8 We next examined β‐catenin‐dependent hepatic zonation targets in the EC‐Wls‐KO. While total β‐catenin levels were comparable in EC‐Wls‐CON and EC‐Wls‐KO, levels of serine 33 (Ser33)/Ser37 and threonine 41 (Thr41)‐hypophosphorylated‐β‐catenin or active‐β‐catenin were notably reduced in the KO at baseline by WB (Fig. 2B). Likewise, a profound loss of β‐catenin targets, including GS, Cyp2e1, and Cyp1a2, was also observed by WB and IHC (Fig. 2B,C). To validate functionally the loss of metabolic zonation, we next administered high‐dose acetaminophen (APAP) to EC‐Wls‐CON and EC‐Wls‐KO mice. Our laboratory and others have shown both β‐catenin‐LKO and LRP5‐6‐LDKO are protected from APAP‐induced hepatic injury because they lack Cyp2e1 and Cyp1a2 and hence are unable to convert APAP into N‐acetyl‐p‐benzo‐quinone imine, the metabolite critical for glutathione depletion and hepatocyte injury.5, 6, 7, 24, 25 At 24 hours after APAP injection, EC‐Wls‐CON had expectedly high serum alanine aminotransferase and aspartate aminotransferase levels while EC‐Wls‐KO showed normal transaminases, demonstrating protection (Fig. 2D). Thus, Wnts from central vein ECs are essential for baseline β‐catenin activation and metabolic zonation.
DELAYED LR IN EC‐Wls‐KO AFTER PH
EC‐Wls‐CON and EC‐Wls‐KO were next subjected to PH and regenerating livers harvested at various time points, as outlined in Materials and Methods. PCNA labeling was assessed by IHC at 24, 40, and 72 hours. As expected, no PCNA‐positive hepatocytes were evident in either group at 24 hours (Fig. 3A). However, at 40 and 72 hours in EC‐Wls‐CON, several hepatocytes throughout the hepatic lobule were strongly PCNA positive (Fig. 3A,B). Intriguingly, we saw a consistent and complete lack of PCNA‐positive hepatocytes in EC‐Wls‐KO at 40 hours (Fig. 3A,B). At 72 hours, a noteworthy increase in the numbers of PCNA‐positive hepatocytes was evident in EC‐Wls‐KO (Fig. 3A). A decrease in PCNA‐positive hepatocytes in EC‐Wls‐KO compared to EC‐Wls‐CON was significant at 40 hours but not at 72 hours (Fig. 4A). Hepatocyte mitotic figures as an index of cell division were counted and showed significantly lower mitotic figures in EC‐Wls‐KO at 40 hours (Fig. 4B). Highest hepatocyte mitosis occurred at 40 hours in EC‐Wls‐CON, whereas this peak was shifted to 72 hours in EC‐Wls‐KO (Fig. 4B). These observations were consistent in both sexes. WB for PCNA also confirmed its absence at 24 hours in both EC‐Wls‐CON and EC‐Wls‐KO (Fig. 4C), while its maximal levels were seen at 40 hours in EC‐Wls‐CON with a decline at 72 hours in both male and female mice (Fig. 4C). PCNA was absent at 40 hours in EC‐Wls‐KO and was highest at 72 hours in both male and female animals (Fig. 4C). Thus, a notable delay in LR is evident in EC‐Wls‐KO in response to PH, which was similar to observations in β‐catenin‐LKO and LRP5‐6‐LDKO.
Figure 3.

IHC for PCNA in regenerating livers from EC‐Wls‐KO and EC‐Wls‐Con. (A) Representative IHC (magnification × 100 and ×200) shows increased PCNA staining hepatocytes panzonally at 40‐72 hours in EC‐Wls‐CON, whereas EC‐Wls‐KO show positive staining only at 72 hours. (B) Larger panels (magnification × 100) highlighting differences in PCNA at 40 hours after PH. Abbreviations: CV, central vein; PT, portal triad.
Figure 4.
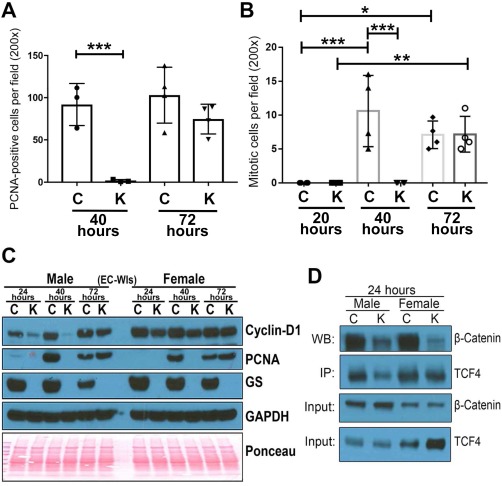
LR is notably delayed in the EC‐Wls‐KO mice compared to controls. (A) Quantification of PCNA IHC shows significant decreases in the number of hepatocytes staining positive at 40 hours after PH in EC‐Wls‐KO compared to controls. No differences were evident at 72 hours. Each symbol represents an average of 5 random images at 200 × magnification from one mouse. Three or more mice from each group were used for each time point. The P value was calculated by one‐way ANOVA for multiple comparisons with Tukey's posttest correction. (***P < 0.001). (B) The number of hepatocytes showing mitotic figures were counted at 24, 40, and 72 hours after PH in EC‐Wls‐KO and EC‐Wls‐Con. EC‐Wls‐KO showed a significant decrease at 24 hours and 40 hours while these number were comparable at 72 hours. Each symbol represents an average of 5 random images at 200 × magnification from one mouse. Three or more mice from each group were used for each time point. The P value was calculated by ordinary one‐way ANOVA and multiple comparisons by uncorrected Fisher's least significant difference test (*P < 0.05; **P < 0.01; ***P < 0.001). (C) Representative WB showing levels of cyclin‐D1, PCNA, and GS in EC‐Wls‐CON versus EC‐Wls‐KO from 24‐72 hours during LR. (D) Immunoprecipitation using anti‐TCF4 and probing for β‐catenin shows reduced TCF4‐β‐catenin association in EC‐Wls‐KO at 24 hours. Abbreviations: ANOVA, analysis of variance; C, control; GAPDH, glyceraldehyde 3‐phosphate dehydrogenase; K, EC‐Wls‐KO.
DECREASED β‐CATENIN ACTIVATION AND CYCLIN‐D1 EXPRESSION IN EC‐Wls‐KO AFTER PH
To address if the delay in LR in EC‐Wls‐KO is due to decreased β‐catenin activation, we first examined the β‐catenin–TCF4 interaction by IP. A dramatic decrease in the TCF4–β‐catenin association was observed in EC‐Wls‐KO at 24 hours after PH compared to EC‐Wls‐CON in both sexes (Fig. 4D). Next, we assessed levels and localization of cyclin‐D1, a β‐catenin–TCF4 target in LR. WB showed decreased cyclin‐D1 in EC‐Wls‐KO at 24‐40 hours in both sexes, although differences were less drastic in females, likely due to higher basal cyclin‐D1 (Fig. 4C). At 72 hours, however, cyclin‐D1 resurged in EC‐Wls‐KO and was almost comparable to EC‐Wls‐Con. GS, a known β‐catenin target, continued to be absent in EC‐Wls‐KO, indicating sustained loss of β‐catenin activity (Fig. 4C).
We next performed IHC and showed cyclin‐D1 staining in the EC‐Wls‐CON at 24 hours after PH in both periportal and midzonal hepatocytes while pericentral hepatocytes were negative (Fig. 5A). At 40 hours, cyclin‐D1 localization expanded to additional hepatocytes in all zones sparing only some pericentral hepatocytes (Fig. 5A). Cyclin‐D1‐labeled hepatocytes were further increased at 72 hours, including to a few pericentral hepatocytes (Fig. 5A). At 24 hours, EC‐Wls‐KO showed only occasional cyclin‐D1‐positive hepatocytes and hence showed a prominent decrease when compared to EC‐Wls‐CON (Fig. 5A). Intriguingly, unlike EC‐Wls‐CON, EC‐Wls‐KO showed pericentral hepatocytes to be cyclin‐D1 positive (Fig. 5A). At 40 hours, more layers of hepatocytes surrounding the central vein became cyclin‐D1 positive, also in stark contrast to EC‐Wls‐Con (Fig. 5A). Cyclin‐D1 labeling expanded further into the midzonal hepatocytes in EC‐Wls‐KO at 72 hours (Fig. 5A). These observations were evident in both male and female mice, although decreased cyclin‐D1 was less prominent in female animals (IHC shown for male mice only). To further validate this observation, we quantified cyclin‐D1‐positive hepatocytes bordering the central vein only, as described in the Material and Methods. At 24, 40, and 72 hours, EC‐Wls‐KO showed significantly greater cyclin D1‐positive hepatocytes along the central vein than EC‐Wls‐CON (Fig. 5B). Thus, there were quantitative and qualitative differences in cyclin‐D1 expression between the two groups.
Figure 5.

Quantitative and qualitative differences in hepatocyte cyclin‐D1 in EC‐Wls‐KO versus EC‐Wls‐CON after PH. (A) Representative IHC shows a gradual increase in cyclin‐D1 staining during LR in periportal and midzonal hepatocytes in EC‐Wls‐CON from 24‐40 hours and almost the entire lobule sparing a few pericentral hepatocytes at 72 hours. Cyclin‐D1 staining was apparent in few pericentral hepatocytes in EC‐Wls‐KO livers at 24 hours after PH and gradually increased in this zone at 40 hours, expanding further at 72 hours. Black asterisk shows the portal triad; red asterisk shows the central vein. (B) Quantification of cyclin‐D1‐positive versus total hepatocytes lining only central veins is represented as a percentage for both EC‐Wls‐CON and EC‐Wls‐KO at 24, 40, and 72 hours after PH. Each symbol represents the average of at least 5 images at magnification 200 × around the central vein from one mouse. Three or more mice from each group were used for each time point. The P value was calculated by ordinary one‐way ANOVA and multiple comparisons by uncorrected Fisher's LSD test. (**P < 0.01; ***P < 0.001; ****P < 0.0001). (C) Relative expression of Ccnd1 encoding cyclin‐D1 in WT liver at baseline and 12 hours after PH in pericentral, midzonal, and periportal regions. The same analysis after PH was also performed in β‐catenin‐LKO. (D) Relative expression of Glul encoding GS in WT liver at baseline and 12 hours after PH in pericentral, midzonal, and periportal regions. The same analysis after PH was also performed in β‐catenin‐LKO. Abbreviations: C, control; K, EC‐Wls‐KO; MZ, midzonal; PC, pericentral; PP, periportal; Pre, baseline.
ZONAL DICHOTOMY IN β‐CATENIN ACTIVATION DURING LR
β‐Catenin regulates expression of glutamate‐ammonia ligase (Glu) encoding GS. β‐Catenin also regulates Ccnd1 encoding for cyclin‐D1 during LR. To confirm if β‐catenin is regulating these two targets spatiotemporally, we next used liver cryosections from baseline control mice, control mice after 12 hours PH, and β‐catenin‐LKO after 12 hours PH. The sections were microdissected, and pooled scrapings from the periportal zone, pericentral zone, and midzone were used for messenger RNA (mRNA) isolation and reverse‐transcription qPCR, as described in the Material and Methods and previously20 (http://onlinelibrary.wiley.com/doi/10.1002/hep4.1196/full). The relative purity of various zones was verified by analysis of genes with known zonal expression (http://onlinelibrary.wiley.com/doi/10.1002/hep4.1196/full). Next, we assessed Ccnd1 and Glul expression. An approximate 8‐10‐fold increase in Ccnd1 in the periportal zone and midzone was observed at 12 hours after PH while the pericentral region showed less than a 4‐fold increase, when compared to respective zones at baseline (Fig. 5C). These increases were absent in β‐catenin‐LKO, validating the requirement of β‐catenin signaling in Ccnd1 expression (Fig. 5C). Glul was 20‐fold higher in the pericentral region in baseline livers compared to other zones (Fig. 5D). At 12 hours after PH, a 100‐fold increase in its expression occurred in the pericentral zone and an approximate 20‐fold increase in the midzone. Baseline Glul expression and an increase at 12 hours during LR was also absent in β‐catenin‐LKO (Fig. 5D). Together, these findings suggest activation of β‐catenin during LR panzonally, although target gene up‐regulation was zonally restricted.
PANZONAL UP‐REGULATION OF SEVERAL Wnt GENES DURING LIVER REGENERATION
Because β‐catenin activation occurred panzonally after PH, we used mRNA isolated from various microdissected hepatic zones at baseline and 12 hours after PH in control mice for analysis of the expression of several Wnt genes. We identified at least a 5‐fold increase in the expression of Wnt2 and Wnt4 in all zones; an exclusive increase in the pericentral zone of 3‐fold or greater was evident in Wnt9b and Wnt5b at 12 hours after PH (Fig. 6A). Thus, several Wnt genes are changed at 12 hours after PH in microdissected hepatic zones from cryosections.
Figure 6.
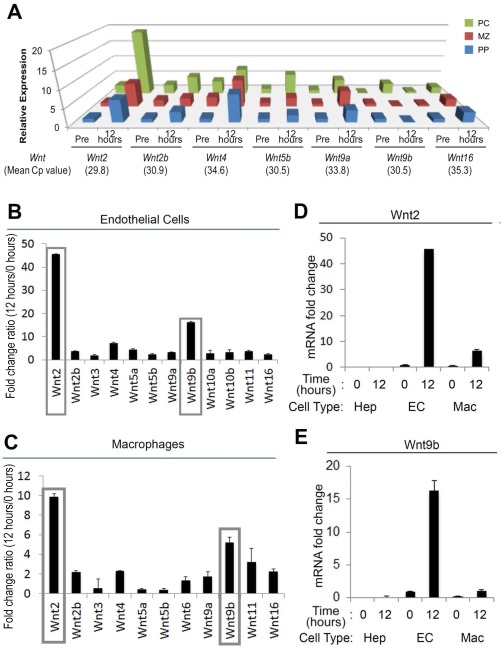
Zonal and cellular changes in Wnt genes at 12 hours after PH. (A) Relative expression of several Wnts in WT liver at baseline and 12 hours after PH in pericentral, midzonal, and periportal regions shows more than 5‐fold panzonal increases in Wnt2 and Wnt4. At least a 3‐fold increase exclusively in the PC region was seen for Wnt9b and Wnt5b. (B) qRT‐PCR analysis for selected Wnt genes in ECs isolated from regenerating livers at 12 hours after PH. The y‐axis denotes fold change at 12 hours over baseline; Wnt2 mRNA increased 45‐fold and Wnt9b approximately 15‐fold. (C) qRT‐PCR analysis for selected Wnt genes in macrophages isolated from regenerating livers at 12 hours after PH. Wnt2 mRNA increased 10‐fold and Wnt9b mRNA approximately 6‐fold. (D) Changes in Wnt2 mRNA in hepatocytes, ECs, and macrophages at baseline and 12 hours after PH. ECs express highest levels of Wnt2 at baseline and after PH. (E) Changes in Wnt9b mRNA in Hep, EC, and Mac at baseline and 12 hours after PH. ECs express highest levels of Wnt9b at baseline and after PH. Abbreviations: Hep, hepatocytes; Mac, macrophages; MZ, midzonal; PC, pericentral; PP, periportal; Pre, baseline; qRT‐PCR, quantitative reverse‐transcription PCR. Graphs display mean and standard deviation.
UP‐REGULATION OF Wnt2 AND Wnt9b mRNA EXPRESSION IN ECs AND MACROPHAGES AND NOT HEPATOCYTES IN REGENERATING LIVERS AT 12 HOURS AFTER PH
Because our current and previous study suggest ECs and macrophages to be the major source of Wnts during LR and cyclin‐D1 expression increases occur early during LR, we selected 12 hours after PH to query changes in Wnt expression in ECs and macrophages.7 Control mice were used to isolate hepatocytes and NPCs by collagenase perfusion at 12 hours after PH, and cells were pooled from two mice (http://onlinelibrary.wiley.com/doi/10.1002/hep4.1196/full). Purity of isolated cells was confirmed by quantitative reverse‐transcription PCR analysis for cell‐specific markers (http://onlinelibrary.wiley.com/doi/10.1002/hep4.1196/full). Analysis of the hepatocyte fraction showed no appreciable changes in Wnt expression at 12 hours versus baseline (http://onlinelibrary.wiley.com/doi/10.1002/hep4.1196/full). An approximate 45‐fold up‐regulation in the expression of Wnt2 and 18‐fold up‐regulation in the expression of Wnt9b were observed in ECs at 12 hours after PH (Fig. 6B). Macrophages showed an approximate 10‐fold increase in Wnt2 and 6‐fold increase in Wnt9b expression at this time (Fig. 6C). Lastly, at baseline, highest transcript levels of Wnt2 and Wnt9b were observed in ECs followed by macrophages and lastly hepatocytes, which increased significantly after PH in ECs and macrophages only (Fig. 6D,E).
Discussion
The current study is a continuation of our previous work identifying hepatocyte‐specific β‐catenin as a major driver of hepatic zonation and LR after PH.6 Further, β‐catenin in both zonation and LR is under the control of paracrine Wnt signaling, as shown in LRP5‐6‐LDKO mice.7 In the same study, we ruled out hepatocytes, cholangiocytes, and macrophages as sources of Wnts in regulating pericentral β‐catenin activation. However, macrophages were identified as a source of Wnts during LR based on a modest and temporal decrease in cyclin‐D1 and a 30% deficit in hepatocyte proliferation at 40 hours. We also used Tie2‐Cre to delete Wls from ECs; this led to embryonic lethality, thus precluding further assessment.7 Since our study, Dr. Nusse's group identified ECs lining the central vein as the source of Wnt2 and Wnt9b in regulating β‐catenin activation and target gene expression in pericentral hepatocytes.8 We also employed platelet‐derived growth factor i‐Cre‐ERT2 to generate EC‐Wls‐KO; this led to a mosaic recombination insufficient to draw concrete conclusions, likely due to a different transgenic line.26 Eventually, we employed transgenic mice expressing Cre recombinase under Lyve1 promoter to delete Wls from ECs in the liver.
Lyve1, normally expressed in lymphatic ECs, is also expressed in hepatic sinusoidal ECs in liver.22, 23 We verified this observation of Lyve1. Intriguingly, fate‐tracing studies showed recombination additionally in the venous ECs, suggesting Lyve1 expression occurring at some developmental stage in the venous ECs. Indeed, such analogies exist, for example, the albumin‐cre transgenic line recombines floxed genes in hepatocytes and cholangiocytes despite albumin expression only in adult hepatocytes.27, 28 This occurs due to the temporal expression of the albumin gene in hepatoblasts during development, which gives rise to both hepatocytes and cholangiocytes.6, 27 Whether there is a common progenitor of sinusoidal ECs and ECs lining the central vein or whether Lyve1 is independently expressed in all ECs during development is unknown.
EC‐Wls‐KO mice at baseline showed lower liver weight to body weight ratios. This observation is consistent with the lack of optimal baseline β‐catenin activation in hepatocytes during early postnatal stages, similar to β‐catenin‐LKO and LRP5‐6‐LDKO.6, 7 Our previous study showed the role of β‐catenin in hepatocyte proliferation during early postnatal hepatic growth.29 Our current study thus suggests hepatic ECs may be the source of Wnts that induce β‐catenin activation during early postnatal stages.
EC‐Wls‐KO mice at baseline also lacked pericentral β‐catenin targets, indicating disruption of metabolic zonation. This observation phenocopied β‐catenin‐LKO and LRP5‐6‐LDKO.5, 6, 7 ECs lining the central vein were recently shown to be the primary source of Wnts required for β‐catenin activation in pericentral hepatocytes8; Wnt2 and Wnt9b were identified as the major Wnts responsible for this process. Our microdissection and cell separation studies validated this observation. The limited movement of Wnts, in general owing to their hydrophobicity secondary to acylation, which is essential for their biological activity, likely restricts β‐catenin activation to a few hepatocyte layers around the central vein. Further, high antigen‐presenting cell (APC) expression in hepatocytes in the periportal region also deters basal β‐catenin activity in that region.3 The basis of constitutive Wnt2 and Wnt9b release from ECs lining central veins remains unknown.
EC‐Wls‐KO mice, very similar to β‐catenin‐LKO and LRP5‐6‐LDKO, showed delayed LR with decreased hepatocyte proliferation at 40 hours and a rebound increase at 72 hours, as seen by PCNA and the hepatocyte mitotic index in both male and female mice.6, 7, 10 To address the basis of decreased proliferation, we assessed cyclin‐D1, which showed a peculiar zonal expression after PH that varied between the EC‐Wls‐Con versus EC‐Wls‐KO mice. This led us to carefully address the zonal activation of β‐catenin during LR. Using microdissected tissue from the three zones of hepatic lobules, we detected panzonal β‐catenin activation as reflected by a 7‐8‐fold increase in Ccnd1 in the periportal and midzone regions and Glul in the midzone (approximately 20‐fold) and pericentral regions (100‐fold) at 12 hours after PH compared to baseline. While both these genes are known to be β‐catenin targets4, 6 and cyclin‐D1 has been shown to be regulated by β‐catenin during LR,6, 12 GS has never been shown to undergo changes after PH. The function of increased GS during LR remains unclear, although we posit its enhanced expression to assist in ammonia detoxification because only one‐third of the liver is now handling various functions until the mass is restored. β‐Catenin specificity in regulating the expression of both genes during LR was shown by a complete lack of enhanced expression in β‐catenin‐LKO mice at 12 hours after PH. The most intriguing finding was the zonal dichotomy in the increased expression of these two β‐catenin targets. Increased cyclin‐D1 expression was most prominently periportal and midzonal, while Glul expression increased profoundly in the pericentral and less so in the midzone region. Simultaneously, Wnt2 and Wnt4 were increased in all zones while genes like Wnt9b and Wnt5b were prominently increased in the pericentral zone. However, based on EC‐Wls‐KO lacking β‐catenin activation and hepatocyte proliferation at 40 hours after PH and our previous study showing a contribution of macrophages in the LR process, interrogation of Wnt genes in ECs and macrophages isolated from regenerating liver at 12 hours only showed pronounced increases in Wnt2 and Wnt9b, suggesting that changes in other Wnts may be of lesser relevance in regulating hepatocyte proliferation. Taken together, we believe that after PH, there is an increase in Wnt expression and a release from both sinusoidal and central venous ECs leading to spatiotemporal and paracrine activation of β‐catenin in all hepatocytes. The basis of the dichotomous activation of β‐catenin targets, however, remains enigmatic. It was intriguing to note that when ECs were unable to secrete Wnts after PH in EC‐Wls‐KO, cyclin‐D1 increased in the pericentral hepatocytes, which coincidentally lacked GS. This almost mutually exclusive zonated expression of GS and cyclin‐D1 while both being β‐catenin dependent during LR is intriguing and requires further investigation. One speculation is that constitutive β‐catenin activation in pericentral hepatocytes at baseline prevents cyclin‐D1 expression after PH as most β‐catenin is already engaged in Glul transcription. A massive up‐regulation in pericentral Wnts during LR, however, did coincide with modest increases in pericentral cyclin‐D1 expression at 12 hours after PH. It is likely that loss of GS (and other β‐catenin targets) in pericentral hepatocytes makes these cells less differentiated and permissive to cyclin‐D1 expression in response to non‐β‐catenin‐dependent proliferative signals because signaling redundancy in genetic KO to ensure LR is well known.30 In periportal and midzonal hepatocytes, however, where β‐catenin is not basally active due to higher APC levels,3 increased spatiotemporal Wnt expression after PH in ECs and macrophages may allow for APC loss,9 leading to β‐catenin activation and cyclin‐D1 increase.
PCNA‐deficiency was evident in females at 40 hours despite higher basal cyclin‐D1 expression in EC‐Wls‐CON, suggesting that de novo cyclin‐D1 expression and not the preexisting pool is critical for hepatocyte proliferation after PH. The preexisting cyclin‐D1 pool in females may be a function of estrogen because cyclin‐D1 promoter has an estrogen‐response element and is known to control its expression.31 Because cyclin‐D1 has functions beyond proliferation, such as in metabolism, estrogen‐dependent cyclin‐D1 may be performing additional functions in female livers.32
An important unanswered question that requires further investigation is the molecular basis of regeneration in the three genotypes that lack “physiological” β‐catenin activation: β‐catenin‐LKO, LRP5‐6‐LDKO, and EC‐Wls‐KO. The simplest explanation is that liver has a common redundant mechanism that is activated when β‐catenin activation by Wnts is hampered in the three genotypes based on similarly decreased cyclin‐D1 at 24‐40 hours, lack of PCNA at 40 hours, and increased cyclin‐D1 and PCNA at 72 hours. Also, the lack of GS positivity in EC‐Wls‐KO at 72 hours despite the resurgence of cyclin‐D1 and the initiation and expansion of cyclin‐D1 expression at 24‐72 hours that occurs from zone 3 to zone 1 (as opposed to zone 1 to zone 3 in control mice) suggests activation of a non‐Wnt non‐β‐catenin mechanism. However, the molecular basis of LR could also be distinct in these three models due to disruption of Wnt‐β‐catenin signaling at different levels. β‐Catenin activation through any mechanism is precluded only in the β‐catenin‐LKO as they lack β‐catenin in hepatocytes; hence redundant signaling has to be β‐catenin independent. β‐Catenin activation through any Wnt is not possible in either β‐catenin‐LKO or LRP5‐6‐LDKO mice because the latter lack Wnt coreceptors, although β‐catenin can be activated in the latter by non‐Wnt‐dependent mechanisms as β‐catenin is still present in the hepatocytes. β‐Catenin activation in hepatocytes cannot occur by Wnts from ECs in β‐catenin‐LKO, LRP5‐6‐LDKO, or EC‐Wls‐KO, but only in the latter can Wnts from non‐EC sources activate β‐catenin to eventually drive LR at 72 hours. A direct comparison of the three strains at various time points after PH is ongoing to elucidate the basis of LR in both biased and unbiased analysis.
Based on microdissection analysis and cell separation, we showed that while several Wnt genes may be altered during early LR, Wnt2 from sinusoidal and central venous ECs and Wnt9b likely from the central venous ECs, followed by the same two Wnts from macrophages, are the major contributors of β‐catenin activation during LR. It will be important to determine what drives Wnt expression and release from ECs after PH. Previously, genetic ablation of vascular endothelial growth factor A receptor‐2 in hepatic sinusoidal ECs impaired hepatocyte proliferation after PH due to diminution of EC‐specific transcription factor Id1.33 In fact, Id1‐deficient mice also showed defective LR initiation that was associated with decreased expression of hepatocyte growth factor and Wnt2 in sinusoidal ECs. ECs and macrophages may be getting signals from cytokines, such as tumor necrosis factor α and interleukin‐6, which are not primary mitogens but are known to contribute to LR.34 Indeed, a recent study showed that stimulation of macrophages by tumor necrosis factor α induces nuclear factor kappa B activation, which then led to secretion of Wnts from these cells.35 Additional mechanisms may be at play and require further studies.
In summary, we validated the paracrine basis of Wnt‐β‐catenin signaling in regulating hepatic zonation and characterized the complex cell–molecule circuitry of the Wnt‐β‐catenin pathway during the LR process (Fig. 7). Based on all data, central vein ECs are a source of Wnt2 and Wnt9b at baseline to instruct β‐catenin in zone 3 hepatocytes. After PH, hepatic ECs and secondarily macrophages secrete Wnt2 and Wnt9b to act through LRP5/6 to activate β‐catenin in all hepatocytes contributing to increased cyclin‐D1 in zone 2 and zone 1 and increased GS in zone 3. Termination of β‐catenin signaling after LR is, in part, achieved by Wnt5a from hepatocytes.36
Figure 7.

Cell‐molecule circuitry of Wnt‐β‐catenin signaling during LR. Following PH, VEGFR2‐Id1 axis, cytokines, such as TNFα and IL6, and as yet unidentified mechanisms appear to induce expression and secretion of Wnt2 from sinusoidal ECs, central venous ECs, and macrophages and secretion of Wnt9b from central venous ECs and macrophages (1). The secreted biologically active but hydrophobic Wnt2 and Wnt9b bind to as yet uncharacterized Frizzled and LRP5/6 coreceptors on hepatocytes in close proximity (2) to induce β‐catenin stabilization, nuclear translocation, and formation of β‐catenin–TCF complex (3). The resulting increase in ccnd1 expression and cyclin‐D1 protein (along with other β‐catenin targets, such as GS) (4) allows for hepatocytes to transition from the G1‐ to S‐phase (5) and eventually undergo cell division to restore loss hepatic mass. Upon accomplishment of required hepatocyte proliferation, hepatocytes secrete Wnt5a (6), which induces β‐catenin degradation to terminate Wnt/β‐catenin signaling. The role of stellate cells in Wnt‐β‐catenin signaling in LR remains unknown. Abbreviations: IL6, interleukin‐6; TNFα, tumor necrosis factor α; VEGFR2, vascular endothelial growth factor receptor 2.
Author names in bold designate shared co‐first authorship.
Supporting information
Additional Supporting Information may be found at http://onlinelibrary.wiley.com/doi/10.1002/hep4.1196/full.
Supporting Information 1
Potential conflict of interest: Nothing to report.
This work was supported by the National Institutes of Health (grants 1R01DK62277, 1R01DK100287, and R01CA204586 to S.P.M. and F31CA216994 to M.E.P.) and the Endowed Chair for Experimental Pathology (to S.P.M.).
REFERENCES
- 1. Nusse R, Clevers H. Wnt/beta‐catenin signaling, disease, and emerging therapeutic modalities. Cell 2017;169:985‐999. [DOI] [PubMed] [Google Scholar]
- 2. Monga SP. beta‐Catenin signaling and roles in liver homeostasis, injury, and tumorigenesis. Gastroenterology 2015;148:1294‐1310. [DOI] [PMC free article] [PubMed] [Google Scholar]
- 3. Benhamouche S, Decaens T, Godard C, Chambrey R, Rickman DS, Moinard C, et al. Apc tumor suppressor gene is the "zonation‐keeper" of mouse liver. Dev Cell 2006;10:759‐770. [DOI] [PubMed] [Google Scholar]
- 4. Cadoret A, Ovejero C, Terris B, Souil E, Levy L, Lamers WH, et al. New targets of beta‐catenin signaling in the liver are involved in the glutamine metabolism. Oncogene 2002;21:8293‐8301. [DOI] [PubMed] [Google Scholar]
- 5. Sekine S, Lan BY, Bedolli M, Feng S, Hebrok M. Liver‐specific loss of beta‐catenin blocks glutamine synthesis pathway activity and cytochrome p450 expression in mice. Hepatology 2006;43:817‐825. [DOI] [PubMed] [Google Scholar]
- 6. Tan X, Behari J, Cieply B, Michalopoulos GK, Monga SP. Conditional deletion of beta‐catenin reveals its role in liver growth and regeneration. Gastroenterology 2006;131:1561‐1572. [DOI] [PubMed] [Google Scholar]
- 7. Yang J, Mowry LE, Nejak‐Bowen KN, Okabe H, Diegel CR, Lang RA, et al. beta‐Catenin signaling in murine liver zonation and regeneration: a Wnt‐Wnt situation! Hepatology 2014;60:964‐976. [DOI] [PMC free article] [PubMed] [Google Scholar]
- 8. Wang B, Zhao L, Fish M, Logan CY, Nusse R. Self‐renewing diploid Axin2(+) cells fuel homeostatic renewal of the liver. Nature 2015;524:180‐185. [DOI] [PMC free article] [PubMed] [Google Scholar]
- 9. Monga SP, Pediaditakis P, Mule K, Stolz DB, Michalopoulos GK. Changes in WNT/beta‐catenin pathway during regulated growth in rat liver regeneration. Hepatology 2001;33:1098‐1109. [DOI] [PMC free article] [PubMed] [Google Scholar]
- 10. Sekine S, Gutierrez PJ, Lan BY, Feng S, Hebrok M. Liver‐specific loss of beta‐catenin results in delayed hepatocyte proliferation after partial hepatectomy. Hepatology 2007;45:361‐368. [DOI] [PubMed] [Google Scholar]
- 11. Rickheim DG, Nelsen CJ, Fassett JT, Timchenko NA, Hansen LK, Albrecht JH. Differential regulation of cyclins D1 and D3 in hepatocyte proliferation. Hepatology 2002;36:30‐38. [DOI] [PubMed] [Google Scholar]
- 12. Torre C, Benhamouche S, Mitchell C, Godard C, Veber P, Letourneur F, et al. The transforming growth factor‐alpha and cyclin D1 genes are direct targets of beta‐catenin signaling in hepatocyte proliferation. J Hepatol 2011;55:86‐95. [DOI] [PubMed] [Google Scholar]
- 13. Zeng G, Awan F, Otruba W, Muller P, Apte U, Tan X, et al. Wnt'er in liver: expression of Wnt and frizzled genes in mouse. Hepatology 2007;45:195‐204. [DOI] [PubMed] [Google Scholar]
- 14. Carpenter AC, Rao S, Wells JM, Campbell K, Lang RA. Generation of mice with a conditional null allele for Wntless. Genesis 2010;48:554‐558. [DOI] [PMC free article] [PubMed] [Google Scholar]
- 15. Pham TH, Baluk P, Xu Y, Grigorova I, Bankovich AJ, Pappu R, et al. Lymphatic endothelial cell sphingosine kinase activity is required for lymphocyte egress and lymphatic patterning. J Exp Med 2010;207:17‐27. [DOI] [PMC free article] [PubMed] [Google Scholar]
- 16. Srinivas S, Watanabe T, Lin CS, William CM, Tanabe Y, Jessell TM, et al. Cre reporter strains produced by targeted insertion of EYFP and ECFP into the ROSA26 locus. BMC Dev Biol 2001;1:4. [DOI] [PMC free article] [PubMed] [Google Scholar]
- 17. Ye H, Holterman AX, Yoo KW, Franks RR, Costa RH. Premature expression of the winged helix transcription factor HFH‐11B in regenerating mouse liver accelerates hepatocyte entry into S phase. Mol Cell Biol 1999;19:8570‐8580. [DOI] [PMC free article] [PubMed] [Google Scholar]
- 18. Wickline ED, Awuah PK, Behari J, Ross M, Stolz DB, Monga SP. Hepatocyte gamma‐catenin compensates for conditionally deleted beta‐catenin at adherens junctions. J Hepatol 2011;55:1256‐1262. [DOI] [PMC free article] [PubMed] [Google Scholar]
- 19. Baba H, Watanabe M, Okabe H, Miyamoto Y, Sakamoto Y, Baba Y, et al. Upregulation of ERCC1 and DPD expressions after oxaliplatin‐based first‐line chemotherapy for metastatic colorectal cancer. Br J Cancer 2012;107:1950‐1955. [DOI] [PMC free article] [PubMed] [Google Scholar]
- 20. Okabe H, Yang J, Sylakowski K, Yovchev M, Miyagawa Y, Nagarajan S, et al. Wnt signaling regulates hepatobiliary repair following cholestatic liver injury in mice. Hepatology 2016;64:1652‐1666. [DOI] [PMC free article] [PubMed] [Google Scholar]
- 21. Prevo R, Banerji S, Ferguson DJ, Clasper S, Jackson DG. Mouse LYVE‐1 is an endocytic receptor for hyaluronan in lymphatic endothelium. J Biol Chem 2001;276:19420‐19430. [DOI] [PubMed] [Google Scholar]
- 22. Mouta Carreira C, Nasser SM, di Tomaso E, Padera TP, Boucher Y, Tomarev SI, et al. LYVE‐1 is not restricted to the lymph vessels: expression in normal liver blood sinusoids and down‐regulation in human liver cancer and cirrhosis. Cancer Res 2001;61:8079‐8084. [PubMed] [Google Scholar]
- 23. Strauss O, Phillips A, Ruggiero K, Bartlett A, Dunbar PR. Immunofluorescence identifies distinct subsets of endothelial cells in the human liver. Sci Rep 2017;7:44356. [DOI] [PMC free article] [PubMed] [Google Scholar]
- 24. Apte U, Singh S, Zeng G, Cieply B, Virji MA, Wu T, et al. Beta‐catenin activation promotes liver regeneration after acetaminophen‐induced injury. Am J Pathol 2009;175:1056‐1065. [DOI] [PMC free article] [PubMed] [Google Scholar]
- 25. Raucy JL, Lasker JM, Lieber CS, Black M. Acetaminophen activation by human liver cytochromes P450IIE1 and P450IA2. Arch Biochem Biophys 1989;271:270‐283. [DOI] [PubMed] [Google Scholar]
- 26. Claxton S, Kostourou V, Jadeja S, Chambon P, Hodivala‐Dilke K, Fruttiger M. Efficient, inducible Cre‐recombinase activation in vascular endothelium. Genesis 2008;46:74‐80. [DOI] [PubMed] [Google Scholar]
- 27. Malato Y, Naqvi S, Schurmann N, Ng R, Wang B, Zape J, et al. Fate tracing of mature hepatocytes in mouse liver homeostasis and regeneration. J Clin Invest 2011;121:4850‐4860. [DOI] [PMC free article] [PubMed] [Google Scholar]
- 28. Postic C, Magnuson MA. DNA excision in liver by an albumin‐Cre transgene occurs progressively with age. Genesis 2000;26:149‐150. [DOI] [PubMed] [Google Scholar]
- 29. Apte U, Zeng G, Thompson MD, Muller P, Micsenyi A, Cieply B, et al. beta‐Catenin is critical for early postnatal liver growth. Am J Physiol Gastrointest Liver Physiol 2007;292:G1578‐1585. [DOI] [PubMed] [Google Scholar]
- 30. Michalopoulos GK. Hepatostat: liver regeneration and normal liver tissue maintenance. Hepatology 2017;65:1384‐1392. [DOI] [PubMed] [Google Scholar]
- 31. Klein EA, Assoian RK. Transcriptional regulation of the cyclin D1 gene at a glance. J Cell Sci 2008;121:3853‐3857. [DOI] [PMC free article] [PubMed] [Google Scholar]
- 32. Mullany LK, White P, Hanse EA, Nelsen CJ, Goggin MM, Mullany JE, et al. Distinct proliferative and transcriptional effects of the D‐type cyclins in vivo. Cell Cycle 2008;7:2215‐2224. [DOI] [PMC free article] [PubMed] [Google Scholar]
- 33. Ding BS, Nolan DJ, Butler JM, James D, Babazadeh AO, Rosenwaks Z, et al. Inductive angiocrine signals from sinusoidal endothelium are required for liver regeneration. Nature 2010;468:310‐315. [DOI] [PMC free article] [PubMed] [Google Scholar]
- 34. Preziosi ME, Monga SP. Update on the mechanisms of liver regeneration. Semin Liver Dis 2017;37:141‐151. [DOI] [PMC free article] [PubMed] [Google Scholar]
- 35. Nejak‐Bowen K, Moghe A, Cornuet P, Preziosi M, Nagarajan S, Monga SP. Role and regulation of p65/beta‐catenin association during liver injury and regeneration: a “complex” relationship. Gene Expr 2017;17:219‐235. [DOI] [PMC free article] [PubMed] [Google Scholar]
- 36. Yang J, Cusimano A, Monga JK, Preziosi ME, Pullara F, Calero G, et al. WNT5A inhibits hepatocyte proliferation and concludes beta‐catenin signaling in liver regeneration. Am J Pathol 2015;185:2194‐2205. [DOI] [PMC free article] [PubMed] [Google Scholar]
Associated Data
This section collects any data citations, data availability statements, or supplementary materials included in this article.
Supplementary Materials
Additional Supporting Information may be found at http://onlinelibrary.wiley.com/doi/10.1002/hep4.1196/full.
Supporting Information 1