

Abstract
We examined a novel farnesoid X receptor agonist, EDP‐305, for its antifibrotic effect in bile duct ligation (BDL) and choline‐deficient, L‐amino acid‐defined, high‐fat diet (CDAHFD) models of hepatic injury. We used molecular magnetic resonance imaging with the type 1 collagen‐binding probe EP‐3533 and the oxidized collagen‐specific probe gadolinium hydrazide to noninvasively measure treatment response. BDL rats (n = 8 for each group) were treated with either low or high doses of EDP‐305 starting on day 4 after BDL and were imaged on day 18. CDAHFD mice (n = 8 for each group) were treated starting at 6 weeks after the diet and were imaged at 12 weeks. Liver tissue was subjected to pathologic and morphometric scoring of fibrosis, hydroxyproline quantitation, and determination of fibrogenic messenger RNA expression. High‐dose EDP‐305 (30 mg/kg) reduced liver fibrosis in both the BDL and CDAHFD models as measured by collagen proportional area, hydroxyproline analysis, and fibrogenic gene expression (all P < 0.05). Magnetic resonance signal intensity with both EP‐3533 in the BDL model and gadolinium hydrazide in the CDAHFD model was reduced with EDP‐305 30 mg/kg treatment (P < 0.01). Histologically, EDP‐305 30 mg/kg halted fibrosis progression in the CDAHFD model. Conclusion: EDP‐305 reduced fibrosis progression in rat BDL and mouse CDAHFD models. Molecular imaging of collagen and oxidized collagen is sensitive to changes in fibrosis and could be used to noninvasively measure treatment response in clinical trials. (Hepatology Communications 2018;2:821‐835)
Abbreviations
- Acta2
actin, alpha 2, smooth muscle, aorta
- BDL
bile duct ligation
- CDAHFD
choline‐deficient high‐fat diet
- COL1A1
collagen type 1 alpha 1
- CPA
collagen proportional area
- FGF
fibroblast growth factor
- FGFR4
fibroblast growth factor receptor 4
- FXR
farnesoid X receptor
- Gd‐Hyd
gadolinium hydrazide
- HSC
hepatic stellate cell
- LOX
lysyl oxidase
- MR
magnetic resonance
- MRI
MR imaging
- mRNA
messenger RNA
- NASH
nonalcoholic steatohepatitis
- OCA
obeticholic acid
- PBC
primary biliary cholangitis
- R1
longitudinal relaxation rate
- RQ
relative quantification
- SHP
small heterodimer protein
- SNR
signal‐to‐noise ratio
Farnesoid X receptor (FXR), a bile acid‐responsive transcription factor, mediates multiple physiologic processes, including lipid metabolism, glucose homeostasis, and enterohepatic circulation of bile acids, and may be hepatoprotective for numerous gastrointestinal disorders, including cholestatic and fatty liver diseases.1, 2, 3 An important pathogenic component of cholestatic liver disease involves toxic bile exposure to hepatocytes.4, 5 Injury to biliary epithelium results in local inflammation, loss of cholangiocyte tight junctions, and extravasation of bile salts, which induce local hepatocyte death and periductular fibrosis. Progressive cycles of inflammation, wound healing, and fibrosis lead to worsened cholestasis and eventually cirrhosis and hepatic failure.6 FXR agonism might counteract the burden of cholestasis through down‐regulation of bile acid production. FXR agonism may also be beneficial for fatty liver disease, which is driven by sublethal lipotoxic hepatocyte injury, resulting in a state of chronic inflammation, stellate cell activation, immune infiltration, and progressive fibrosis.7 FXR stimulation has been shown to reduce hepatic triglyceride production and regulate hepatocyte beta oxidation, potentially mitigating lipotoxic injury.8
Nonalcoholic steatohepatitis (NASH), the active form of nonalcoholic fatty liver disease, and primary biliary cholangitis (PBC), an autoimmune cholestatic condition characterized by progressive injury to the biliary system, are two human conditions for which FXR agonists have been evaluated in clinical trials. In the United States, NASH affects 5% of the general population and up to 25% of patients who undergo bariatric surgery.9, 10 This disorder highly associates with obesity‐related metabolic conditions, and up to 70% of cryptogenic cirrhosis diagnoses may be secondary to unmitigated NASH.11, 12 PBC is a rare disorder, with approximately 20‐40 cases per 100,000 persons, and primarily affects women.13, 14 In 2016, the FXR agonist obeticholic acid (OCA), a semisynthetic derivative of chenodeoxycholic acid, was approved in the United States for treatment of PBC after meeting the primary endpoint of reduced alkaline phosphatase level in a phase III clinical trial. OCA is also currently being tested in a phase III clinical trial for treatment of NASH.
The U.S. Food and Drug Administration, however, recently announced a warning about increased risk of serious liver injury and death associated with OCA in patients with moderate to severe decreases in liver function.15 Moreover, OCA treatment in humans is associated with significant elevation in low‐density lipoprotein cholesterol and reduction of high‐density lipoprotein cholesterol as well as increased pruritis. Therefore, there is an urgent need for newer therapies to treat PBC and NASH.
A historic limitation in the diagnosis and management of cholestatic and fatty liver disorders has been the lack of sensitive and specific noninvasive tests to monitor liver fibrosis.16 Liver biopsy is the current gold standard, but it is invasive with inherent risks, particularly for patients with intrinsic liver disease who are at increased risk of bleeding and infection.17 Molecular imaging of liver fibrosis holds great potential as a noninvasive method for diagnosing and monitoring progression of chronic liver disease. It has the following advantages: first, unlike biopsy, imaging captures the entire organ for a more accurate assessment of disease burden; second, liver imaging is noninvasive, thereby reducing risks and avoiding the need for postprocedural observation; third, due to greater safety and ease of use, molecular imaging provides a better alternative to monitoring response to therapy, particularly for future clinical trial design.
In this study, we test a novel small molecule, nonbile acid, selective FXR agonist, EDP‐305, for its antifibrotic effect in two rodent models of cholestatic and fatty liver injury: bile duct ligation (BDL) in rats and choline‐deficient, L‐amino acid‐defined, high‐fat diet (CDAHFD) in mice. In addition, we noninvasively monitor liver fibrosis and fibrogenesis, our primary pathologic factors of interest, by employing two previously validated molecular magnetic resonance (MR) probes, EP‐3533 and gadolinium hydrazide (Gd‐Hyd), respectively.18, 19, 20, 21, 22
Materials and Methods
CELL CULTURE
Hepatic stellate cell (HSC) lines along with primary HSCs and hepatocytes, between passage 1 and 8, were seeded on uncoated plastic dishes.23 Cells were treated with 10 μM concentration EDP‐305 (dissolved in serum‐free Dulbecco's modified Eagle's medium) and incubated for 72 hours. All cell culture experiments were performed in serum‐free Dulbecco's modified Eagle's medium. Details regarding individual cell lines can be found in the http://onlinelibrary.wiley.com/doi/10.1002/hep4.1193/full.
GENE EXPRESSION
Real‐time quantitative polymerase chain reaction was performed on whole liver and ileum samples from treated and imaged animals.24 Taqman primer sequences (Life Technologies, Carlsbad, CA) can be found in the http://onlinelibrary.wiley.com/doi/10.1002/hep4.1193/full.
WESTERN BLOT
Primary antibodies used for this study included actin (#4970, 1:2,000 dilution; Cell Signaling, Beverly, MA), fibroblast growth factor receptor 4 (FGFR4) (ab119378, 1:1,000 dilution; Abcam, Cambridge, MA), and FXR (A9033A, 1:1,000 dilution; ThermoFisher, Waltham, MA).
ANIMAL MODELS
All experiments were performed in accordance with the National Institutes of Health's Guide for the Care of Use of Laboratory Animals and approved by the Institution's Animal Care and Use Committee. Male CD rats (n = 24) underwent BDL (Charles River Laboratories, Wilmington, MA). Control animals (n = 6) underwent a sham procedure. Male C57BL/6 mice (n = 24) were fed a CDAHFD consisting of 60% kcal fat and 0.1% methionine.25 Control animals (n = 4) were fed normal chow. Drug treatment with EDP‐305 was administered at either 10 mg/kg or 30 mg/kg doses by daily oral gavage. For the BDL model, drug treatments were started on day 4 after BDL and continued until days 17‐18. For the CDAHFD model, drug treatments were started at the beginning of week 6 on the diet and were continued until week 12.
EP‐3533
EP‐3533 comprises a 10‐amino acid cyclic peptide conjugated to three gadopentetate (Gd) moieties by a thiourea linkage. EP‐3533 has a relaxivity of 48.3 mM–1second–1 at 1.4T and binds specifically to type 1 collagen with Kd = 1.8 μM.26, 27
Gd‐Hyd
Gd‐Hyd comprises a 1,4,7,10‐tetraazacyclododecane‐1,4,7,10‐tetraacetate gadolinium chelate conjugated to a hydrazide moiety. Gd‐Hyd has a relaxivity of 4.1 mM–1second–1 at 1.4T and binds specifically to the allysine residues on oxidized collagen. Increased MR signal intensity on T1‐weighted images is proportional to the degree of allysine present in tissue.18
MR IMAGING
Animals were anesthetized with 1%‐2% isoflurane, with body temperature maintained at 37°C. For the BDL model, imaging was performed at 1.5T using a clinical MR imaging (MRI) scanner (Siemens Healthcare, Malvern, PA). Respiratory‐gated, three‐dimensional inversion, recovery images were acquired prior to and 60 minutes following intravenous administration of 10 μmol/kg EP‐3533.20 For the CDAHFD model, imaging was performed at 4.7T using a small bore animal scanner (Bruker, Billerica, MA). Baseline two‐dimensional and three‐dimensional fast low‐angle shot (FLASH) images were acquired before and continuously for 30 minutes after injection of 100 μmol/kg Gd‐Hyd. MR liver signal to noise ratio (SNR) was measured before and 25 minutes after Gd‐Hyd injection, and the relative increase in SNR was computed (% ΔSNR).28 A 2‐point Dixon sequence was used to estimate liver fat content.29 Imaging parameters can be found in the http://onlinelibrary.wiley.com/doi/10.1002/hep4.1193/full.
PATHOLOGIC AND HISTOCHEMICAL ANALYSIS
The grade of steatosis was quantified as follows: grade 1, 5%‐33%; grade 2, 33%‐66%; grade 3, >66%).30 Collagen proportional area (CPA) and hepatic lipid vacuolization were calculated from whole‐slide scanned sections using ImageJ (National Institutes of Health). Hydroxyproline was quantified by high‐performance liquid chromatography analysis.19, 20, 21, 22
SERUM LABORATORY ANALYSIS
A cardiac terminal blood withdrawal was performed at the time of sacrifice, and serum liver proteins, bilirubin, and lipids were measured (DRI‐CHEM 4000 Chemistry Analyzer; Heska AG, Basel, Switzerland).24, 31
STATISTICAL ANALYSIS
Results are expressed as mean ± 1 SD unless otherwise noted. One‐way analysis of variance was followed by post‐hoc Tukey tests with two‐tailed distribution to analyze data among groups of three or more. The Student t test compared data between the control and one experimental group. P < 0.05 was considered significant.
Results
EDP‐305 REDUCES SERUM MARKERS OF LIVER INJURY IN BDL RATS
EDP‐305 treatment had no significant effect on body weight compared to BDL controls (http://onlinelibrary.wiley.com/doi/10.1002/hep4.1193/full). Control BDL livers were significantly larger compared to sham (12 ± 0.6 g versus 19 ± 1.6 g; P ≤ 0.01). Neither FXR agonist significantly affected absolute liver weight compared to BDL control rats. Alanine aminotransferase was significantly reduced (P ≤ 0.01) in both low‐ (67 ± 7 U/L) and high‐dose (62 ± 9 U/L) EDP‐305 treatment groups compared to BDL control (146 ± 28 U/L) (http://onlinelibrary.wiley.com/doi/10.1002/hep4.1193/full). Similarly, aspartate aminotransferase was significantly reduced (P ≤ 0.01) in both low‐ (260 ± 25 U/L) and high‐dose (222 ± 20 U/L) EDP‐305 treatment groups compared to BDL control (684 ± 80 U/L). Total bilirubin was significantly (P ≤ 0.01) increased in all BDL treatment groups compared to the sham group, consistent with the pathogenic mechanism of the model. There was no difference in serum triglyceride values among treatment groups.
EDP‐305 REDUCES LIVER FIBROSIS IN A DOSE‐DEPENDENT MANNER IN BDL RATS
Marked hepatic fibrosis was observed in BDL rats by days 17‐18 (Fig. 1A). There was a dose‐dependent reduction in CPA with low‐dose (17.6% ± 2.5%, P = 0.12) and high‐dose (12.7% ± 1.9%, P ≤ 0.01) EDP‐305 treatment compared to BDL control (22.9% ± 2.2%) (Fig. 1B). These findings were corroborated by hydroxyproline analysis (Fig. 1C); high‐dose EDP‐305 treatment reduced hydroxyproline levels in whole liver tissue samples compared to BDL control (control, 751 ± 46 μg/g versus EDP‐305 30 mg/kg, 562 ± 56 μg/g; P ≤ 0.05). EDP‐305 30 mg/kg also reduced messenger RNA (mRNA) relative quantification (RQ) for both Col1a1 (control, 1.1 ± 0.2 versus EDP‐305 30 mg/kg, 0.58 ± 0.14; P ≤ 0.05) and actin, alpha 2, smooth muscle, aorta (Acta2) (control, 1.0 ± 0.14 versus EDP‐305 30 mg/kg, 0.6 ± 0.16; P ≤ 0.05) (Fig. 1D,E). Taken together, these findings suggest a protective antifibrotic effect by EDP‐305.
Figure 1.
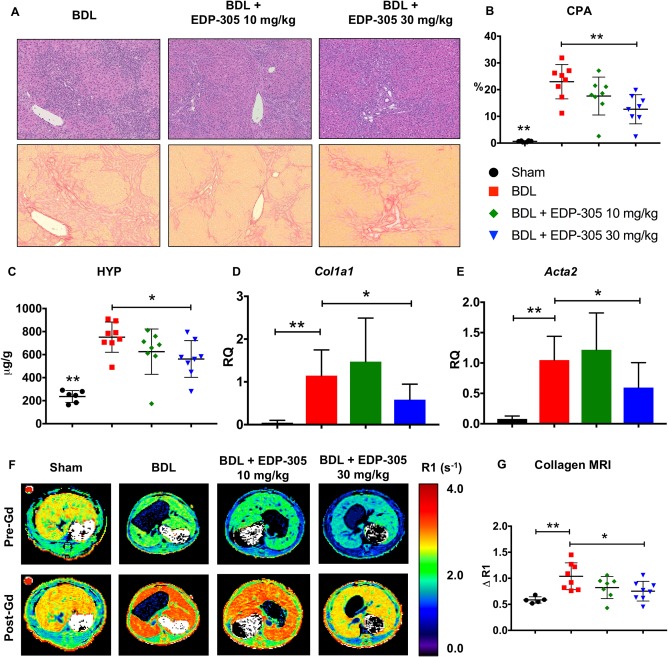
EDP‐305 reduces liver fibrosis in a dose‐dependent manner in BDL rats. (A) Hematoxylin and eosin‐ (top row) and picrosirius red‐ (bottom row) stained liver tissue. Marked hepatic fibrosis and inflammatory infiltrates were observed in BDL‐treated rats by days 17‐18. Whole slide scanned sections shown at 10X magnification. (B) Percentage of collagen proportional area. (C) Hydroxyproline quantitation (μg/g) from whole liver tissue. (D) Whole liver mRNA expression of Col1a1. (E) Whole liver mRNA expression of Acta2. (F) Representative axial R1 map images of the liver for each treatment group before and after injection of the EP‐3533 probe. (G) Change in relaxivity (ΔR1) in liver tissue as a surrogate measure of probe binding. All data shown as mean ± SD. *P < 0.05, **P < 0.01. Abbreviations: Acta2, actin, alpha 2, smooth muscle, aorta; HYP, hydroxyproline.
COLLAGEN MOLECULAR MRI CONFIRMS A REDUCTION IN LIVER FIBROSIS WITH EDP‐305 TREATMENT IN THE BDL MODEL
MR images were acquired before and after contrast injection with the type 1 collagen‐targeted molecular probe EP‐3533, where liver relaxation rate (R1) change is directly proportional to probe uptake and to the degree of tissue fibrosis (Fig. 1F).21 Consistent with the histologic, biochemical, and gene expression assessments of hepatic fibrosis, EDP‐305 30 mg/kg treatment was associated with a reduction in liver ΔR1 compared to BDL control (ΔR1 = 0.75 ± 0.07 second–1 versus 1.04 ± 0.10 second–1, respectively; P ≤ 0.05) (Fig. 1G).
EDP‐305 REDUCES LIVER FIBROSIS IN A DOSE‐DEPENDENT MANNER IN CDAHFD MICE
Mice administered the CDAHFD were smaller compared to mice fed regular chow (P ≤ 0.01), and had less gonadal and visceral fat (Supporting Fig. S2A). Absolute liver weight was significantly greater (P ≤ 0.01) with high‐dose EDP‐305 treatment (2.44 ± 0.06 g) compared to both CDAHFD untreated control (1.81 ± 0.09 g) and regular chow (1.41 ± 0.02 g). Spleen weights were greater (P ≤ 0.05) in mice fed the CDAHFD compared to regular chow (0.09 ± 0.003 g versus 0.07 ± 0.007 g). Compared to mice fed regular chow, mice fed the CDAHFD had elevated aminotransferases including alanine aminotransferase (56 ± 8 U/L versus 193 ± 9 U/L; P ≤ 0.01) and alkaline phosphatase (50 ± 2 U/L versus 100 ± 4 U/L; P ≤ 0.01) (Supporting Fig. S2B). EDP‐305 30 mg/kg (38 ± 4 mg/dL) was associated with reduced (P ≤ 0.01) serum triglycerides compared to regular chow (80 ± 9 mg/dL).
CDAHFD mice exhibited hepatic bridging fibrosis by 12 weeks (Fig. 2A). Collagen deposition, as measured by CPA, was reduced with EDP‐305 30 mg/kg (14.8% ± 1.4%, P ≤ 0.05) compared to CDAHFD untreated control (20.4% ± 1.9%) (Fig. 2B). Similar findings were observed with hydroxyproline analysis; EDP‐305 treatment significantly reduced hydroxyproline in a dose‐dependent manner (EDP‐305 30 mg/kg, 612 ± 39 μg/g; P ≤ 0.01) compared to CDAHFD untreated control (835 ± 29 μg/g) (Fig. 2C). Col1a1 mRNA expression from whole liver was reduced with high‐dose EDP‐305 treatment compared to CDAHFD untreated control (RQ = 1.13 ± 0.12 versus 0.67 ± 0.12; P ≤ 0.05) (Fig. 2D), but no difference in Acta2 mRNA expression was observed among treatment groups (Fig. 2E).
Figure 2.
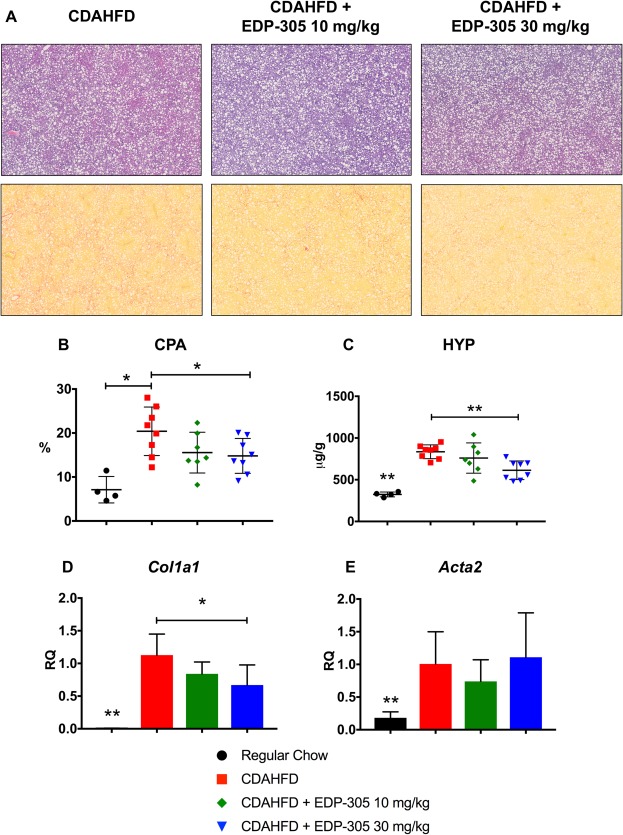
EDP‐305 reduces liver fibrosis in a dose‐dependent manner in CDAHFD mice. (A) Hematoxylin and eosin‐ (top row) and picrosirius red‐ (bottom row) stained liver tissue. Significant steatosis and inflammation is observed in all CDAHFD treatment groups. Whole slide scanned sections shown at 2.5X magnification. (B) Percentage of collagen proportional area. (C) Hydroxyproline quantitation (μg/g) from whole liver tissue. (D) Whole liver Col1a1 mRNA expression. (E) Whole liver alpha smooth muscle actin mRNA expression. All data shown as mean ± SD. *P < 0.05, **P < 0.01. Abbreviations: Acta2, actin, alpha 2, smooth muscle, aorta; HYP, hydroxyproline.
MOLECULAR MRI OF OXIDIZED COLLAGEN CONFIRMS A DOSE‐DEPENDENT REDUCTION IN LIVER FIBROSIS WITH EDP‐305 TREATMENT IN CDAHFD MICE
Lysyl oxidase (LOX) is a quinone‐containing copper‐dependent enzyme that oxidizes the terminal amino group of lysine to a reactive aldehyde (allysine), an essential step in collagen cross‐linking. LOX activity has been shown to be increased in liver fibrosis and contributes to disease pathogenesis.32 Gd‐Hyd binds to allysine residues present in oxidized collagen, providing a noninvasive marker of fibrogenesis (http://onlinelibrary.wiley.com/doi/10.1002/hep4.1193/full). Representative MR images with a Gd‐Hyd probe are shown for each treatment group (Fig. 3A). There was a dose‐dependent reduction in MR liver signal intensity in the EDP‐305 treatment groups compared to the CDAHFD untreated control, which reached significance at the 30‐mg/kg dose (% ΔSNR = 10.7 ± 1.0 versus 6.0 ± 0.8; P ≤ 0.05) (Fig. 3B). Fibrogenesis imaging with Gd‐Hyd significantly correlated with histologic collagen quantitation (R 2 = 0.37, P ≤ 0.01) (Fig. 3C).
Figure 3.
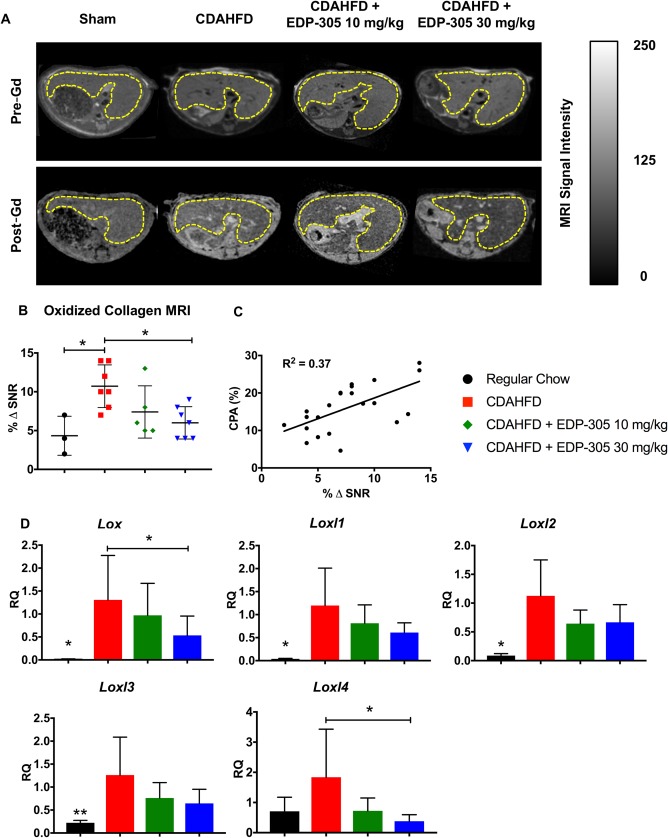
Molecular imaging of oxidized collagen reveals a decrease in liver fibrogenesis with EDP‐305 therapy. (A) Representative T1 MR axial images of the liver for each treatment group using the Gd‐Hyd probe. Liver tissue is outlined in yellow. (B) Percentage change in liver signal to noise ratio (% ΔSNR) 35 minutes after probe injection. (C) Correlation between CPA and % ΔSNR. (D) Lysyl oxidase and lysyl oxidase paralog mRNA expression from whole liver tissue samples. All data shown as mean ± SD. *P < 0.05, **P < 0.01.
We also measured expression of Lox and Loxl1‐4, which are genes responsible for lysyl oxidase enzymatic activity. Expression patterns mirrored our findings with Gd‐Hyd imaging, with EDP‐305 treatment resulting in a dose‐dependent reduction in mRNA expression of lysyl oxidase genes (Fig. 3D).
Taken together, Gd‐Hyd imaging of oxidized collagen closely correlated with histologic, biochemical, and mRNA markers of disease and serves as a novel, noninvasive marker for measuring hepatic fibrogenesis.
EDP‐305 DELAYS PROGRESSION OF HEPATIC INJURY IN THE CDAHFD MODEL OF NASH
To investigate the effect of EDP‐305 on steatosis more thoroughly, liver fat was measured by MRI and compared among cohorts (Fig. 4A,C). Liver fat fraction was increased (P ≤ 0.05) in both EDP‐305 treatment groups (10 mg/kg, 32.5% ± 1.9%; 30 mg/kg, 32.2% ± 1.7%) compared to CDAHFD untreated control (23.6% ± 1.7%). We also assessed lipid vacuolization (percentage), which was also morphometrically quantitated from hematoxylin and eosin‐stained slides of liver samples (Fig. 4B). Compared to mice fed CDAHFD (33.0% ± 1.3%), both EDP‐305 treatment groups were associated with significantly increased (P ≤ 0.05) lipid vacuolization (10 mg/kg, 38.7% ± 0.9%; 30 mg/kg, 39.9% ± 1.2%) (Fig. 4D). There was a strong correlation between the MR estimation of liver fat and the histologic morphometric fat quantification (R 2 = 0.93) (Fig. 4E). These findings indicate that noninvasive assessment of steatosis can be performed during the same MR scans used to measure fibrosis and fibrogenesis to more accurately assess hepatic disease. Finally, pathologic grading of steatosis was performed, although no difference among CDAHFD treatment groups was found (Fig. 4F). Steatosis grading by current criteria appears less sensitive than MR and morphometric quantification techniques.
Figure 4.
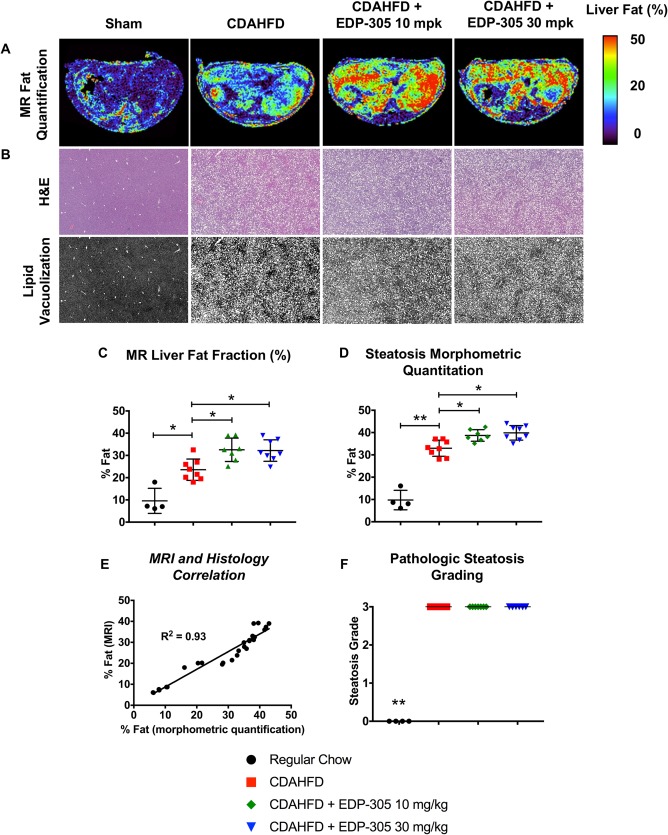
Changes in hepatic steatosis with FXR therapy in CDAHFD mice. (A) Representative liver fat fraction axial images measured by the Dixon MR sequence from each treatment group. (B) Representative H&E images of liver tissue from each experimental group. Slide images were converted to black and white scaling to highlight differences in steatosis. Whole slide scanned sections are shown at 2.5X magnification. (C) Fat fraction (%) in liver tissue using the Dixon MR protocol. (D) Histologic morphometric quantitation of hepatic steatosis. (E) Dixon MR findings highly correlate with histologic morphometric fat quantification. (F) Pathologic grading of steatosis. All data shown as mean ± SD. *P < 0.05, **P < 0.01. Abbreviation: H&E, hematoxylin and eosin.
To contextualize our findings, we performed a natural history experiment in which mice administered CDAHFD were analyzed at 2, 6, 10, and 14 weeks (Fig. 5A). We observed a progressive increase in fibrosis over time by CPA (Fig. 5B). There was diffuse bridging fibrosis with nodularity by 14 weeks, consistent with cirrhosis. Fibrogenic gene expression correlated well with histologic findings. Col1a1 mRNA rapidly increased by approximately 10‐fold within 2 weeks of starting the diet (RQ = 1.0 ± 0.4 versus 10.8 ± 7.9; P ≤ 0.05) and remained stably elevated until week 14 when it increased to approximately 100‐fold greater than regular chow‐fed mice (Fig. 5C). Acta2 expression did not significantly increase until week 10 on the diet (RQ = 1.0 ± 0.5 versus 4.6 ± 1.6; P ≤ 0.01), and remained stably elevated for the duration of the experiment (Fig. 5D).
Figure 5.
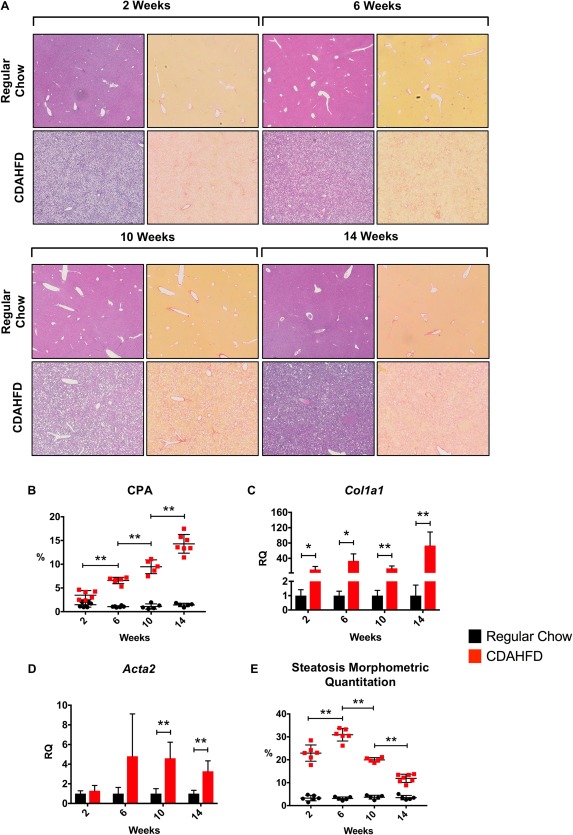
Natural history of the CDAHFD model: early steatosis followed by progressive fibrosis and cirrhosis. (A) CDAHFD and regular chow mice were analyzed at 2, 6, 10, and 14 weeks for fibrosis and steatosis. Hematoxylin and eosin‐ (left) and picrosirius red‐ (right) stained liver tissue for each time point. Whole scanned slide sections are shown at 3.5X magnification. (B) There was a progressive increase in fibrosis throughout the duration of the study by CPA measurement. (C) qPCR expression of Col1a1 mRNA revealed a 10‐fold induction at 2 weeks on CDAHFD and 100‐fold by 14 weeks. (D) qPCR of Acta2 mRNA expression significantly increased by 6 weeks and remained stably elevated. (E) Steatosis increased by 2 weeks, peaked at approximately 6 weeks, after which there was a progressive decline. All data shown as mean ± SD. *P < 0.05, **P < 0.01. Abbreviations: Acta2, actin, alpha 2, smooth muscle, aorta; qPCR, quantitative polymerase chain reaction.
Regarding steatosis, there was an initial increase starting at 2 weeks that peaked at approximately 6 weeks of diet, at which time there was also marked inflammation with fibrous expansion of portal tracts and occasional bridging septa. Beyond week 6, there was a progressive decline in hepatic lipid content as liver injury and fibrosis worsened (Fig. 5E). By week 14, livers were cirrhotic with minimal steatosis.
The CDAHFD model produces rapid and severe lipotoxic hepatic injury by preventing very low‐density lipoprotein production and hepatocyte lipid transport.25 As evidenced by the natural history experiment, the capacity to store lipid is a marker of retained hepatocyte function that dissipates shortly after 6 weeks of diet. A similar pattern of progressive fibrosis and decreasing steatosis is observed in the human form of NASH: fatty liver progresses to steatohepatiitis, followed by worsening fibrosis over years that culminates in cirrhosis, at which point minimal hepatic fat is observed.
In this context, we compared histologic samples from the CDAHFD natural history experiment with animals treated with FXR agonists. CDAHFD untreated control animals at 12 weeks appeared similar to the 10‐week time point, as expected, with marked portal‐to‐portal and portal‐to‐central bridging fibrosis, significant inflammation, and reduced steatosis. In contrast, the histology from both EDP‐305 treatment groups appeared more similar to the 6‐week time point, with less fibrosis and increased steatosis. Given that these mice were on the diet for 6 weeks prior to an additional 6 weeks of the diet with the drug, this observation suggests that EDP‐305 halted disease progression and retained hepatocyte lipid storage function.
EDP‐305 ACTIVATES FXR SIGNALING IN HEPATOCYTES BUT NOT STELLATE CELLS
The FXR pathway is active in multiple tissue types, including liver, ileum, fat, and muscle. It is not well established in which organs the pathway must be stimulated to observe an antifibrotic effect in the liver, although endocrine signaling from the terminal ileum and direct hepatic stimulation are suspected to be most relevant. We thus examined FXR pathway expression in liver and ileum of mice treated with EDP‐305. Mice that were imaged received their last dose of drug 24 hours prior to sacrifice when the drug had already cleared. We therefore performed an additional experiment in which C57BL/6 mice aged 8‐10 weeks were treated with EDP‐305 by oral gavage for 5 days. FXR target gene expression in liver and intestine were determined by real‐time polymerase chain reaction 4 hours after the last dose. EDP‐305 was observed to have direct effects on the terminal ileum and liver. In the small intestine, EDP‐305 treatment resulted in a dose‐dependent induction in fibroblast growth factor 15 (Fgf15) mRNA (http://onlinelibrary.wiley.com/doi/10.1002/hep4.1193/full). In the liver, EDP‐305 resulted in a dose‐dependent induction in small heterodimer partner (Shp) mRNA and concomitant reduction in cholesterol 7‐alpha‐monooxygenase (Cyp7a1) expression (http://onlinelibrary.wiley.com/doi/10.1002/hep4.1193/full).
Given the observed direct hepatic effect, we next explored baseline FXR‐related gene expression in untreated primary human hepatocytes, primary human stellate cells, and multiple immortalized human, mouse, and rat HSC lines in vitro to better understand FXR signaling in the liver (Fig. 6A). Primary human hepatocytes expressed mRNA for FXR and its downstream targets SHP and FGF19, as well as FGFR4, the transmembrane receptor for FGF19. We did not observe baseline expression of FXR or its downstream targets in isolated primary human HSCs, although we did observe low‐level expression of FGFR4 mRNA. The immortalized human stellate cell line LX2 expressed low levels of mRNA for FXR, SHP, and FGFR4 but not FGF19, whereas TWNT4, another immortalized human stellate line, expressed no mRNA for these genes. B8 immortalized rat stellate cells and immortalized mouse stellate cells both expressed low levels of Fxr and Fgfr4 mRNA.
Figure 6.
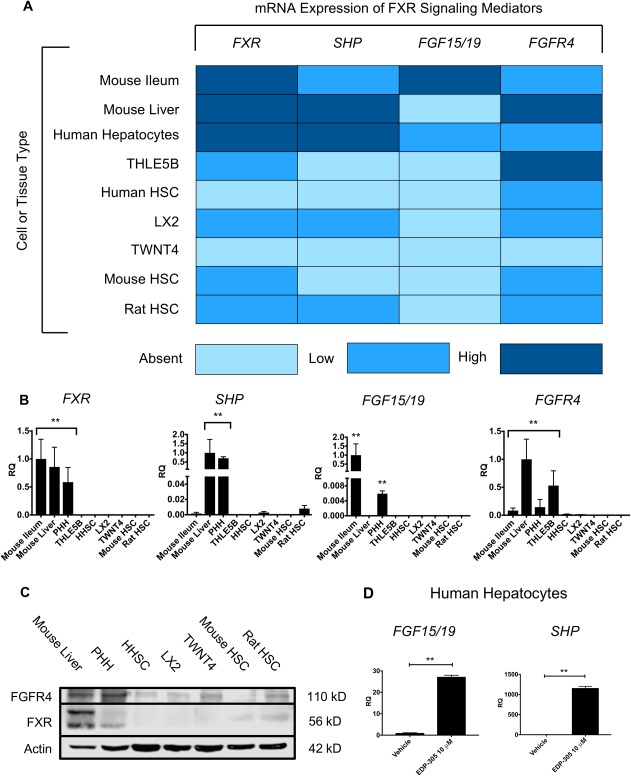
EDP‐305 directly activates liver hepatoctyes but not stellate cells. (A) Liver, ileum, hepatocyte, and stellate cell mRNA for FXR, SHP, FGF19, and FGFR4. Light blue represents no expression, blue represents low expression, and dark blue represents high expression. (B) Stellate cell lines had insignificant mRNA expression of FXR‐related genes relative to hepatocytes and mouse whole liver tissue. (C) FXR and FGFR4 protein expression with western blot. (D) EDP‐305‐induced mRNA expression of FGF19 and SHP in primary human hepatocytes. All data shown as mean ± SD. *P < 0.05, **P < 0.01. Abbreviations: PHH, primary human hepatocytes; HHSC, human hepatic stellate cells.
Relative to hepatocytes and mouse whole liver samples, all stellate cell lines had insignificant expression of FXR‐related genes (Fig. 6B). These findings were corroborated by FXR and FGFR4 protein expression on western blot (Fig. 6C). Both proteins were highly expressed in whole mouse liver and primary human hepatocytes, suggesting possible biologic relevance for both direct hepatic FXR stimulation and endocrine FGF15/19 signaling from the terminal ileum by portal circulation. In contrast, primary human HSCs and all stellate lines had significantly lower expression of FGFR4, and only faint FXR expression was observed in B8 rat stellate cells. Treatment of serum‐starved human hepatocytes in culture with EDP‐305 at 10 μM for 72 hours induced mRNA expression of SHP and FGF19 (Fig. 6D). However, of the stellate lines that expressed FXR mRNA, treatment in vitro with EDP‐305 elicited no induction of downstream targets SHP or FGF15/19 (data not shown). These findings indicate that FXR is expressed at higher levels in hepatocytes compared to stellate cells, and evidence of FXR pathway activation was only present in hepatocytes.
Similar findings have been reported. Fickert et al.33 evaluated FXR expression in mice and humans, and similar to our current findings, they observed low/nonexistent levels of FXR in HSCs and myofibroblasts but higher levels in hepatocytes. However, other studies have also reported FXR protein expression in isolated primary rat HSCs and the immortalized line HSC‐T6.34 Taken together, these findings suggest that hepatic FXR agonism, at least in mice and humans, is unlikely to directly affect stellate cells.
Discussion
EDP‐305 is a steroidal noncarboxylic acid FXR agonist that is currently in clinical trials for NASH and PBC.35, 36, 37, 38 We observed significant reductions in liver fibrosis with EDP‐305 in two rodent models of hepatic injury, corroborated by multiple methodologies, including picrosirius red collagen staining, hydroxyproline biochemical quantification, gene expression analyses, and noninvasive molecular imaging. This study represents the first published data for EDP‐305 showing a potent and consistent antifibrotic effect in vivo in animal models of cholestatic and nonalcoholic fatty liver injury.
We chose hepatic fibrosis as the primary endpoint of our study because it is a critical pathogenic component of chronic liver injury and cirrhosis. Fibrosis secondary to either biliary or direct hepatocyte damage is driven primarily by myofibroblastic activation of HSCs, which deposit dense networks of extracellular matrix, including proteoglycans and collagens.39, 40 It is thought that fibrosis is a natural wound healing response that goes awry in the setting of persistent tissue injury. As fibrosis becomes more severe, it may have multiple negative effects in the liver, including obstruction of biliary canaliculi, venous congestion, and support of a proinflammatory milieu through HSC‐mediated secretion of inflammatory signaling molecules.41 These processes may exacerbate the effects from ongoing hepatic insults, contributing to progressive liver failure. Therefore, mitigation of fibrosis in the setting of chronic liver disease has become a therapeutic goal in and of itself.
Our focus on liver fibrosis influenced our selection of rodent models for hepatic injury. Choosing the appropriate animal model for studying cholestatic and fatty liver injury can be a challenging endeavor as currently available models recapitulate only certain aspects of human disease. NASH is typically observed in patients with obesity and associates with metabolic syndromes, including hypertension and insulin resistance. However, simultaneously establishing metabolic dysregulation and steatohepatitis that leads to progressive liver failure has proven difficult, and currently available models typically accentuate either the metabolic or the hepatotoxic components.42 In this regard, the Western diet, consisting of high fat and high fructose, most accurately captures the dietary habits of humans, and indeed obesity and insulin resistance are observed.43 However, this model requires multiple months to develop evidence of hepatic fibrosis, which remains mild to moderate in severity throughout the course of disease. The CDAHFD lacks the metabolic derangements observed in NASH, but the choline deficiency provides a severe lipotoxic hepatic injury and robust fibrotic response.25 We therefore chose to use a choline‐deficiency model despite the acknowledged metabolic limitations. Other hepatocyte injury models, including amylin liver NASH and genetically engineered mutant strains, induce only modest inflammation and fibrosis compared to choline deficiency.
Similarly, PBC is thought to be an autoimmune process targeting epithelial cholangiocytes, which results in biliary injury, cholestasis, and eventually cirrhosis and hepatic failure.44 Multiple cholestatic rodent models exist, and some recapitulate certain immunologic features of PBC. However, these models are associated with only mild hepatic fibrosis. Conversely, the BDL model bares no immunologic resemblance to PBC, although the profound cholestatic injury in this model induces a robust fibrotic response that more accurately mirrors severe stages of human cholestatic disease.
Based on our in vitro data, the antifibrotic effects of FXR agonism observed with EDP‐305 are likely mediated by direct hepatocyte signaling with secondary effects on stellate cells. The minimal expression of FXR pathway components that we observed in mouse and human HSCs did not appear biologically relevant based on gene and protein expression analyses. This was supported by a lack of induction of putative FXR target genes with agonist treatment in vitro. Interestingly, we did observe expression of FXR in rat HSCs, albeit at a low level. Fiorucci et al.34 showed that FXR agonism in rat HSCs was associated with an induction of SHP with concomitant reductions in Col1a1, Acta2, and transforming growth factor‐beta. Taken together, these findings indicate that FXR signaling in HSCs may be species dependent.
Finally, molecular MR imaging of type 1 collagen (EP‐3533) and oxidized collagen (Gd‐Hyd) in the BDL and CDAHFD models, respectively, are sensitive measures for detecting changes in fibrosis in response to treatment and were consistent with other biochemical and gene expression analyses. The imaging methods used in this study thus have potential for future clinical application.19, 21 Other modalities for imaging hepatic fibrosis are being trialed. Fibrosis results in an overproduction of matrix proteins that cause tissue stiffness, which can be measured by elastography.45 Ultrasound and MR‐based elastography are two promising modalities that are currently used in the clinical setting.46, 47 Our group previously compared MR elastography and EP‐3533 in a diethylnitrosamine‐induced model of rat fibrosis and found that collagen imaging was more sensitive at earlier stages of fibrosis and may provide value in this regard.22 Further comparison between MR elastography and collagen molecular imaging is thus needed.
In conclusion, EDP‐305 demonstrated its ability to reduce liver injury and hepatic fibrosis progression. These findings indicate that EDP‐305 may have clinical relevance for the treatment of human conditions characterized by biliary or hepatic fibrosis.
Author names in bold designate shared co‐first authorship.
Supporting information
Additional Supporting Information may be found at http://onlinelibrary.wiley.com/doi/10.1002/hep4.1193/full.
Supporting Information
Supporting Information
Supporting Information Figure S1
Supporting Information Figure S2
Supporting Information Figure S3
Supporting Information Figure S4
Potential conflict of interest: Dr. Fuchs received grants from Enanta. Dr. Caravan consults for Bayer, Guerbet, and Collagen Medical LLC and has received grants from Pfizer and Pliant. Dr. Tanabe consults for Best Doctors; he is on the Board of Directors and owns stock in Helix12 and has received royalties from UpToDate. Dr. Wang and Dr. Or are employed by and own stock in Enanta. Dr. Li is employed by Enanta. The other authors have nothing to report.
Supported by the National Institutes of Health (DK104956 and DK104302 to B.C.F.) and Enanta Pharmaceuticals (research grant to B.C.F.).
REFERENCES
- 1. Fang S, Suh JM, Reilly SM, Yu E, Osborn O, Lackey D, et al. Intestinal FXR agonism promotes adipose tissue browning and reduces obesity and insulin resistance. Nat Med 2015;21:159‐165. [DOI] [PMC free article] [PubMed] [Google Scholar]
- 2. Kim KH, Choi S, Zhou Y, Kim EY, Lee JM, Saha PK, et al. Hepatic FXR/SHP axis modulates systemic glucose and fatty acid homeostasis in aged mice. Hepatology 2017;66:498‐509. [DOI] [PMC free article] [PubMed] [Google Scholar]
- 3. Sinal CJ, Tohkin M, Miyata M, Ward JM, Lambert G, Gonzalez FJ. Targeted disruption of the nuclear receptor FXR/BAR impairs bile acid and lipid homeostasis. Cell 2000;102:731‐744. [DOI] [PubMed] [Google Scholar]
- 4. Pollheimer MJ, Halilbasic E, Fickert P, Trauner M. Pathogenesis of primary sclerosing cholangitis. Best Pract Res Clin Gastroenterol 2011;25:727‐739. [DOI] [PMC free article] [PubMed] [Google Scholar]
- 5. Thompson MD, Moghe A, Cornuet P, Marino R, Tian J, Wang P, et al. beta‐Catenin regulation of farnesoid X receptor signaling and bile acid metabolism during murine cholestasis. Hepatology 2018;67:955‐971. [DOI] [PMC free article] [PubMed] [Google Scholar]
- 6. Fischer S, Beuers U, Spengler U, Zwiebel FM, Koebe HG. Hepatic levels of bile acids in end‐stage chronic cholestatic liver disease. Clin Chim Acta 1996;251:173‐186. [DOI] [PubMed] [Google Scholar]
- 7. Ibrahim SH, Hirsova P, Gores GJ. Non‐alcoholic steatohepatitis pathogenesis: sublethal hepatocyte injury as a driver of liver inflammation. Gut 2018;67:963‐972. [DOI] [PMC free article] [PubMed] [Google Scholar]
- 8. Xu J, Li Y, Chen WD, Xu Y, Yin L, Ge X, et al. Hepatic carboxylesterase 1 is essential for both normal and farnesoid X receptor‐controlled lipid homeostasis. Hepatology 2014;59:1761‐1771. [DOI] [PMC free article] [PubMed] [Google Scholar]
- 9. Ong JP, Younossi ZM. Epidemiology and natural history of NAFLD and NASH. Clin Liver Dis 2007;11:1‐16. [DOI] [PubMed] [Google Scholar]
- 10. Sayiner M, Koenig A, Henry L, Younossi ZM. Epidemiology of nonalcoholic fatty liver disease and nonalcoholic steatohepatitis in the United States and the rest of the world. Clin Liver Dis 2016;20:205‐214. [DOI] [PubMed] [Google Scholar]
- 11. Poonawala A, Nair SP, Thuluvath PJ. Prevalence of obesity and diabetes in patients with cryptogenic cirrhosis: a case‐control study. Hepatology 2000;32:689‐692. [DOI] [PubMed] [Google Scholar]
- 12. Diehl AM. Nonalcoholic steatosis and steatohepatitis IV. Nonalcoholic fatty liver disease abnormalities in macrophage function and cytokines. Am J Physiol Gastrointest Liver Physiol 2002;282:G1‐G5. [DOI] [PubMed] [Google Scholar]
- 13. Lindor KD, Gershwin ME, Poupon R, Kaplan M, Bergasa NV, Heathcote EJ, et al.; American Association for Study of Liver Diseases . Primary biliary cirrhosis. Hepatology 2009;50:291‐308. [DOI] [PubMed] [Google Scholar]
- 14. Carey EJ, Ali AH, Lindor KD. Primary biliary cirrhosis. Lancet 2015;386:1565‐1575. Erratum in: Lancet 2015;386:1536. [DOI] [PubMed] [Google Scholar]
- 15. U.S. Food & Drug Administration . FDA Drug Safety Communication: FDA warns about serious liver injury with Ocaliva (obeticholic acid) for rare chronic liver disease. https://www.fda.gov/Drugs/DrugSafety/ucm576656.htm. Published September 21, 2017. Accessed September 2017.
- 16. Motola DL, Caravan P, Chung RT, Fuchs BC. Noninvasive biomarkers of liver fibrosis: clinical applications and future directions. Curr Pathobiol Rep 2014;2:245‐256. [DOI] [PMC free article] [PubMed] [Google Scholar]
- 17. Terjung B, Lemnitzer I, Dumoulin FL, Effenberger W, Brackmann HH, Sauerbruch T, et al. Bleeding complications after percutaneous liver biopsy. An analysis of risk factors. Digestion 2003;67:138‐145. [DOI] [PubMed] [Google Scholar]
- 18. Chen HH, Waghorn PA, Wei L, Tapias LF, Schu Hle DT, Rotile NJ, et al. Molecular imaging of oxidized collagen quantifies pulmonary and hepatic fibrogenesis. JCI Insight 2017;2. [DOI] [PMC free article] [PubMed] [Google Scholar]
- 19. Fuchs BC, Wang H, Yang Y, Wei L, Polasek M, Schühle DT, et al. Molecular MRI of collagen to diagnose and stage liver fibrosis. J Hepatol 2013;59:992‐998. [DOI] [PMC free article] [PubMed] [Google Scholar]
- 20. Farrar CT, DePeralta DK, Day H, Rietz TA, Wei L, Lauwers GY, et al. 3D molecular MR imaging of liver fibrosis and response to rapamycin therapy in a bile duct ligation rat model. J Hepatol 2015;63:689‐696. [DOI] [PMC free article] [PubMed] [Google Scholar]
- 21. Polasek M, Fuchs BC, Uppal R, Schühle DT, Alford JK, Loving GS, et al. Molecular MR imaging of liver fibrosis: a feasibility study using rat and mouse models. J Hepatol 2012;57:549‐555. [DOI] [PMC free article] [PubMed] [Google Scholar]
- 22. Zhu B, Wei L, Rotile N, Day H, Rietz T, Farrar CT, et al. Combined magnetic resonance elastography and collagen molecular magnetic resonance imaging accurately stage liver fibrosis in a rat model. Hepatology 2017;65:1015‐1025. [DOI] [PMC free article] [PubMed] [Google Scholar]
- 23. Pfeifer AM, Cole KE, Smoot DT, Weston A, Groopman JD, Shields PG, et al. Simian virus 40 large tumor antigen‐immortalized normal human liver epithelial cells express hepatocyte characteristics and metabolize chemical carcinogens. Proc Natl Acad Sci U S A 1993;90:5123‐5127. [DOI] [PMC free article] [PubMed] [Google Scholar]
- 24. DePeralta DK, Wei L, Ghoshal S, Schmidt B, Lauwers GY, Lanuti M, et al. Metformin prevents hepatocellular carcinoma development by suppressing hepatic progenitor cell activation in a rat model of cirrhosis. Cancer 2016;122:1216‐1227. [DOI] [PMC free article] [PubMed] [Google Scholar]
- 25. Matsumoto M, Hada N, Sakamaki Y, Uno A, Shiga T, Tanaka C, et al. An improved mouse model that rapidly develops fibrosis in non‐alcoholic steatohepatitis. Int J Exp Pathol 2013;94:93‐103. [DOI] [PMC free article] [PubMed] [Google Scholar]
- 26. Caravan P, Das B, Dumas S, Epstein FH, Helm PA, Jacques V, et al. Collagen‐targeted MRI contrast agent for molecular imaging of fibrosis. Angew Chem Int Ed Engl 2007;46:8171‐8173. [DOI] [PubMed] [Google Scholar]
- 27. Helm PA, Caravan P, French BA, Jacques V, Shen L, Xu Y, et al. Postinfarction myocardial scarring in mice: molecular MR imaging with use of a collagen‐targeting contrast agent. Radiology 2008;247:788‐796. [DOI] [PMC free article] [PubMed] [Google Scholar]
- 28. Caravan P, Yang Y, Zachariah R, Schmitt A, Mino‐Kenudson M, Chen HH, et al. Molecular magnetic resonance imaging of pulmonary fibrosis in mice. Am J Respir Cell Mol Biol 2013;49:1120‐1126. [DOI] [PMC free article] [PubMed] [Google Scholar]
- 29. Dixon WT. Simple proton spectroscopic imaging. Radiology 1984;153:189‐194. [DOI] [PubMed] [Google Scholar]
- 30. Murayama KM, Barent BL, Gruber M, Brooks A, Eliason S, Brunt EM, et al. Characterization of a novel model of pancreatic fibrosis and acinar atrophy. J Gastrointest Surg 1999;3:418‐425. [DOI] [PubMed] [Google Scholar]
- 31. Fuchs BC, Hoshida Y, Fujii T, Wei L, Yamada S, Lauwers GY, et al. Epidermal growth factor receptor inhibition attenuates liver fibrosis and development of hepatocellular carcinoma. Hepatology 2014;59:1577‐1590. [DOI] [PMC free article] [PubMed] [Google Scholar]
- 32. Ikenaga N, Peng ZW, Vaid KA, Liu SB, Yoshida S, Sverdlov DY, et al. Selective targeting of lysyl oxidase‐like 2 (LOXL2) suppresses hepatic fibrosis progression and accelerates its reversal. Gut 2017;66:1697‐1708. [DOI] [PMC free article] [PubMed] [Google Scholar]
- 33. Fickert P, Fuchsbichler A, Moustafa T, Wagner M, Zollner G, Halilbasic E, et al. Farnesoid X receptor critically determines the fibrotic response in mice but is expressed to a low extent in human hepatic stellate cells and periductal myofibroblasts. Am J Pathol 2009;175:2392‐2405. [DOI] [PMC free article] [PubMed] [Google Scholar]
- 34. Fiorucci S, Antonelli E, Rizzo G, Renga B, Mencarelli A, Riccardi L, et al. The nuclear receptor SHP mediates inhibition of hepatic stellate cells by FXR and protects against liver fibrosis. Gastroenterology 2004;127:1497‐1512. [DOI] [PubMed] [Google Scholar]
- 35. National Institutes of Health . Study of safety and efficacy of tropifexor (LJN452) in patients with non‐alcoholic steatohepatitis (NASH)(FLIGHT‐FXR). https://ClinicalTrials.gov/show/NCT02855164. Published August 4, 2016. Accessed February 2018.
- 36. National Institutes of Health . The farnesoid X receptor (FXR) ligand obeticholic acid in NASH treatment trial (FLINT) (FLINT). https://ClinicalTrials.gov/show/NCT01265498. Published December 23, 2010. Accessed February 2018.
- 37. National Institutes of Health . Phase 3 study of obeticholic acid in patients with primary biliary cirrhosis (POISE). https://ClinicalTrials.gov/show/NCT01473524. Published November 17, 2011. Accessed February 2018.
- 38. National Institutes of Health . Phase 4 study of obeticholic acid evaluating clinical outcomes in patients with primary biliary cholangitis (COBALT). https://ClinicalTrials.gov/show/NCT02308111. Published December 4, 2014. Accessed February 2018.
- 39. Schuppan D, Surabattula R, Wang XY. Determinants of fibrosis progression and regression in NASH. J Hepatol 2018;68:238‐250. [DOI] [PubMed] [Google Scholar]
- 40. Hirschfield GM, Gershwin ME. The immunobiology and pathophysiology of primary biliary cirrhosis. Annu Rev Pathol 2013;8:303‐330. [DOI] [PubMed] [Google Scholar]
- 41. Zhou WC, Zhang QB, Qiao L. Pathogenesis of liver cirrhosis. World J Gastroenterol 2014;20:7312‐7324. [DOI] [PMC free article] [PubMed] [Google Scholar]
- 42. Haczeyni F, Yeh MM, Ioannou GN, Leclercq IA, Goldin R, Dan YY, et al. Mouse models of nonalcoholic steatohepatitis: a reflection on recent literature. J Gastroenterol Hepatol 2018; doi: 10.1111/jgh.14122. [DOI] [PubMed] [Google Scholar]
- 43. Henkel J, Coleman CD, Schraplau A, Jöhrens K, Weber D, Castro JP, et al. Induction of steatohepatitis (NASH) with insulin resistance in wildtype B6 mice by a western‐type diet containing soybean oil and cholesterol. Mol Med 2017;23. [DOI] [PMC free article] [PubMed] [Google Scholar]
- 44. Hargrove L, Kennedy L, Demieville J, Jones H, Meng F, DeMorrow S, et al. Bile duct ligation‐induced biliary hyperplasia, hepatic injury, and fibrosis are reduced in mast cell‐deficient Kit(W‐sh) mice. Hepatology 2017;65:1991‐2004. [DOI] [PMC free article] [PubMed] [Google Scholar]
- 45. Kawamoto M, Mizuguchi T, Katsuramaki T, Nagayama M, Oshima H, Kawasaki H, et al. Assessment of liver fibrosis by a noninvasive method of transient elastography and biochemical markers. World J Gastroenterol 2006;12:4325‐4330. [DOI] [PMC free article] [PubMed] [Google Scholar]
- 46. Wang Y, Ganger DR, Levitsky J, Sternick LA, McCarthy RJ, Chen ZE, et al. Assessment of chronic hepatitis and fibrosis: comparison of MR elastography and diffusion‐weighted imaging. AJR Am J Roentgenol 2011;196:553‐561. [DOI] [PMC free article] [PubMed] [Google Scholar]
- 47. Cui J, Ang B, Haufe W, Hernandez C, Verna EC, Sirlin CB, et al. Comparative diagnostic accuracy of magnetic resonance elastography vs. eight clinical prediction rules for non‐invasive diagnosis of advanced fibrosis in biopsy‐proven non‐alcoholic fatty liver disease: a prospective study. Aliment Pharmacol Ther 2015;41:1271‐1280. [DOI] [PMC free article] [PubMed] [Google Scholar]
Associated Data
This section collects any data citations, data availability statements, or supplementary materials included in this article.
Supplementary Materials
Additional Supporting Information may be found at http://onlinelibrary.wiley.com/doi/10.1002/hep4.1193/full.
Supporting Information
Supporting Information
Supporting Information Figure S1
Supporting Information Figure S2
Supporting Information Figure S3
Supporting Information Figure S4