

Abstract
The recent identification of compounds that interact with the spliceosome (sudemycins, spliceostatin A, and meayamycin) indicates that these molecules modulate aberrant splicing via SF3B1 inhibition. Through whole transcriptome sequencing, we have demonstrated that treatment of Rh18 cells with sudemycin leads to exon skipping as the predominant aberrant splicing event. This was also observed following reanalysis of published RNA-seq data sets derived from HeLa cells after spliceostatin A exposure. These results are in contrast to previous reports that indicate that intron retention was the major consequence of SF3B1 inhibition. Analysis of the exon junctions up-regulated by these small molecules indicated that these sequences were absent in annotated human genes, suggesting that aberrant splicing events yielded novel RNA transcripts. Interestingly, the length of preferred downstream exons was significantly longer than the skipped exons, although there was no difference between the lengths of introns flanking skipped exons. The reading frame of the aberrantly skipped exons maintained a ratio of 2:1:1, close to that of the cassette exons (3:1:1) present in naturally occurring isoforms, suggesting negative selection by the nonsense-mediated decay (NMD) machinery for out-of-frame transcripts. Accordingly, genes involved in NMD and RNAs encoding proteins involved in the splicing process were enriched in both data sets. Our findings, therefore, further elucidate the mechanisms by which SF3B1 inhibition modulates pre-mRNA splicing.
Keywords: exon skipping, RNA-seq, SF3B1, spliceosome, sudemycin
INTRODUCTION
The spliceosome is a macromolecular complex present within mammalian cells that is responsible for the high-fidelity editing of nascent RNAs to yield bona fide mRNAs. This involves the coordinated action of 5U snRNAs and ∼150 proteins. Recently, somatic mutations have been reported in multiple spliceosome splicing factors (including SF3B1, U2AF1, and SRSF2) in tumors (Visconte et al. 2012) , suggesting that accurate and efficient generation of mRNAs is crucial for maintaining transcriptome integrity. For example, the highly recurrent gain of function mutation K700E in SF3B1 has been shown to introduce alternative 3′-splice sites in a subset of genes that contributes to myleodysplastic syndrome (Darman et al. 2015). Concurrent with the above work, several groups have developed highly specific inhibitors of the spliceosome, typically targeting SF3B1, which result in significant disruption of RNA splicing. Furthermore, these agents appear to demonstrate tumor-specific cytotoxicity (Fan et al. 2011). Therefore, understanding the molecular consequences of the modulation of splicing in both normal and tumor cells following exposure to these inhibitors may yield information that will allow for the development of highly specific tumor-selective anticancer agents.
Several natural products (FR901464, pladienolide B, herboxidiene) have been identified that interact with the Sf3b subunit of the spliceosome (Nakajima et al. 1996; Mizui et al. 2004; Fan et al. 2011; Hasegawa et al. 2011), and these compounds have been demonstrated to be potent antitumor agents, and minimally toxic to normal cells. As a consequence, clinical trials using E7107 (a pladienolide analog) have been initiated; however, such studies have recently been halted due to visual toxicity in treated patients (Eskens et al. 2013; Hong et al. 2014). Based upon a defined pharmacophore for these spliceosome inhibitors, we have developed a chemically tractable class of agents, termed sudemycins (Fig. 1A), that are highly potent modulators of RNA splicing. In vitro analyses with exon junction arrays have indicated that these compounds modulate aberrant splicing (AS) in a time- and dose-dependent fashion, and that this effect was more pronounced in tumor versus normal cells (Convertini et al. 2014). These experiments evaluated the effects of the spliceosome modulators on the change in RNA splicing for a few selected genes using low throughput analyses (RT-PCR). Clear examples of changes in AS were identified (e.g., MDM2) that occurred not only in tissue culture, but also in human tumor xenografts grown in immune-deprived animals (Fan et al. 2011). Since these effects were significantly reduced (or absent) in normal cells and tissues (Fan et al. 2011), the induction of AS may potentially act as a mediator of the toxicity imparted by such agents.
FIGURE 1.

Aberrant splicing induced by sudemycin D1. (A) The chemical structure of sudemycin D1 and E. (B) Sudemycin D1 and E result in AS of MDM2 following exposure of Rh18 cells. M—Molecular weight markers; C—untreated cells; D—cells treated with 1 µM sudemycin D1 for 8 h; 0.1, 1, 10—cells treated with the corresponding concentration (µM) of sudemycin E for 8 h. Ubiqutin (UBQ) was used as a control for these analyses. Size markers are indicated in kbp with individual transcript sizes in bp (in parentheses). (C) RT/PCR controls to demonstrate that no DNA (H), and samples lacking reverse transcriptase (RNA obtained from cells treated with either 0.1 µM [D-RT 0.1] or 1 µM [D-RT 1] sudemycin D1), do not yield signals following PCR. (D) PCR analysis of MDM2 transcripts following siRNA treatment of Rh18 cells. M—Molecular weight markers; C—untreated cells. SF3B1 Pool—pool of four siRNAs targeting SF3B1; 13, 14 and 15—individual siRNAs present within the SF3B1 Pool. Ubiqutin (UBQ) was used as a control for these analyses. (E) Western analyses demonstrating the loss of SF3B1 protein in Rh18 cells following treatment with pooled or individual siRNAs that target the RNA encoding this protein. Tubulin (Tub) was used as a loading control.
To evaluate this further, we have undertaken whole-transcriptome analysis of the rhabdomyosarcoma cell line Rh18 following treatment with sudemycin D1 (Fig. 1A). We reasoned that detailing and understanding the changes in the levels of all RNAs (generated from both known and novel AS events) in drug-treated cells would provide an important data set that may identify novel mechanisms by which cytotoxicity is induced. In parallel, we also reanalyzed the two public data sets where HeLa cells have been exposed to spliceostatin A (a methylated derivative of FR901464), an event that leads to the nonproductive recruitment of U2 snRNP (GSE72055 and GSE72156 [Tseng et al. 2015; Yoshimoto et al. 2017]) to the spliceosome. Our results demonstrate that exon skipping is the major molecular effect induced by both sudemycin and spliceostatin A treatment, even in disparate cell lines, and with different spliceosome inhibitors.
RESULTS
Modulation of RNA splicing by sudemycins is comparable to that seen with loss of SF3B1
Treatment of the rhabdomyosarcoma cell line Rh18 with either sudemycin D1 or E (Fig. 1A) results in significant modulation of RNA splicing. This is exemplified by the change in the levels of the different MDM2 transcripts following exposure to either drug (Fig. 1B; see also Supplemental Fig. S1). Since SF3B1 has been demonstrated to be the molecular target for these compounds, we evaluated whether siRNA-mediated depletion of this protein would induce changes in AS of selected RNAs in Rh18 cells. Studies were performed using a pool of siRNA molecules targeting SF3B1, as well as with the individual component RNAs. As indicated in Figure 1C, loss of SF3B1 protein induced changes in MDM2 splicing, consistent with that seen with sudemycin drug exposure. The pool of siRNAs consisted of four different RNAs, so three of the individual reagents were purchased, and we assessed the ability of these molecules to induce changes in MDM2 splicing, as well as to reduce SF3B1 protein levels. As can be seen in Figure 1C, siRNAs 13 and 14 resulted in an alteration of the MDM2 transcript pattern, with concomitant loss of SF3B1. Changes in the splicing pattern for a further five genes were also noted and yielded identical modifications as compared to sudemycin D1 exposure (see Supplemental Fig. S2). siRNA 15 was considerably less effective at reducing SF3B1 protein and demonstrated minimal effects on MDM2 splicing. As expected, none of these reagents affected the levels of the control transcript (ubiquitin) or protein (β-tubulin). These results therefore indicate that exposure of Rh18 cells to sudemycins phenocopies the loss of SF3B1 protein mediated by molecular techniques.
SF3B1 inhibition by sudemycin D1 leads to up-regulation of genes involved in splicing, nonsense mediated decay, and protein translation
In order to examine the effects of sudemycin D1 on the whole transcriptome, we exposed Rh18 cells to 1 µM of drug for 8 h and after extraction, subjected RNA to RNA-seq analysis. Control samples were treated with the vehicle (DMSO) alone and all analyses were conducted in triplicate to eliminate variability. Differential expression analysis revealed dramatic effects induced by sudemycin D1 on the whole transcriptome at the gene level (Fig. 2). Using a twofold change as a cutoff, 1801 genes were significantly up-regulated, whereas 2264 genes were significantly down-regulated (see Supplemental Table S1A, FDR < 0.01; and Supplemental Fig. S3A). Interestingly, MDM2, the gene demonstrating the highest level of AS, was also the most significantly up-regulated gene (adjusted P-value 3.7 × 10⁻²⁶), expressed eightfold higher following drug treatment as compared to the control (Fig. 2A; Supplemental Table S1A).
FIGURE 2.

Differential gene expression analysis in Rh18 cells following sudemycin D1 treatment. (A) An M-A (log2 fold change versus average expression) plot indicating the wide range of changes in gene expression following drug exposure. (B) GSEA analyses demonstrate significant normalized enrichment scores for up-regulated genes in spliceostatin A-treated HeLa cells. (C) GSEA analyses indicating increased expression of genes involved in RNA splicing. (D) Heatmap of genes involved in tRNA-splicing (defined by GO:0043484, M16816). (E) GSEA analyses demonstrating increased expression of genes involved in nonsense-mediated decay (NMD). (F) Heatmap of key genes involved in the NMD pathway (defined by REACTOME R-HSA-975957, M1067).
Comparison of our data sets with the RNA-seq data obtained from treatment of HeLa cells with spliceostatin A (a molecule that also targets SF3B1; GSE72055) indicated that the top up-regulated genes in Rh18 were similar to those seen in HeLa cells after SF3B1 inhibition (Fig. 2B, NES = 3.7; see Supplemental Fig. S3A; Supplemental Table S1B). Other enriched gene sets included those involved in the regulation of RNA splicing (Fig. 2C,D; NES = 2.0, adjusted q-value = 0.029; Supplemental Table S2), and post-transcriptional regulation, as well as those related to 3′-UTR mediated translational regulation and NMD (Fig. 2E; Supplemental Table S2; Supplemental Fig. S4A,B). The expression of genes associated with protein translation, and both the small and large ribosomal subunits were also modulated, suggesting that the inhibition of SF3B1 by sudemycin D1 or spliceostatin A, yields a significant increase in the translational burden (Supplemental Table S2). When we compared the differentially expressed genes in HeLa cells (GSE72156 and GSE72055) with those obtained from Rh18 cells, we identified only 56 genes that were commonly up-regulated between the two samples. Similarly, only 61 were commonly down-regulated (see Supplemental Fig. S3B; Supplemental Table S1). Among the former, the splicing factors HNRNPA1 and SRSF2 were up-regulated (Supplemental Fig. S3D; Supplemental Table S1D), suggesting a potential feedback mechanism to ensure RNA fidelity in the presence of spliceosome inhibitors. Overall, the above data indicates that inhibition of SF3B1 function results in different changes in expression profiles, but similar cellular pathways are targeted, arguing that the response to this perturbation is mediated by common feedback mechanisms.
Exon skipping is the predominant effect observed following SF3B1 inhibition
To identify the various types of splicing events that occurred within these data sets (Fig. 3A), we applied rMATS software (v3.0.8; Shen et al. 2014) to our RNA-seq data. This revealed that exon skipping was the most common molecular effect (98.4%, 9283 cassette exons, FDR < 0.05; Supplemental Fig. 3B; Supplemental Table S3). This is consistent with what we previously observed using exon splicing arrays (Convertini et al. 2014). In order to understand if similar effects occurred following SF3B1 inhibition in HeLa and HCT-116 cells, we performed the same analyses for the three public data sets (GSE72055, GSE72156, and GSE96917). Indeed, exon skipping was the dominant event in HeLa cells treated with spliceostatin A (GSE72055 [Tseng et al. 2015], 89.1%, 2128 cassette exons, FDR < 0.05; Supplemental Fig. S5A; Supplemental Table S4). Surprisingly, there were much fewer AS events in nuclear RNA of HeLa cells following treatment by spliceostatin A, although exon skipping still predominated (GSE72156 [Yoshimoto et al. 2017] 70%, 92 cassette exons, FDR < 0.05; Supplemental Fig. S5B; Supplemental Table S5). In HCT-116 cells treated with the pladienolide derivative E7107 (GSE96917 [Teng et al. 2017]), exon skipping was dominant (Supplemental Fig. S5C). In toto, the analysis of these independent data sets confirms that this molecular event predominates, even in different cell types and with different inhibitors, following inhibition of SF3B1 function.
FIGURE 3.

Analysis of different splicing events following sudemycin D1 treatment. (A) Schematic illustration of different splicing events. (B) Exon skipping events predominate in Rh18 cells following sudemycin D1 treatment. (C) Preferred exons are significantly longer than skipped exons after sudemycin D1 treatment. (D) Summary of different splicing events in the time course experiments for Rh18 cells.
Next, we examined the exons that were skipped and compared them with the downstream preferred exons in the same gene. No differences were observed in the pattern of intron/exon boundary acceptor sequences (see Supplemental Fig. S5D) and no bias toward out of frame usage or GC composition (Supplemental Fig. S5E,F) was observed. Interestingly, the downstream preferred exons were significantly longer than the skipped exons in the Rh18 cells data sets (median length: 138 bp versus 108 bp; paired t-test P-value <2.2 × 10⁻¹⁶; Fig. 3C, Supplemental Fig. S5G), but not for the introns flanking the cassette exons (P-value = 0.037; Supplemental Fig. S5G). Longer downstream exons were noted in the control DMSO-treated samples; however, this observation was considerably less significant as compared to drug-treated cells (median length: 126 bp versus 120 bp; P-value = 0.014; Fig. 3C).
To determine the dynamics of the observed splicing events, we treated Rh18 cells with sudemycin D1 for various lengths of time (30 min to 8 h) with either 0.1 µM (low dose) or 1 µM (high dose) drug. Interestingly, the global effects of splicing showed both a time- and dose-dependent manner (Fig. 3D). At 30 min, neither low nor high dose drug exposure had a significant effect on the spliceosome. However, at the high dose, obvious changes in the RNA splicing pattern were visible at both 2 and 8 h. Consistent with our previous results, exon skipping was the most the dominant effect observed in these data sets (Fig. 3D).
The majority of aberrant splicing events involve novel exon junctions
To understand whether the AS events occurred in known splice junctions or in unannotated regions of RNA, we extracted all reads spanning exon junction sequences with an in-house pipeline (RNApeg). We then annotated these junctions to transcripts present within the RefSeq database and termed these as the “core” junction set. Remaining exon junctions identified in the ENSEMBL, UCSC, and AceView databases (collectively describing minor isoforms) were annotated as the “extended” junction set. Any exon junction sequences that did not match those present in all four of the above databases were then classified as “novel.” For each gene, we used the average junction read counts as a proxy for gene expression levels.
Upon sudemycin D1 treatment of Rh18 cells, we noticed that the increase or decrease of most “core” junctions correlated well with the changes in gene expression level (Fig. 4A; Supplemental Table S6). This suggested that for the predominant transcripts for these genes, the relative increase in core junctions was in agreement with the actual levels of the mature RNA molecule. Among the “core” junctions differentially expressed between sudemycin D1-treated Rh18 cells and the control samples [n = 12,727; abs(log2FC) > 2, FDR < 0.05], most were down-regulated (n = 7996; 74.5%, Fig. 4B; Supplemental Table S6). Conversely, most significantly up-regulated exon junctions were either “extended” (n = 2731, 90%) or “novel” (n = 2707, 98.9%; Fig. 4A,B; Supplemental Table S6). These results suggest that, under these conditions, either the AS machinery prefers noncanonical isoforms, or that novel isoforms might be induced by defective branch point recognition due to the loss of SF3B1. Notably, multiple “extended” and “novel” exon junctions were observed in MDM2 (Fig. 4A), highlighting the uniqueness of the cellular response of Rh18 cells toward SF3B1 inhibition.
FIGURE 4.

Analysis of differentially expressed exon junctions in sudemycin D1-treated Rh18 cells (A) Changes in the level of exon junctions compared with the change in gene expression induced by sudemycin D1. Core—defined isoforms identified within the Refseq (NCBI) database; Extended—isoforms defined by the ENSEMBL, AceView, and UCSC databases; Novel—all novel splice junctions that are not detected in untreated samples and are absent from the reference databases. (B) The types of exon junctions observed in differentially expressed exon:intron sequences. Only those with at least a fourfold change and a FDR < 0.05 were included. (C) The distribution of novel junctions observed following sudemycin D1 treatment. Both Junctions Novel—both the 5′ and the 3′ splice junctions are not present in the four databases mentioned above; One Junction Novel—either the 5′ or the 3′ exon is novel; Read-through—the two exon junctions are from two different genes in the neighborhood; Exon skipping—the entire exon is missing from the RNA transcript, with the two exon junctions matching the known acceptor and donor sites in annotated isoforms of the same gene. (D) The relative percentage of “core” or “novel” exon junctions leading to three different reading frames (in-frame, frame+1, frame+2) in HeLa and Rh18 cells upon SF3B1 inhibition.
When we applied the same analytical method to HeLa cell RNA-seq data sets (GSE72055 [Tseng et al. 2015]), again, the majority of the down-regulated exon junctions were present within the “core” set (n = 11,448, 93.3%; Supplemental Fig. S6A,D). This implied that the intronic sequences adjacent to these junctions were recognized as branch points by SF3B1. Similar to the results seen above, the majority of the up-regulated exon junctions were “novel” (n = 1575, 82.6%; Supplemental Fig. S6A,D). Although a similar trend was present in the nuclear RNAs of HeLa cells (see Supplemental Fig. S6B), we observed considerably fewer “novel” junctions, consistent with the rMATS analysis (Supplemental Fig. S5B). Remarkably, these splicing events were significantly reduced in the cytoplasmic RNA data sets (Supplemental Fig. S6C), suggesting that the most aberrant splice isoforms might have been subjected to NMD, and thereby eliminated from this cellular compartment. Further analysis of the novel exon junction sequences in the Rh18 data sets demonstrated that the vast majority of RNAs skipped specific exons (95% n = 2571; see Supplemental Fig. S5D). This result is again consistent with rMATS analysis. The same held true for the RNA-seq data obtained from total HeLa RNA isolated from cells treated with spliceostatin A (55%, n = 871; Supplemental Fig. S6E).
In order to understand if the exons skipped by these “novel” junctions led to in-frame or out-of-frame transcripts, we constructed the isoforms with cufflinks2, then matched the exon-skipping junctions to the isoforms inferred from the sequence. When the up-regulated “core” junctions contained cassette exons (i.e., a naturally occurring alternative spliced isoform), the lengths of the cassette exons followed a ratio of 3:1:1 (60%:20%:20%) for the in-frame, frame+1 and frame+2 transcripts, respectively. This occurred in both Rh18 and HeLa cells (Fig. 4D; Supplemental Table S6C), suggesting that out-of-frame skipping events were negatively selected in the known isoforms. In contrast, for the “novel” exon spliced junctions, when skipping a cassette exon, the percentage of the in-frame sequences was reduced to ∼50% (Fig. 4D; Supplemental Table S6C). The ratios for the three open reading frames was 2:1:1 (55%:22%: 23%) in Rh18 and 3:2:2 (45%:30%:25%) in HeLa cells, suggesting that the NMD machinery was functional, and that out-of-frame transcripts were recognized with approximate equal efficiency in both cell lines.
Molecular validation of splicing events in Rh18 cells following sudemycin D1 treatment
To confirm the presence of the AS events, and their relative fraction for different transcript isoforms, we selected several differentially expressed exon junctions and undertook semi-quantitative RT/PCR analyses. As seen in Figure 5, the estimation of the relative fraction of each transcript correlated very well with that determined by RT/PCR (R2 = 0.84, Pearson correlation). In addition to exon skipping, we also validated a case of an alternative 3′-splicing event, where a new acceptor site was identified in SMEK1, creating an mRNA product 18 bp shorter than the canonical isoform (see Supplemental Fig. S7). These studies provided confirmation that our bioinformatic quantitation was valid and verifiable using biochemical and molecular approaches.
FIGURE 5.
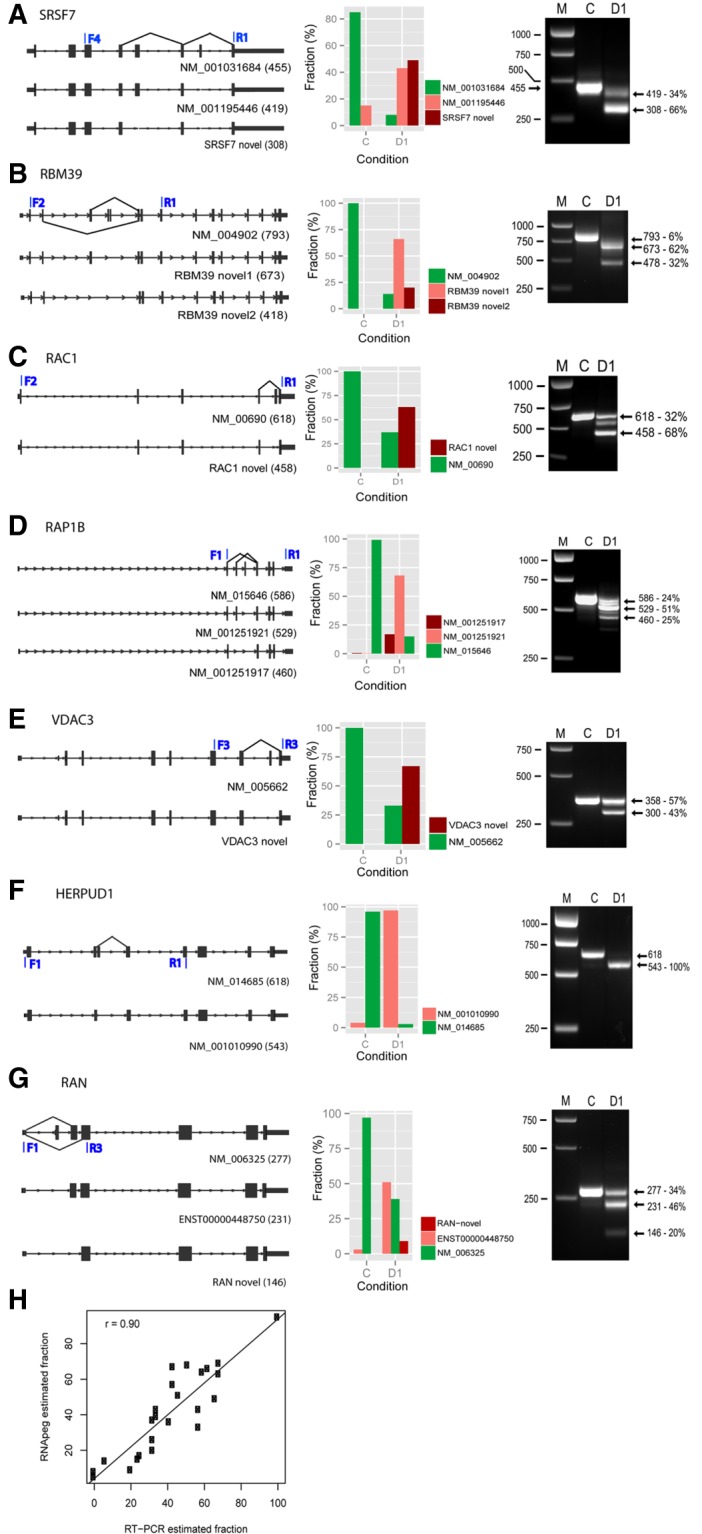
Validation of novel AS exon junctions by RT-PCR. (A–G) (Left panels) RNA structures for canonical (upper line) and AS isoforms (lower lines) for selected genes. The latter were identified in RNA data sets from sudemycin D1-treated Rh18 cells using in house software (RNApeg). (Middle panels) The estimation of the fraction of each splicing event based on supporting exon junction reads. (Right panels) PCR analysis for expressed transcripts of these genes following treatment with either sudemycin D1 (D1) or DMSO (C). Molecular weight markers (M) and band sizes are indicated in bp. (H) Scatter plot showing the correlation of the fraction of AS events with that obtained from agarose gel densitometric analysis of PCR samples using the same RNA. The plots were based on 10 selected genes (MDM2, HERPUD1, HNRNPR, RAC1, RAN, RAP1B, RBM39, SMEK1, SRSF7, and VDAC3).
DISCUSSION
RNA splicing has been linked to various human maladies including neuro-degenerative diseases, X-linked psychiatric disorders and neoplasia (Ward and Cooper 2010; Sterne-Weiler et al. 2011; Sterne-Weiler and Sanford 2014). The recurrent somatic mutations in SF3B1 identified in multiple cancer types suggest that this gene plays a significant role in either the genesis, and/or growth and development, of tumor cells. Recently, detailed biochemical and molecular studies have established that SF3B1 specifically interacts with U2 snRNP and is important in recognizing the branch point sequence within RNAs (Martins et al. 2011). Furthermore, it has been demonstrated that the gain of function SF3B1 mutants expressed in tumors lead to preferred recognition of cryptic 3′ splice sites through alternative branch point usage (Darman et al. 2015; DeBoever et al. 2015; Alsafadi et al. 2016). Overall therefore, these results suggests that the high fidelity recognition of branch point sequences in RNA transcripts by the spliceosome is mediated by SF3B1.
With the recent identification of highly specific, small molecule inhibitors of SF3B1, it is now possible to dissect the molecular consequences of disrupting the function of this protein. For example, spliceostatin A was found to generate truncated p27 in cells (Kaida et al. 2007) and Furumai demonstrated that that this small molecule could regulate VEGF expression by disruption of splicing of the encoding RNA (Furumai et al. 2010). Using the β-globin gene as a model, studies have also shown that spliceostatin treatment does not block the formation of the A complex, but affects the formation of catalytic forms of the spliceosome, leading to accumulation of unspliced transcripts (Roybal and Jurica 2010; Martins et al. 2011). We previously showed that SF3B1 inhibition in Rh18 cells results in aberrant splicing in MDM2 (Fan et al. 2011). However, the pleiotropic effects induced by SF3B1 inhibition, have not allowed a definitive elucidation of the general mechanisms and processes involved following small molecule exposure.
Previously, using human junction arrays, we demonstrated that cassette exons were one of the major consequences of sudemycin E treatment (1761/2771, 83% [Convertini et al. 2014]). However, due to the inherent design limitations of the exon junction arrays, we were unable to evaluate the number of intron retention events. Recently, Yoshimoto reported that in HeLa cells treated with spliceostatin A, the main aberrant splicing event was intron retention (Yoshimoto et al. 2017). This surprising result motivated us to examine the effect of sudemycin treatment of Rh18 cells using whole transcriptome sequencing. Concomitantly, we reanalyzed three public data sets of HeLa cells treated with spliceostatin A (GSE72055 and GSE72156 [Tseng et al. 2015; Yoshimoto et al. 2017]) or HCT-116 cells exposed to E7107 (GSE96917 [Teng et al. 2017]). We observed that in the RNA-seq data sets from total HeLa RNA and from HCT-116 cells, exon skipping was the major event (Supplemental Fig. S4A,C). In Rh18 cells treated with sudemycin D1, exon skipping was even more dramatic (Fig. 3B), matching well with our previous exon junction array results (Convertini et al. 2014). The number of significant AS events in the nuclear fraction of the HeLa cell data sets was much fewer than in the total RNA and in Rh18 cells (Supplemental Fig. S4). Surprisingly, we did not observe more intron retention versus exon skipping events in the RNA-seq data obtained from the nuclear fraction of the HeLa cells after SF3B1 inhibition, in contrast with the previous observations (Supplemental Fig. S4B; Yoshimoto et al. 2017). Interestingly, exon skipping was more prevalent than intron retention when Yoshimoto analyzed the data published by another group (GSE65644 [Supplemental Fig. S2B; Yoshimoto et al. 2017]). However, intron retention became more prominent when normalized against the total number of the events in the cells (Yoshimoto et al. 2017). Therefore, it is clear that in terms of the differential splicing events observed following spliceosome inhibition, exon skipping is the most frequent molecular consequence.
To better understand the exon skipping events that we observed, we extracted the raw junction read counts from the mapped bam files, and annotated them based upon existing gene annotation databases. In both the Rh18 and total HeLa cell RNA-seq data sets, we determined that novel junctions involving exon skipping events were the main consequence of SF3B1 inhibition (Supplemental Fig. S6). This trend was less obvious in either the total RNA-seq or nuclear RNA-seq data from HeLa cells. However, to ensure that our analyses were bona fide, we selected 10 genes that demonstrated AS in Rh18 cells and validated our bioinformatic quantitation using RT-PCR analyses (Fig. 5). As seen, our methodology and predicted computational results were in very close agreement with the biological data. In addition, in an attempt to identify domains and/or features that might account for AS in particular genes, we examined both intronic and exonic sequences adjacent to the skipped exons, and compared these to the same information for preferred exons. To date, we have not identified such a motif. Interestingly, our analyses indicated that preferred exons were longer than those that were skipped, although no difference was observed between the lengths of the introns flanking the skipped exons. However, since we have demonstrated that the degree of AS may depend upon the absolute levels of SF3B1 protein (Figs. 1C, 3D), we are undertaking studies to assess the likelihood of a splicing event occurring under different conditions (i.e., varying concentrations of drug, the quantitation of SF3B1, etc.). Such information may allow us to determine whether such domains and motifs can be elucidated.
We noted that the expression of other splicing factors was significantly up-regulated following exposure of Rh18 cells to sudemycin D1. This included HNRNPA1 and SRSF2, proteins that bind RNA at sequence specific locations. For HNRNPA1, this splicing factor binds to UAGGG (Ray et al. 2013) and GUAGUAGU (Huelga et al. 2012). SRSF2 is predicted to recognize AGGAGA (Akerman et al. 2009), however it should be recognized that none of these domains demonstrate any homology with the branch point consensus motif CUNAN (Mercer et al. 2015). Hence, while the up-regulation of these splicing factors may represent a compensation mechanism for the loss of SF3B1 function, it is not clear how increased levels of these proteins might act in concert with the other spliceosome components.
A natural question is whether the massive exon skipping events result in transcripts with three reading frames of equal probabilities (thus a ratio close to 1:1:1 for in-frame, frame+1 and frame+2, respectively). Due to the limitation of the short read sequencing technology and RNA degradation, it is difficult to construct the full transcripts, especially when there is no coverage of the 5′-exons. To address this challenge, we undertook a multistep analysis. Firstly, we inferred the actual RNA transcripts present in each sample using an ab initio cufflinks run, which assembles the reads into transcripts without reference or annotation. Secondly, the up-regulated exon junctions were matched to the assembled transcripts, more accurately estimating the translated consequence of the differential splicing events. Moreover, matching exon junctions to reconstructed transcripts allowed us to identify whether an exon junction skipped a single or multiple exons, thus, the effect on reading frame could be determined in an unambiguous manner. Thirdly, we made the observation that the “core” junctions captured a ratio of 3:1:1 for the three reading frames for natural isoforms, establishing that the alternatively spliced isoforms predominantly yielded in-frame transcripts. Finally, we evaluated the consequence of “novel” junctions that led to exon skipping. The ratio of the three reading frames of 2:1:1 in Rh18 cells or 1.5:1:1 (i.e., 3:2:2) in HeLa cells were cross-validated in two independent studies, despite differences in total number of “novel” junctions. Our hypothesis for the observed intermediate ratio of 2:1:1 (which is between 1:1:1 and 3:1:1) is that the initial reading frames of “novel” aberrant splicing events are randomly assigned, then out-of-frame transcripts were removed by negative selection by the NMD machinery. It should also be noted that both frame+1 and frame+2 maintain a constant ratio, supporting the role of the NMD pathway in unbiased selection of these reading frames. This further indicates the robustness of NMD in response to the dramatic perturbation of the whole transcriptome. From transcriptome expression data sets, we observed the up-regulation of the NMD pathway (3′-UTR-mediated translational regulation: hypergeometric test, BH adjusted P-value = 0.00058; NMD independent of the Exon Junction Complex: P-value = 0.0016; see Supplemental Table S2). Additionally, it is noteworthy that we only observed the up-regulation of some genes (e.g., UPF1, SMG1, SMG7, SMG8, RNPS1) in the NMD pathway, as compared to all of them. (Fig. 2E). It is unclear why this is the case, but we are currently investigating these effects in our cell systems. As a corollary to these results, we also noted that chaperones and pathways involved in protein folding were enriched, again indicating that this may act as an endogenous cellular protective mechanism to prevent damage from peptides of undesired sequence (Supplemental Table S2).
In summary, we have demonstrated that the main effect of SF3B1 inhibition in HeLa, HCT-116 and Rh18 cells is exon skipping. For most genes, the exon junctions supporting the skipping events were not present in any annotated isoforms, suggesting that AS yielded novel RNAs encoding proteins of potentially unknown function, or transcripts that were subjected to NMD. In addition, while the gene level response to spliceosome inhibition between the different cell types and drugs examined was different, commonality was observed in the pathway analyses, identifying RNA splicing and protein translation as targets. We conclude therefore, that inhibition of SF3B1 by small molecules is likely to lead to pleiotropic effects in different cell types, and delineating the response to these agents will be complex. Ultimately, a combination of RNA-seq and extensive bioinformatic analyses, coupled with in vitro molecular studies, and detailed cell biology experiments will be required.
MATERIALS AND METHODS
Cell lines, drugs, and other reagents
The pediatric alveolar RMS line Rh18 was obtained from Peter Houghton (St. Jude Children's Research Hospital) and was grown as previously described (Petak et al. 2000). The IC50 for cell growth inhibition for sudemycin D1 in this cell line is ∼90 nM. The syntheses of sudemycin D1 and E (Fig. 1) have been reported previously (Lagisetti et al. 2013). siRNAs targeting SF3B1 were purchased from Dharmacon (cat# D-001810-10-05). The sequence of PCR primers used for the analysis of RNA isoforms are included in Supplemental Information (Supplemental Table S7).
Drug and siRNA treatment
Rh18 cells were exposed to sudemycin D1 (either 0.1 or 1 µM) in serum-containing media for 8 h. Control samples contained DMSO alone. Cells were then harvested and total RNA was extracted using TRIzol (Life Technologies). For siRNA treatment, cells were transfected with Lipofectamine RNAiMax (ThermoFisher) using 30 nmol of either pooled (120 nmol for four pooled siRNAs), or individual siRNAs, and 48 h later, RNA was prepared as described above. The quality of all samples was determined using UV spectroscopy and by agarose gel analysis.
RT/PCR analyses and quantitation
RNA (typically 200 ng) was random primed using Superscript III reverse transcriptase (Invitrogen) and subjected to PCR using sequence specific primers (see Supplemental Information for DNA sequence and annealing temperatures). Routinely, 30 cycles of amplification were performed (94C, 30 sec denaturation; 58C, 30 sec annealing; 72C, 60 sec extension) and samples were then analyzed by agarose gel electrophoresis. Images were recorded with a BioRad documenter and densitometry analysis performed with Quantity One software. The signal intensity of discrete bands was calculated by evaluating the fluorescence intensity along a line positioned within the center of the gel lane. To correct for any differences in sample loading, values for each band were expressed as a percentage of the total signal for that lane.
RNA library preparation, sequencing, and mapping
A poly(A) enriched protocol was used to prepare the RNA library for transcriptome analyses. Paired end sequencing was performed using the Illumina HiSeq platform with 101 bp read length as previously described. This data has been assigned the following GEO accession id: GSE102539.
Reads from RNA-seq were mapped by STAR (Dobin et al. 2013), as well as our in-house mapping pipeline “Strongarm.” With respect to the latter, we first aligned data sets to the following four database files using BWA (0.5.5) aligner: (i) the human GRCh37-lite reference sequence; (ii) RefSeq; (iii) a sequence file representing all possible combinations of nonsequential pairs in RefSeq exons; and (iv) the AceView database flat file downloaded from UCSC representing transcripts constructed from human ESTs. The mapping results obtained from analyses (ii) to (iv) were aligned to the human reference genome coordinates and the final BAM file was constructed by selecting the best alignment in the four databases. The fastq files from two public HeLa cell data sets (GSE72055 and GSE72156) were downloaded and remapped with STAR against the human GRCh37-lite reference sequence.
Differential gene expression analysis and GSEA
Gene level quantitation values were obtained with HT-seq (Anders et al. 2015) based on GENCODE annotation and normalized using the TMM method with the “EdgeR” package (Robinson and Oshlack 2010). Differential expression analysis was performed with the “voom” method using R “limma” software (Ritchie et al. 2015). Gene set enrichment analyses were carried out using GSEA with MSigDB (Subramanian et al. 2005).
Analysis of differential splicing events
We applied rMATS software (v3.0.8 [Shen et al. 2014]) to RNA-seq data sets to determine significant differential splicing events, including intron retention, exon skipping, mutually exclusively used exons, alternative 5′-splice site and alternative 3′-splice site selection. Specifically, for the Rh18 study, we used “-t paired -len 101 -a 8 -c 0.0001 -analysis U”, for GSE72055 (Tseng et al. 2015), we used “-t single -len 51 -a 7 -c 0.0005 -analysis U”, for GSE72156 (Yoshimoto et al. 2017), we used “-t single -len 101 -a 8 -c 0.0001 -analysis U”. Only splicing events based on junction reads reaching the significance level of FDR < 0.05 were reported.
Quantitation of novel exon junctions
In order to accurately quantitate the splicing events based on junctions, we used a junction read quantitation pipeline developed in house (“RNApeg”). This software identified junction sites in genomically mapped RNA-seq BAM files and corrected them for mapping ambiguity. Briefly, the read count supporting each junction was first reported after quality control correction within a sample, then corrected across all samples. This was especially useful for standardizing unanchored junctions (i.e., those not sharing a boundary with a known junction). Since unanchored junctions with ambiguous mapping could be assigned different coordinates in different files, this step was necessary to ensure that novel junctions were reported consistently across all data sets within a particular experiment. The final output was then annotated with matching transcript IDs and gene symbols. Differential analysis of exon junction reads was performed in a similar manner to that for the gene level analysis, assuming a negative binomial distribution of the read count data. The exon sequence was extracted with an in-house script for nucleotide composition analysis.
SUPPLEMENTAL MATERIAL
Supplemental material is available for this article.
Supplementary Material
ACKNOWLEDGMENTS
We thank the Hartwell Center for the transcriptome sequencing associated with these studies. This work was supported in part by the National Institutes of Health CA140474; a National Institutes of Health Cancer Center Core Grant CA21765; and by ALSAC.
Footnotes
Article is online at http://www.rnajournal.org/cgi/doi/10.1261/rna.065383.117.
REFERENCES
- Akerman M, David-Eden H, Pinter RY, Mandel-Gutfreund Y. 2009. A computational approach for genome-wide mapping of splicing factor binding sites. Genome Biol 10: R30. [DOI] [PMC free article] [PubMed] [Google Scholar]
- Alsafadi S, Houy A, Battistella A, Popova T, Wassef M, Henry E, Tirode F, Constantinou A, Piperno-Neumann S, Roman-Roman S, et al. 2016. Cancer-associated SF3B1 mutations affect alternative splicing by promoting alternative branchpoint usage. Nat Commun 7: 10615. [DOI] [PMC free article] [PubMed] [Google Scholar]
- Anders S, Pyl PT, Huber W. 2015. HTSeq—a Python framework to work with high-throughput sequencing data. Bioinformatics 31: 166–169. [DOI] [PMC free article] [PubMed] [Google Scholar]
- Convertini P, Shen M, Potter PM, Palacios G, Lagisetti C, de la Grange P, Horbinski C, Fondufe-Mittendorf YN, Webb TR, Stamm S. 2014. Sudemycin E influences alternative splicing and changes chromatin modifications. Nucleic Acids Res 42: 4947–4961. [DOI] [PMC free article] [PubMed] [Google Scholar]
- Darman RB, Seiler M, Agrawal AA, Lim KH, Peng S, Aird D, Bailey SL, Bhavsar EB, Chan B, Colla S, et al. 2015. Cancer-associated SF3B1 hotspot mutations induce cryptic 3′ splice site selection through use of a different branch point. Cell Rep 13: 1033–1045. [DOI] [PubMed] [Google Scholar]
- DeBoever C, Ghia EM, Shepard PJ, Rassenti L, Barrett CL, Jepsen K, Jamieson CH, Carson D, Kipps TJ, Frazer KA. 2015. Transcriptome sequencing reveals potential mechanism of cryptic 3′ splice site selection in SF3B1-mutated cancers. PLoS Comput Biol 11: e1004105. [DOI] [PMC free article] [PubMed] [Google Scholar]
- Dobin A, Davis CA, Schlesinger F, Drenkow J, Zaleski C, Jha S, Batut P, Chaisson M, Gingeras TR. 2013. STAR: ultrafast universal RNA-seq aligner. Bioinformatics 29: 15–21. [DOI] [PMC free article] [PubMed] [Google Scholar]
- Eskens FA, Ramos FJ, Burger H, O'Brien JP, Piera A, de Jonge MJ, Mizui Y, Wiemer EA, Carreras MJ, Baselga J, et al. 2013. Phase I pharmacokinetic and pharmacodynamic study of the first-in-class spliceosome inhibitor E7107 in patients with advanced solid tumors. Clin Cancer Res 19: 6296–6304. [DOI] [PubMed] [Google Scholar]
- Fan L, Lagisetti C, Edwards CC, Webb TR, Potter PM. 2011. Sudemycins, novel small molecule analogues of FR901464, induce alternative gene splicing. ACS Chem Biol 6: 582–589. [DOI] [PMC free article] [PubMed] [Google Scholar]
- Furumai R, Uchida K, Komi Y, Yoneyama M, Ishigami K, Watanabe H, Kojima S, Yoshida M. 2010. Spliceostatin A blocks angiogenesis by inhibiting global gene expression including VEGF. Cancer Sci 101: 2483–2489. [DOI] [PMC free article] [PubMed] [Google Scholar]
- Hasegawa M, Miura T, Kuzuya K, Inoue A, Won Ki S, Horinouchi S, Yoshida T, Kunoh T, Koseki K, Mino K, et al. 2011. Identification of SAP155 as the target of GEX1A (Herboxidiene), an antitumor natural product. ACS Chem Biol 6: 229–233. [DOI] [PubMed] [Google Scholar]
- Hong DS, Kurzrock R, Naing A, Wheler JJ, Falchook GS, Schiffman JS, Faulkner N, Pilat MJ, O'Brien J, LoRusso P. 2014. A phase I, open-label, single-arm, dose-escalation study of E7107, a precursor messenger ribonucleic acid (pre-mRNA) splicesome inhibitor administered intravenously on days 1 and 8 every 21 days to patients with solid tumors. Invest New Drugs 32: 436–444. [DOI] [PubMed] [Google Scholar]
- Huelga SC, Vu AQ, Arnold JD, Liang TY, Liu PP, Yan BY, Donohue JP, Shiue L, Hoon S, Brenner S, et al. 2012. Integrative genome-wide analysis reveals cooperative regulation of alternative splicing by hnRNP proteins. Cell Rep 1: 167–178. [DOI] [PMC free article] [PubMed] [Google Scholar]
- Kaida D, Motoyoshi H, Tashiro E, Nojima T, Hagiwara M, Ishigami K, Watanabe H, Kitahara T, Yoshida T, Nakajima H, et al. 2007. Spliceostatin A targets SF3b and inhibits both splicing and nuclear retention of pre-mRNA. Nat Chem Biol 3: 576–583. [DOI] [PubMed] [Google Scholar]
- Lagisetti C, Palacios G, Goronga T, Freeman B, Caufield W, Webb TR. 2013. Optimization of antitumor modulators of pre-mRNA splicing. J Med Chem 56: 10033–10044. [DOI] [PMC free article] [PubMed] [Google Scholar]
- Martins SB, Rino J, Carvalho T, Carvalho C, Yoshida M, Klose JM, de Almeida SF, Carmo-Fonseca M. 2011. Spliceosome assembly is coupled to RNA polymerase II dynamics at the 3′ end of human genes. Nat Struct Mol Biol 18: 1115–1123. [DOI] [PubMed] [Google Scholar]
- Mercer TR, Clark MB, Andersen SB, Brunck ME, Haerty W, Crawford J, Taft RJ, Nielsen LK, Dinger ME, Mattick JS. 2015. Genome-wide discovery of human splicing branchpoints. Genome Res 25: 290–303. [DOI] [PMC free article] [PubMed] [Google Scholar]
- Mizui Y, Sakai T, Iwata M, Uenaka T, Okamoto K, Shimizu H, Yamori T, Yoshimatsu K, Asada M. 2004. Pladienolides, new substances from culture of Streptomyces platensis Mer-11107. III. In vitro and in vivo antitumor activities. J Antibiot (Tokyo) 57: 188–196. [DOI] [PubMed] [Google Scholar]
- Nakajima H, Sato B, Fujita T, Takase S, Terano H, Okuhara M. 1996. New antitumor substances, FR901463, FR901464 and FR901465. I. Taxonomy, fermentation, isolation, physico-chemical properties and biological activities. J Antibiot (Tokyo) 49: 1196–1203. [DOI] [PubMed] [Google Scholar]
- Petak I, Douglas L, Tillman DM, Vernes R, Houghton JA. 2000. Pediatric rhabdomyosarcoma cell lines are resistant to Fas-induced apoptosis and highly sensitive to TRAIL-induced apoptosis. Clin Cancer Res 6: 4119–4127. [PubMed] [Google Scholar]
- Ray D, Kazan H, Cook KB, Weirauch MT, Najafabadi HS, Li X, Gueroussov S, Albu M, Zheng H, Yang A, et al. 2013. A compendium of RNA-binding motifs for decoding gene regulation. Nature 499: 172–177. [DOI] [PMC free article] [PubMed] [Google Scholar]
- Ritchie ME, Phipson B, Wu D, Hu Y, Law CW, Shi W, Smyth GK. 2015. limma powers differential expression analyses for RNA-sequencing and microarray studies. Nucleic Acids Res 43: e47. [DOI] [PMC free article] [PubMed] [Google Scholar]
- Robinson MD, Oshlack A. 2010. A scaling normalization method for differential expression analysis of RNA-seq data. Genome Biol 11: R25. [DOI] [PMC free article] [PubMed] [Google Scholar]
- Roybal GA, Jurica MS. 2010. Spliceostatin A inhibits spliceosome assembly subsequent to prespliceosome formation. Nucleic Acids Res 38: 6664–6672. [DOI] [PMC free article] [PubMed] [Google Scholar]
- Shen S, Park JW, Lu ZX, Lin L, Henry MD, Wu YN, Zhou Q, Xing Y. 2014. rMATS: robust and flexible detection of differential alternative splicing from replicate RNA-seq data. Proc Natl Acad Sci 111: E5593–E5601. [DOI] [PMC free article] [PubMed] [Google Scholar]
- Sterne-Weiler T, Sanford JR. 2014. Exon identity crisis: disease-causing mutations that disrupt the splicing code. Genome Biol 15: 201. [DOI] [PMC free article] [PubMed] [Google Scholar]
- Sterne-Weiler T, Howard J, Mort M, Cooper DN, Sanford JR. 2011. Loss of exon identity is a common mechanism of human inherited disease. Genome Res 21: 1563–1571. [DOI] [PMC free article] [PubMed] [Google Scholar]
- Subramanian A, Tamayo P, Mootha VK, Mukherjee S, Ebert BL, Gillette MA, Paulovich A, Pomeroy SL, Golub TR, Lander ES, et al. 2005. Gene set enrichment analysis: a knowledge-based approach for interpreting genome-wide expression profiles. Proc Natl Acad Sci 102: 15545–15550. [DOI] [PMC free article] [PubMed] [Google Scholar]
- Teng T, Tsai JH, Puyang X, Seiler M, Peng S, Prajapati S, Aird D, Buonamici S, Caleb B, Chan B, et al. 2017. Splicing modulators act at the branch point adenosine binding pocket defined by the PHF5A-SF3b complex. Nat Commun 8: 15522. [DOI] [PMC free article] [PubMed] [Google Scholar]
- Tseng CK, Wang HF, Burns AM, Schroeder MR, Gaspari M, Baumann P. 2015. Human telomerase RNA processing and quality control. Cell Rep 13: 2232–2243. [DOI] [PubMed] [Google Scholar]
- Visconte V, Makishima H, Maciejewski JP, Tiu RV. 2012. Emerging roles of the spliceosomal machinery in myelodysplastic syndromes and other hematological disorders. Leukemia 26: 2447–2454. [DOI] [PMC free article] [PubMed] [Google Scholar]
- Ward AJ, Cooper TA. 2010. The pathobiology of splicing. J Pathol 220: 152–163. [DOI] [PMC free article] [PubMed] [Google Scholar]
- Yoshimoto R, Kaida D, Furuno M, Burroughs AM, Noma S, Suzuki H, Kawamura Y, Hayashizaki Y, Mayeda A, Yoshida M. 2017. Global analysis of pre-mRNA subcellular localization following splicing inhibition by spliceostatin A. RNA 23: 47–57. [DOI] [PMC free article] [PubMed] [Google Scholar]
Associated Data
This section collects any data citations, data availability statements, or supplementary materials included in this article.