

Here, Youmans et al. performed single-particle imaging in live cells and show the nuclear distribution and dynamics of the PRC2 chromatin modifier. Their findings quantify the binding of PRC2 to chromatin in human cancer cells and separate the contributions of H3K27me3 histone marks and various PRC2 subunits to recruitment of PRC2 to chromatin.
Keywords: CRISPR, epigenetics, EZH2, genome editing, HaloTag, single-molecule imaging
Abstract
Polycomb-repressive complex 2 (PRC2) is a histone methyltransferase that promotes epigenetic gene silencing, but the dynamics of its interactions with chromatin are largely unknown. Here we quantitatively measured the binding of PRC2 to chromatin in human cancer cells. Genome editing of a HaloTag into the endogenous EZH2 and SUZ12 loci and single-particle tracking revealed that ∼80% of PRC2 rapidly diffuses through the nucleus, while ∼20% is chromatin-bound. Short-term treatment with a small molecule inhibitor of the EED–H3K27me3 interaction had no immediate effect on the chromatin residence time of PRC2. In contrast, separation-of-function mutants of SUZ12, which still form the core PRC2 complex but cannot bind accessory proteins, revealed a major contribution of AEBP2 and PCL homolog proteins to chromatin binding. We therefore quantified the dynamics of this chromatin-modifying complex in living cells and separated the contributions of H3K27me3 histone marks and various PRC2 subunits to recruitment of PRC2 to chromatin.
Post-translational modifications (PTMs) on histone tails can promote either transcriptional silencing or up-regulation. Polycomb-repressive complex 2 (PRC2) is responsible for monomethylating, dimethylating, and trimethylating Lys27 on histone H3. The H3K27me3 signature is highly correlated with silent loci and is important for regulating developmental and oncogenic genes. For example, homeotic gene clusters are silenced by PRC2 in a cell lineage-specific manner (Margueron and Reinberg 2011), and PRC2 can acquire both gain-of-function and loss-of-function mutations that associate with aggressive cancers (Comet et al. 2016). However, the intracellular determinants of PRC2 chromatin binding are not well understood.
This question has remained difficult to answer due to the complexity of PRC2 interactions (Piunti and Shilatifard 2016). EZH2, SUZ12, and EED constitute the minimal core subcomplex necessary for catalytic activity in vitro, while the fourth core subunit, RbAp46/48, enhances methyltransferase activity (Cao and Zhang 2004; Pasini et al. 2004; Holoch and Margueron 2017). EZH2 contains the histone methyltransferase (HMTase) SET domain (Muller et al. 2002), and its activity is allosterically regulated by a variety of ligands. For example, H3K27me3 and H3K4me3 increase and decrease PRC2 HMTase activity, respectively (Margueron et al. 2009; Schmitges et al. 2011). In addition to allosteric regulation by histone PTMs, the core PRC2 subcomplex associates with many accessory proteins in cells, including AEBP2, PHF1, MTF2, PHF19, JARID2, and EPOP (Grijzenhout et al. 2016; Hauri et al. 2016; Kloet et al. 2016; Oliviero et al. 2016). Importantly, PRC2 binds several of these proteins in a mutually exclusive manner, generating unique subcomplexes that are implicated in directing PRC2 to chromatin (Holoch and Margueron 2017).
These previous studies have generated several attractive models to describe intracellular PRC2 chromatin binding. PRC2 recruitment to chromatin is commonly thought to involve its recognition of H3K27me3 through its EED subunit, a binding interaction that has been observed in X-ray structures (Margueron et al. 2009; Jiao and Liu 2015). However, it was shown recently that DNA dominates the interaction of PHF1- and AEBP2-containing PRC2 complexes with nucleosome arrays in vitro (Choi et al. 2017; Wang et al. 2017). Additionally, increasing the DNA linker length between dinucleosomes increases PRC2 affinity, but modifying the nucleosomes with H3K27me3 has little effect on PRC2 affinity (Wang et al. 2017). This raises the question of whether H3K27me3, which certainly has an allosteric regulatory function for PRC2 activity, plays any role in the association of PRC2 with chromatin in vivo.
The aforementioned accessory proteins have also been implicated in recruiting PRC2 to chromatin. In Drosophila melanogaster, PRC2 chromatin binding relies on similar accessory proteins (Klymenko et al. 2006; Nekrasov et al. 2007). Additionally, in Arabidopsis thaliana, a broad family of transcription factors has been suggested recently to recruit PRC2 to chromatin (Xiao et al. 2017). In mammals, PRC2 accessory proteins are often found bound to polycomb target genes, and depleting them leads to a reduction of PRC2 and H3K27me3 at some, but not all, PRC2 target genes (Kim et al. 2009; Peng et al. 2009; Shen et al. 2009; Walker et al. 2010; Casanova et al. 2011; Li et al. 2011; Ballare et al. 2012; Brien et al. 2012; Hunkapiller et al. 2012; Sanulli et al. 2015; Li et al. 2017). However, attributing these observations to a direct mechanism for PRC2 recruitment is often difficult because depletion of these proteins can perturb biological function of many complexes in addition to PRC2.
Here, we set out to study the molecular determinants of PRC2 chromatin binding in vivo using CRISPR genome editing to generate HaloTag-EZH2 and HaloTag-SUZ12 fusion proteins. Using the HaloTag, live-cell single-molecule imaging revealed that only 20% of PRC2 is chromatin-bound in human U2OS cells. Additionally, disrupting the interaction between EED and H3K27me3 with a competitive inhibitor had no short-term effect on PRC2 chromatin binding. In contrast, disrupting the interaction of PRC2 with both PCL homolog proteins and AEBP2 was sufficient to significantly deplete the chromatin-bound fraction of PRC2. We conclude that the interaction between SUZ12 and these accessory proteins is crucial for PRC2 chromatin binding in vivo.
Results
HaloTagging EZH2 and SUZ12 by CRISPR genome editing
The HaloTag is a 33.5-kDa protein that reacts covalently with modified fluorophores and is well suited for live-cell single-molecule imaging (Chen et al. 2014; Liu et al. 2014; Knight et al. 2015; Schmidt et al. 2016; Zhen et al. 2016; Hansen et al. 2017). Although the HaloTag is large, it was encouraging that N-terminal tagging of PRC2 subunits with maltose-binding protein did not disrupt complex assembly (Davidovich et al. 2013). To test the integrity of HaloTagged PRC2 subunits, we transiently expressed and immunopurified PRC2 proteins containing a 3xFlag-HaloTag. Each tagged subunit could interact with untagged endogenous PRC2 components (Supplemental Fig. S1A), suggesting that the N-terminal HaloTag did not disrupt PRC2 assembly.
Expressing these proteins at endogenous levels is essential for analyzing the dynamics of PRC2 because ectopic overexpression increases the likelihood of imaging free HaloTagged subunits that are not complexed with the remainder of PRC2. A two-step CRISPR genome-editing strategy (Xi et al. 2015) was implemented to generate U2OS cell lines that express 3xFlag-HaloTag-EZH2 and 3xFlag-HaloTag-SUZ12 fusion proteins from their endogenous loci (Fig. 1A, top). PCR with primers flanking both homology arms gave the 2-kb PCR product characteristic of unedited alleles, while edited alleles generated the expected 3-kb product (Fig. 1A, bottom). Western blots demonstrated that HaloTag-EZH2 and HaloTag-SUZ12 had the expected increase in molecular weight relative to untagged subunits (Fig. 1B), and the corresponding untagged protein band was also absent in these clones. These results are consistent with correct editing of all EZH2 and SUZ12 alleles.
Figure 1.

HaloTagging the N termini of EZH2 and SUZ12 by genome editing: HaloTag-EZH2 maintains endogenous protein levels and intracellular PRC2 activity. (A, top) Diagram of the EZH2 or SUZ12 locus before and after 3xFlag-HaloTag genome editing. The 3xFlag-HaloTag is inserted downstream from the transcription start site (bent arrow) and in frame with the first codon of either EZH2 or SUZ12. The resulting gene editing generates an N-terminal 3xFlag-HaloTag fusion protein. PCR primers (horizontal arrows) bind outside of the left and right homology arms (LHA and RHA) and identify correctly edited alleles by a size increase of 1 kb, corresponding to the 3xFlag-HaloTag insertion. (Bottom) PCR of the EZH2 or SUZ12 locus in parental (P) or 3xFlag-HaloTag-edited cells. 3xFlag-HaloTag-EZH2 clone = dty3; 3xFlag-HaloTag-SUZ12 clone = 9.32. Parental genes give a 2-kb amplification, whereas the edited 3xFlag-HaloTag alleles give a 3-kb product. (B) Protein levels in parental and genome-edited cells were assessed by Western blots with αFlag, αEZH2, αSUZ12, and αHistone H3 antibodies. Based on molecular weight markers, the expected sizes of wild-type and 3xFlag-HaloTag fusion proteins are indicated at the right. (C) H3K27me3 levels in parental, 3xFlag-HaloTag-EZH2, and 3xFlag-HaloTag-SUZ12 cell lines. Cells were lysed in SDS lysis buffer, and αH3K27me3 and αH3 Western blots were performed on a dilution series (0.56×, 0.75×, and 1×) of the lysate.
Importantly, HaloTag-EZH2 was expressed at a level equivalent to that of EZH2 in parental cells (Fig. 1B) and retained in vitro histone lysine methyltransferase activity (Supplemental Fig. S1B). Additionally, HaloTag-EZH2 maintained intracellular H3K27me3 levels equivalent to those in parental cells (Fig. 1C). In contrast to HaloTag-EZH2, HaloTag-SUZ12 expression was decreased compared with parental SUZ12, and an N-terminal truncation product was present (Fig. 1B). Additionally, the HaloTag-SUZ12-edited cells maintained H3K27me3 at reduced levels compared with parental cells (Fig. 1C). EZH2 is also reduced in HaloTag-SUZ12 cells (Fig. 1B), suggesting that depletion of H3K27me3 is a result of reduced PRC2 abundance rather than the HaloTag affecting PRC2 activity.
HaloTag-EZH2 and HaloTag-SUZ12 here refer to the 3xFlag-HaloTag-EZH2(dty3) and 3xFlag-HaloTag-SUZ12(9.32) clones (Fig. 1B,C), respectively.
Single-molecule imaging of EZH2 and SUZ12 reveals that most of PRC2 is rapidly diffusing rather than chromatin-bound
To study the intracellular dynamics of PRC2, the HaloTag on EZH2 and SUZ12 was covalently modified with a cell-permeable dye (JF646), (Supplemental Movie S1, S2; Grimm et al. 2015). Cells were treated with a low concentration of JF646 to minimize tracking errors caused by high particle densities.
This imaging and tracking initially revealed that PRC2 diffuses throughout most of the nucleus (Fig. 2A,B). Here, each colored line represents a unique single-molecule trajectory. The diffuse pattern of these trajectories suggests that PRC2 explores the entire nucleus rather than being sequestered within heterochromatic subdomains.
Figure 2.
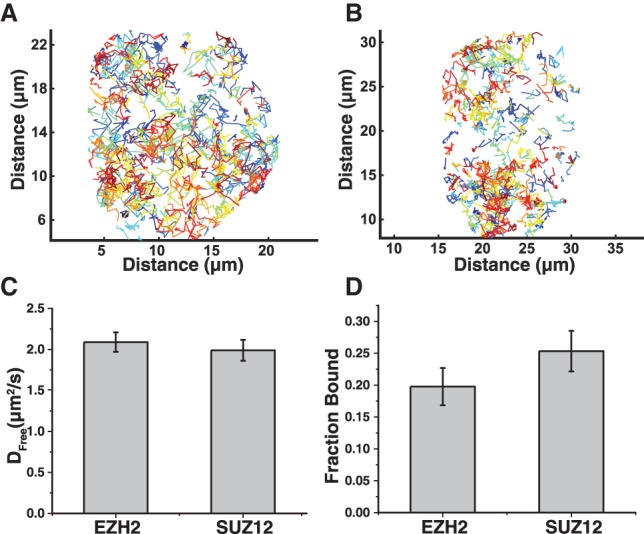
Live-cell single-molecule imaging of EZH2 and SUZ12 reveals that the majority of PRC2 is rapidly diffusing. (A,B) Single-particle trajectories of 3xFlag-HaloTag-EZH2 (A) and 3xFlag-HaloTag-SUZ12 (B) over 15 sec in a single nucleus. Each colored line corresponds to a unique particle trajectory. (C,D) The diffusion coefficient of the rapidly diffusing fraction (Dfree) (C) and the fraction of chromatin-bound molecules (D) for both EZH2 and SUZ12. Cells were labeled with JF646 and imaged at 97.5 Hz. Particles were localized, tracked, and evaluated using SLIMfast and evalSPT. Spot-On was used to calculate Dfree and the fraction of chromatin-bound molecules for either EZH2 or SUZ12. C and D show the average and SD from n = 3 biological replicates using n > 12 cells per replicate. Differences between EZH2 and SUZ12 were not statistically significant, based on P-values generated from a heteroscedastic t-test using a two-tail distribution.
Spot-On, newly developed software that minimizes bias within single-particle tracking (Hansen et al. 2018), was used to calculate the diffusion coefficient of the freely diffusing fraction (Dfree) as well as the fraction of chromatin-bound molecules (fraction bound) for EZH2 and SUZ12. Consistent with EZH2 and SUZ12 being integral components of the PRC2 complex, HaloTag-EZH2 and HaloTag-SUZ12 possess similar intracellular dynamics (Fig. 2C,D; Supplemental Fig. S2). HaloTag-EZH2 has a Dfree of 2.09 µm2/sec ± 0.12 µm2/sec, and HaloTag-SUZ12 has a Dfree of 1.99 µm2/sec ± 0.13 µm2/sec (Fig. 2C). A greater fraction of HaloTag-SUZ12 is chromatin-bound relative to HaloTag-EZH2, but the difference is not statistically significant (Fig. 2D). An alternative method of data acquisition and analysis (Supplemental Fig. S3) gave qualitatively the same conclusion—that only a small fraction of HaloTag-EZH2 or HaloTag-SUZ12 is chromatin-bound.
EZH2 has a larger immobile fraction and slower off rate at a H3K27me3-enriched locus
The HaloTag genome editing was performed in U2OS parental cells that have a chromosomal integration of repeats of the lactose repressor-binding DNA sequence (lacO array) (Jegou et al. 2009). Additionally, the lacO array in this cell line (F42B8) was reported to have a high density of EZH2 and H3K27me3 (Weth et al. 2014). Using immunofluorescence to EZH2 and DNA-FISH to the lacO array, we confirmed that EZH2 colocalizes with the lacO array in the HaloTag-EZH2 F42B8 cell line but does not colocalize in another U2OS cell line (Supplemental Fig. S4A; Janicki et al. 2004). Consistent with EZH2 occupancy, the lacO array in the HaloTag-EZH2 (F42B8) cell line is also an H3K27me3-enriched domain (Supplemental Fig. S4B).
The elevated concentration of HaloTag-EZH2 at the lacO array enabled us to investigate EZH2 dynamics at this H3K27me3-enriched site using fluorescence recovery after photobleaching (FRAP) without a lacO array marker (Fig. 3A,B; Supplemental Movie S3). Comparing the recovery of HaloTag-EZH2 at the LacO array with other nuclear sites, HaloTag-EZH2 had a larger immobile fraction and slower recovery rate at the lacO array (Fig. 3C,D). These data indicate that PRC2 has a higher affinity toward this H3K27me3-rich domain, which could be a result of several factors: the H3K27me3 marks, the degree of chromatin compaction, the particular DNA sequence, and/or the lack of local transcription.
Figure 3.

EZH2 has a greater immobile fraction and recovers more slowly after photobleaching at a H3K27me3-enriched locus compared with other nuclear sites. (A, top) Three time points from a FRAP experiment performed on 3xFlag-HaloTag-EZH2 cells. HaloTag-EZH2 cells were labeled with 500 nM JF646. Dashed circles indicate different regions of interest (ROIs) where the mean intensity of 3xFlag-HaloTag-EZH2 was measured over time. (Red) lacO array; (yellow) nonspecific nuclear site. The mean fluorescence of each ROI was monitored every 2 sec before and after photobleaching. (Bottom) The lacO array signal and another nuclear signal are shown at −2 sec, 0 sec, and every 6 sec up to 128 sec. (B) Normalized total intensity values within each ROI (from the cell in A) after photobleaching. The fluorescence recovery was fit to y(t) = A(1 − e−Bt) (shown by the smooth red and yellow lines). The dashed line indicates the fraction of fluorescent nuclear EZH2 remaining after photobleaching the lacO array and nuclear site. The immobile fraction was calculated by accounting for this depletion in EZH2 (yellow and red arrows) (see the Materials and Methods). (C) The immobile fraction of 3xFlag-HaloTag-EZH2 at the lacO array and nonspecific nuclear sites. (D) The recovery constant “B” of 3xFlag-HaloTag-EZH2 at the lacO array and nonspecific nuclear sites. C and D show the average and SD of n = 20 cells. Data were collected on 2 d from 10 cells on each day. P-values were generated from a heteroscedastic t-test using a two-tail distribution.
Using a small molecule inhibitor to study how the EED–H3K27me3 interaction contributes to PRC2 chromatin binding in vivo
Given the multitude of factors that could promote PRC2 binding to the lacO array, we sought to test the contribution of the H3K27me3 marks. PRC2 binds to H3K27me3 via its EED subunit, which allosterically activates PRC2 HMTase activity and could also contribute to PRC2 recruitment (Margueron et al. 2009; Margueron and Reinberg 2011). A small molecule (A-395) that competitively inhibits the interaction between EED and H3K27me3 (He et al. 2017) allowed evaluation of the contribution of this binding event to chromatin association of PRC2 in vivo.
Consistent with previously reported data (He et al. 2017), treating HaloTag-EZH2 cells with A-395 for 72 h depleted H3K27me1, H3K27me2, and H3K27me3 (Supplemental Fig. S5A,B). A-395N, a control drug closely related to A-395 but incapable of inhibiting EED, did not cause a reduction in H3K27 methylation. Furthermore, fixed-cell imaging showed a striking depletion in the colocalization of HaloTag-EZH2 with the lacO array upon treatment with A-395 but not with the control drug (Fig. 4A; Supplemental Fig. S6). This could be the direct result of inhibiting the interaction between EED and H3K27me3 or a secondary effect due to the depletion of H3K27me3.
Figure 4.

Depleting H3K27me3 with A-395 destabilizes the association of PRC2 with chromatin. (A) Fixed-cell imaging of HaloTag-EZH2 cells that were untreated, treated with A-395N (an inactive variant of A-395), or treated with A-395 for 72 h. HaloTag-EZH2 was labeled with 500 nM JF549. Arrowheads indicate colocalization of EZH2 with the lacO array, and the dashed circle indicates the absence of EZH2 at the lacO array. (B) The fraction of cells showing colocalization of EZH2 with the lacO array. The average and SD of n > 10 images are shown, with at least 327 cells counted per condition. (C) The lifetime of chromatin-bound EZH2 plotted as a function of time in untreated and drug-treated cells. Time-lapse imaging at 2 Hz was used for the lifetime analysis of static 3xFlag-HaloTag-EZH2. Dots and error bars indicate the average and SD of n = 3 biological replicates using >15 cells per replicate. There is a significant depletion (P < 0.05) in the fraction of particles that remains after 3 sec in the 72-h A-395 treatment compared with the untreated, 72-h A-395N-treated, and 30-min A-395-treated cells. P < 0.05. P-values were generated from a heteroscedastic t-test using a two-tail distribution.
We were unable to use the previous FRAP methodology to study live-cell dynamics of EZH2 because EZH2 was no longer enriched on the lacO array in the presence of A-395. Additionally, single-molecule imaging did not reveal a difference in the chromatin-bound fraction of HaloTag-EZH2 (Supplemental Fig. S7). However, it remained possible that A-395 could affect the residence time of PRC2 on chromatin because ChIP-qPCR (chromatin immunoprecipitation [ChIP] combined with quantitative PCR [qPCR]) demonstrated that A-395 depletes but does not eliminate PRC2 from target genes (He et al. 2017).
Time-lapse imaging was used to evaluate the residence time of chromatin-bound PRC2 (Supplemental Movie S4; Liu et al. 2014; Knight et al. 2015; Hansen et al. 2017) in the presence of A-395 or A-395N. This analysis used intermittent acquisitions at a frame rate of 2 Hz and tracked only particles with a maximum expected diffusion of 0.1 µm2/sec.
The residence time of chromatin-bound HaloTag-EZH2 was not disrupted by a 30-min treatment of A-395, a condition intended to inhibit the interaction between EED and H3K27me3 without reducing H3K27me3 levels (Fig. 4C). In contrast, a 72-h treatment with A-395 decreased the residence time of chromatin-bound HaloTag-EZH2 compared with controls and the 30-min A-395 treatment (Fig. 4C). This reduced residence time is evidenced by a significant decrease in EZH2 that remains chromatin-bound after 3 sec (Fig. 4C – P < 0.05). These results suggest that depleting H3K27me3 modestly reduces the affinity of PRC2 for chromatin but that this reduction may not depend on the interaction between EED and H3K27me3 (see the Discussion).
The interaction between the N terminus of SUZ12 and accessory proteins promotes the recruitment of PRC2 to chromatin
PRC2 accessory proteins such as AEBP2 and the PCL homolog proteins PHF1, MTF2, and PHF19 are correlated with recruiting PRC2 to chromatin, but their effects on PRC2 dynamics have not been studied. We first sought to generate separation-of-function mutations within PRC2 that do not affect the assembly of its core (EZH2, SUZ12, EED, and RbAp46/48) but do disrupt its interaction with specific accessory proteins.
PRC2 was first separated into its catalytic [EZH2–EED–SUZ12(VEFS)] and regulatory [RbAp46/48-SUZ12(N terminus)] lobes because cross-linking data have shown that AEBP2 has numerous interactions with the N terminus of SUZ12 (Ciferri et al. 2012). To assess complex formation, 3xFlag-SUZ12 (wild type or mutants), 3xMyc-EZH2, and either 3xHA-AEBP2 or 3xHA-PHF1 were coexpressed in HEK293T cells and immunoprecipitated with anti-Flag beads. The N terminus of SUZ12 copurified AEBP2 and PHF1, while the catalytic lobe of PRC2 containing the VEFS domain of SUZ12 bound EZH2 but did not interact with AEBP2 or PHF1 (Fig. 5A). MTF2 and PHF19 similarly copurified with the N terminus of SUZ12 (Supplemental Fig. S8A). These findings are consistent with partial structures of PRC2 (Chen et al. 2018; Kasinath et al. 2018) but are in disagreement with previous work suggesting that EZH2 mediates the interaction between PRC2 and PCL homolog proteins (O'Connell et al. 2001).
Figure 5.

The interaction between the PRC2 core and accessory proteins is required for efficient recruitment of PRC2 to chromatin. (A, left) Diagram of PRC2 subunits based on the negative stain electron microscopy (EM) structure (Ciferri et al. 2012). SUZ12, AEBP2, or PCL homolog proteins and EZH2 were tagged with 3xFlag, 3xHA, and 3xMyc, respectively. (Right) αHA, αMyc, and αFlag Western blots on input and elution samples from an αFlag immunoprecipitation. 3xFlag-SUZ12, 3xHA-AEBP2 or 3xHA-PHF1, and 3xMyc-EZH2 were expressed in HEK293T cells. The N terminus of SUZ12(2-560) is necessary to coimmunoprecipitate AEBP2 and PHF1. (B, top) Diagram of SUZ12 separation-of-function mutations. ABHmut (mutated AEBP2-binding helix) refers to SUZ12(95–106)2xNAAIRS, PHF1mut refers to SUZ12(338–353)GSGSGS, and VEFS refers to SUZ12(561–739). (Bottom) Western blots using the indicated primary antibody on input and elution samples from an αFlag immunoprecipitation of 3xFlag-SUZ12 mutants. PHF1 + ABHmut refers to SUZ12 containing both PHF1 and ABH mutations. ABHmut disrupts the interaction between SUZ12 and AEBP2, and PHF1mut disrupts the interaction between SUZ12 and PHF1, while neither mutation disrupts the assembly of SUZ12 with EZH2, EED, or RbAp46/48. (C) Quantification of the eluted Western signals. The HA signal was first normalized to the amount of 3xFlag-SUZ12 in each elution. The binding fraction is the fraction of HA signal in the SUZ12 mutant condition relative to the wild-type SUZ12 condition. Each gray bar represents the mean, and each dot represents the results from a biological replicate. (D) Dfree (left) and fraction bound (right) of 3xFlag-HaloTag-EZH2 in cells transfected with the indicated 3xFlag-SUZ12 variants, a siRNA pool targeting the SUZ12 3′ untranslated region (UTR), and a nuclear BFP as a transfection marker. NTC refers to cells transfected with a nontargeting pool of siRNA and nuclear BFP. 3xFlag-HaloTag-EZH2 cells were labeled with 5 nM JF646 and imaged at 97.5 Hz. SLIMfast and evalSPT were used to localize, track, and evaluate single-molecule trajectories, and Spot-On was used to calculate the Dfree and fraction bound of 3xFlag-HaloTag-EZH2. (E) Diffusion coefficients, chromatin-bound fractions, and molecular weights of the various PRC2 mutant complexes. D and E show the average and SD from n = 3 biological replicates using >12 cells per replicate. P-values were generated from a heteroscedastic t-test using a two-tail distribution.
AEBP2 and PHF1 have been considered to bind PRC2 at the same site, given that they interact with PRC2 in a mutually exclusive manner (Grijzenhout et al. 2016; Oliviero et al. 2016). Based on the recent cryo-electron microscopy (cryo-EM) structure (Kasinath et al. 2018), we mutated the AEBP2-binding helix (ABHmut) on SUZ12 [SUZ12(95–106)2xNAAIRS] and found that this disrupted the interaction between PRC2 and AEBP2 but surprisingly did not affect the interaction with PHF1 (Fig. 5B,C). Screening SUZ12 for a different interaction site with PHF1 identified SUZ12(PHF1mut) [SUZ12(338–353)GSGSGS]. PHF1mut disrupted the interaction between PRC2 and PHF1 but did not disrupt the association of PRC2 with AEBP2 (Fig. 5B,C). Furthermore, PHF1mut disrupted the interaction between PRC2 and PHF19 (Supplemental Fig. S8B). As expected, a SUZ12 double mutant containing the mutated residues in both PHF1mut and ABHmut (PHF1 + ABHmut) was no longer able to interact with AEBP2, PHF1, or PHF19 (Fig. 5B,C; Supplemental Fig. S8B). Importantly, these are separation-of-function mutants that retain the association of SUZ12 with EED, EZH2, and RbAp46/48 (Fig. 5B, EED, Myc, and RbAp46/48 blots, respectively).
These mutants were used to study how PRC2 accessory proteins affect PRC2 dynamics in vivo. Specifically, wild-type SUZ12, SUZ12(PHF1 + ABHmut), or SUZ12(VEFS) was expressed in HaloTag-EZH2 cells while simultaneously knocking down endogenous SUZ12 with siRNA (Supplemental Fig. S8C). To control for nonspecific effects on PRC2 dynamics, a nontargeting pool of siRNA (NTC) was also transfected without SUZ12 overexpression. Diffusion and fraction-bound analyses were then performed on HaloTag-EZH2 using conditions identical to those applied in Figure 2.
The Dfree of HaloTag-EZH2 increased slightly when complexed with 3xFlag-SUZ12(PHF1 + ABHmut) and increased significantly (P < 0.001) with 3xFlag-SUZ12(VEFS) (Fig. 5D,E; Supplemental Fig. S9; Supplemental Movies S5–S7). Additionally, the amount of chromatin-bound PRC2 was significantly depleted (P < 0.006) in the presence of either 3xFlag-SUZ12(PHF1 + ABHmut) or 3xFlag-SUZ12(VEFS) (Fig. 5D,E; Supplemental Fig. S9; Supplemental Movies S5–S7). The residual 0.08 fraction bound seen with these mutants approaches the background level of chromatin binding seen with HaloTag proteins alone (see the Discussion; Hansen et al. 2018).
Lysate from these cells was subjected to an αEZH2 immunoprecipitation to test the possibility that these mutations prevented association with the imaged HaloTag-EZH2. There was no appreciable difference in the amount 3xFlag-SUZ12 that immunoprecipitated with an αEZH2 antibody between wild-type SUZ12, SUZ12(PHF1 + ABHmut), and SUZ12(VEFS) (Supplemental Fig. S8D). We conclude that the interaction between SUZ12 and these accessory proteins is a major contributor to the association of PRC2 with chromatin in vivo.
Discussion
How human PRC2 is recruited to chromatin for epigenetic silencing remains a major question in the field. Clearly, PRC2 can bind histone H3 N-terminal tails; DNA (Choi et al. 2017; Wang et al. 2017); RNA (Long et al. 2017); various accessory subunits, including AEBP2, PCL homolog proteins, JARID2, and EPOP (Holoch and Margueron 2017); and other proteins, including histone H1 (Martin et al. 2006). However, which of these interactions dominates PRC2 recruitment in vivo has remained controversial. Here, using live-cell single-molecule imaging, we found that H3K27me3 marks have only a modest and perhaps indirect effect on PRC2 affinity for chromatin, whereas AEBP2 and PCL homolog subunits make a very large contribution. Given that these accessory subunits are involved in DNA binding, this conclusion is concordant with recent work in vitro suggesting that PRC2 mostly “sees” the protein-free linker DNA in nucleosome arrays (Choi et al. 2017; Wang et al. 2017).
Single-molecule imaging reveals that PRC2 is highly mobile
To avoid overexpression artifacts, the intracellular dynamics of PRC2 were studied using EZH2 and SUZ12 genome-edited cell lines. We were particularly concerned that even modest overexpression of one subunit of a multisubunit complex could drive assembly of unnatural subcomplexes or produce free protein. A recent study used overexpressed eGFP-EZH2 and fluorescence correlation spectroscopy to measure the Dfree of EZH2 as ∼7 µm2/sec (Hetey et al. 2017). This is in contrast to our measured EZH2 Dfree of 2.09 µm2/sec ± 0.12 µm2/sec. This discrepancy could be due to overexpression generating a faster population of free EZH2 that is not complexed with PRC2.
We found that endogenously expressed HaloTag-EZH2 protein levels were similar to parental EZH2, and the tagged protein maintained H3K27me3 at normal levels. Most imaging was performed with HaloTag-EZH2 because HaloTag-SUZ12 gave reduced expression of SUZ12 and a lower amount of H3K27me3. We suggest that the reduced level of H3K27me3 was secondary to a reduction in PRC2 because EZH2 levels were also reduced in the HaloTag-SUZ12 clone.
Assembled PRC2 has a molecular weight of ∼320 kDa, and tracking either EZH2 or SUZ12 gave nearly identical Dfree measurements of 2.09 ± 0.12 µm2/sec and 1.99 ± 0.13 µm2/sec, respectively. These diffusion coefficients are slower than those measured for smaller nuclear proteins (HaloTag-Sox2 is ∼67 kDa and has a Dfree of ∼ 2.7 µm2/sec [Liu et al. 2014], and HaloTag-hCTCF is ∼160 kDa and has a Dfree of 2.5 µm2/sec [Hansen et al. 2017]). Thus, the measured diffusion coefficient of ∼2.0 µm2/sec for PRC2 is consistent with imaging a larger macromolecular complex. In our experiments, HaloTag-EZH2 was labeled with a low concentration of JF646 to avoid high particle densities and tracking errors. Consistent with accurate imaging and analysis, Dfree of PRC2 increases gradually with mutations that decrease the size of the complex (Fig. 5D,E).
PRC1 is also highly mobile but has a slower diffusion profile than PRC2
EZH2 and SUZ12 have similar chromatin-bound fractions of 20% ± 3% and 25% ± 3%, respectively. Previous intracellular dynamics studies have been conducted on PRC1, the H2A ubiquitinating complex that shares no protein subunits with PRC2 (Hernandez-Munoz et al. 2005; Fonseca et al. 2012; Zhen et al. 2016). One study observed that the majority of PRC1 is also freely diffusing (Zhen et al. 2016), but the distribution of diffusion coefficients is distinctly slower than the distribution that we report for PRC2 in Supplemental Figure S3A. This could be due to unique differences in the chromatin-binding properties of the complexes or cell line differences between these studies. Indeed, the intracellular dynamics of PRC1 are cell line-specific (Fonseca et al. 2012), and the same could also be true for PRC2. Additionally, a FRAP study conducted in U2OS cells identified PRC1 as having a chromatin-bound fraction of ∼40% at enriched polycomb domains (Hernandez-Munoz et al. 2005). This is similar to the 40% of chromatin-bound EZH2 at the PRC2-enriched lacO array reported in this study. Taken together, PRC2 seems to be a highly dynamic complex with a faster diffusion profile than PRC1.
Live-cell imaging reveals information about the mode of action of an anti-cancer drug
A-395 is a small molecule inhibitor that disrupts the EED–H3K27me3 interaction. It was originally developed as an anti-cancer therapeutic and shows efficacy in a mouse lymphoma xenograft model (He et al. 2017). Here, we confirm in human osteosarcoma cells (U2OS cells) that the drug reduces H3K27me3 accumulation but has no short-term effect on PRC2 chromatin residence time genome-wide (Fig. 4D, 30-min A-395 treatment). Thus, the drug appears to act primarily as an HMTase inhibitor, consistent with its inhibiting allosteric activation by histone tail binding to EED (He et al. 2017), and may additionally inhibit PRC2 recruitment through long-term alteration of the chromatin landscape. In the future, the HaloTag-EZH2 cells engineered here could be used to screen other small molecule drugs to determine their effects on individual steps of PRC2 action.
Implications for PRC2 architecture
We thought that AEBP2 and the PCL homolog proteins might interact with PRC2 at identical sites, given that they are mutually exclusive for PRC2 binding (Grijzenhout et al. 2016; Oliviero et al. 2016). Instead, we identified mutations along SUZ12 that disrupt the interaction with AEBP2 but do not disrupt the interaction with PHF1 and vice versa (Fig. 5B,C). These findings can be reconciled by positing that distinct amino acids on SUZ12 are responsible for binding AEBP2 and PHF1, but the two proteins occupy overlapping space such that their binding is mutually exclusive (Fig. 6A).
Figure 6.

Model for human PRC2 recruitment to chromatin. (A) AEBP2 and PHF1 interact with the N terminus of SUZ12 at nonidentical sites, but their binding is mutually exclusive. (B) PRC2 interacts with interchangeable accessory proteins via the N terminus of SUZ12 to promote PRC2 recruitment to chromatin. (1) Initial binding of PRC2 to DNA does not require H3K27me3, but the presence of H3K27me3 indirectly stabilizes chromatin binding (the shorter arrow indicates a slower off rate). (2) After PRC2 is bound, H3K27me3 binding to its EED subunit provides allosteric activation. (3) Nearby nucleosomes are then H3K27-trimethylated by the EZH2 subunit.
Recently, structures of PRC2 complexed with AEBP2 have been reported (Chen et al. 2018; Kasinath et al. 2018). One of these studies identified the C2 domain of SUZ12 as an AEBP2-binding site (Chen et al. 2018), and another identified a separate ABH in the “neck region” of PRC2 (Kasinath et al. 2018). In accordance with the cryo-EM structure, mutating the ABH of SUZ12 disrupted the interaction between SUZ12 and AEBP2 (Fig. 5B,C). However, mutating the β8 strand within the C2 domain [SUZ12(PHF1mut)] did not disrupt the interaction between PRC2 and AEBP2 (Fig. 5B,C) but did disrupt the interaction with PHF1. It remains possible that the interaction between AEBP2 and PRC2 is dominated by the “neck region” and that a different functional interaction occurs at the C2 domain interface.
While little is known about the interaction between PRC2 and PHF1, a previous study used cross-linking mass spectrometry to identify an interaction between PHF19 and Lys343 of mouse SUZ12 (Kloet et al. 2016). This finding agrees well with the immunoprecipitation results presented here; SUZ12(PHF1mut) has mutations surrounding K343 and is no longer able to interact with either PHF1 or PHF19.
Additional structural studies regarding this interaction will help elucidate the similarities and differences between the AEBP2–PRC2 and PCL–PRC2 complexes.
Understanding intracellular PRC2 chromatin binding
Previous studies have suggested that H3K27me3 is capable of recruiting PRC2 to chromatin (Holoch and Margueron 2017). However, in vitro binding and structural studies (Poepsel et al. 2018) have argued recently that PRC2 associates with DNA along nucleosome arrays in the context of both PHF1–PRC2 (Choi et al. 2017) and AEBP2–PRC2 (Wang et al. 2017). Dramatically, SUZ12(N terminus) is recruited to PRC2 target loci in SUZ12 knockout cells in the absence of H3K27 methylation (Hojfeldt et al. 2018), indicating that H3K27me3 is not necessary for PRC2 recruitment.
Similarly, our live-cell single-molecule imaging shows that the chromatin-bound fraction of PRC2 is depleted when PRC2 contains SUZ12(VEFS) or N-terminal SUZ12 mutations that interfere with binding to AEBP2 and PCL homolog proteins. Our immunoprecipitation studies indicate that the assembly of the core PRC2 subunits is unaffected by these mutations, but we cannot exclude the possibility that these mutations also affect the interaction between PRC2 and additional proteins such as JARID2 and EPOP. Much, or perhaps all, of the 8% of PRC2 that remains chromatin-bound (Fig. 5D) in the absence of the interaction between SUZ12 and these accessory proteins could be background chromatin binding, given that the HaloTag alone is reported to have a chromatin-bound fraction of ∼10% (Hansen et al. 2018).
These findings put additional doubt on H3K27me3 recruiting PRC2 to chromatin through an interaction with EED because EED is still present in these SUZ12 mutant PRC2 complexes (Fig. 5B). Also in agreement with this, 30-min treatment of cells with A-395 had no effect on the chromatin residence time of PRC2. While 72 h of drug treatment did decrease the stability of PRC2 on chromatin (Fig. 4C), the reduced residence time could be attributed to altered chromatin architecture, hyperactive transcription, or other secondary effects due to the depletion of H3K27me3.
Comparing the dynamics of SUZ12(VEFS) with ChIP-seq (ChIP combined with high-throughput sequencing) from Hojfeldt et al. (2018) suggests that the freely diffusing fraction of PRC2 is capable of “crop-dusting” chromatin with nonspecific H3K27 methylation. We observed that PRC2 is significantly more mobile in the context of SUZ12(VEFS), while Hojfeldt et al. (2018) report that this PRC2 variant can rescue H3K27me3 levels, albeit at nonspecific loci, in SUZ12 knockout cells. These results suggest that even the highly mobile population of PRC2 is depositing methyl marks while transiently bound.
Taken together with these previous studies, our findings support a model in which the N terminus of SUZ12 interacts in an “either/or” manner with AEBP2 and PCL homolog proteins and perhaps with additional proteins not studied here, driving the association of PRC2 with chromatin in cells (Fig. 6B). These resulting complexes then achieve affinity for chromatin primarily by binding nucleosome-free DNA or DNA linker regions between adjacent nucleosomes (Wang et al. 2017) or histone PTMs recognized by these accessory proteins. Although PRC2 clearly must also bind histone tails and H3K27me3, these are micromolar affinity interactions and do not significantly contribute to the affinity of PRC2 for chromatin.
Materials and methods
Tissue culture, A-395 treatment, and transfections
All cell lines were maintained in Dulbecco's modified Eagle medium containing 10% FBS, 2 mM GlutaMAX-I, 100 U/mL penicillin, and 100 µg/mL streptomycin (complete medium) in a humidified incubator at 37°C and 5% CO2.
Both A-395N and A-395 were dissolved in DMSO to a working concentration of 10 mM. HaloTag-EZH2 U2OS cells (2.5 × 10⁵) were plated in one well of a 6-well dish with either 10 µM A-395N or 10 µM A-395. After treating cells for 55 h, 5 × 10⁵ cells were split into imaging dishes and imaged ∼17 h later.
All U2OS cells were transfected using a Nucleofector 2b device (Lonza) and kit V (Lonza, VCA-1003) per the manufacturer's protocol using 1.5 µg of plasmid DNA ± 150 pmol siRNA. Transfected U2OS cells used for imaging were grown for 48 h after transfection and then split onto imaging dishes. All HEK293T cells were transfected using Lipofectamine 2000 (Thermo Fisher, 11668019) per the manufacturer's protocol.
Plasmid construction and oligonucleotide sequences
px330 plasmids
EZH2 and SUZ12 sgRNAs were inserted into px330 plasmids as described in Cong et al. (2013) using the following spacer sequences: GAGAAGGGACCAGTTTGTTGG for EZH2 and GCCTCCCCCGGACCCCGCGC for SUZ12.
Homology-directed repair (HDR) plasmids
HDR vectors were generated using Gibson assembly (New England Biosciences, E2611) and PCR from genomic DNA.
PRC2 cDNA plasmids
cDNA expression plasmids were generated by restriction enzyme cloning and PCR mutagenesis. All SUZ12 mutations refer to the SUZ12 isoform 1 (739 amino acids).
OnTarget plus siRNAs to the SUZ12 3′ UTR were ordered individually from Dharmacon and then pooled together for transfections using the following SUZ12 siRNA sense strand sequences: AGAUGUAGGUGUAGAAUUAUU, GAUCAAUGCUGCUGUAAAUUU, UAGUAGAUCUCGAGCGUUUUU, and UUAGAUAAUCACACGGAAAUU.
CRISPR/Cas9 genome editing and genomic DNA extraction
HaloTag genome editing was performed as reported previously (Xi et al. 2015). In brief, 106 F42B8 cells (a kind gift from Karsten Rippe) were transfected using a Nucleofector 2b device (Lonza) and kit V (Lonza, VCA-1003) per the manufacturer's protocol with px330 plasmid and HDR vector. To select for genomic integration of the HDR plasmid, cells were trypsinized and expanded to a 10-cm2 dish in complete medium supplemented with 1 µg/mL puromycin (Sigma-Aldrich, P8833) 48 h after the transfection. Cells were selected with puromycin for a total of 7 d.
Of the surviving cells, 106 were transfected with 2 µg of pBS598 EF1α-EGFPcre recombinase plasmid. pBS598 EF1α-EGFPcre was a gift from Brian Sauer (Addgene, 11923) (Le et al. 1999). Forty-eight hours after transfection, single cells were sorted into single wells of a 96-well plate using fluorescence-activated cell sorting at an excitation wavelength of 488 nm. After clones grew out, genomic DNA was extracted based on the protocol reported in Laird et al. (1991). Oligos used for PCR were as follows: DY 132 (EZH2 LHA up [F], GCTGCAGCATCATCTAACCTGG), DY 135 (EZH2 RHA down [R], CAGTGAGTCAGAAAACCTTGCTC), DY 137 (SUZ12 LHA up [F], CATCTTGTCCAACCTGAAATTCAAATC), and DY 138 (SUZ12 RHA down [R], GGGAACCAATCAGGATATAACATTCC).
Whole-cell Western blot analysis
Cells (106) were resuspended in 1× NuPAGE LDS sample buffer (Thermo Fisher Scientific, NP0008) supplemented with 36 mM β-mercaptoethanol (Sigma-Aldrich, M6250) and 2500 U/mL benzonase (Sigma-Aldrich, E1014). The cell resuspension was heated for 15 min to 37°C and for 5 min to 98°C, placed for 30 sec on ice, and spun at >13,000 rcf for 30 sec. The protein extracts and 7.5 µL of protein ladder (SeeBlue Plus 2, Invitrogen, LC5925) were run on NuPAGE 4%–12% Bis-Tris protein gels (Thermo Fisher Scientific, NP0321) for 1 h at 150 V. The gels were transferred using standard Western blotting protocols onto 0.45-µm nitrocellulose membranes (GE Healthcare, 10600002).
Blots were blocked in StartingBlock T20 (PBS) blocking buffer (Thermo Fisher, 37539). All primary and secondary antibodies were diluted in StartingBlock T20 (PBS) blocking buffer (Thermo Fisher, 37539). Primary and secondary antibody incubations were washed four times in PBS + 0.05% Tween-20 and once in PBS. All Western blots were quantified using ImageQuant TL. The following antibodies were used at the indicated dilutions: EED (1/200; Abcam, 4469), EZH2 (1/1000; Cell Signaling, 5246), Flag-HRP (1/2500; Sigma-Aldrich, A8592), H3 (1/1000; Abcam, 1791), H3K27me3 (1/500; Cell Signaling, 9733), SUZ12 (1/200; Santa Cruz Biotechnology, sc-67105), RbAp46/48 (1/1000; Cell Signaling, 4633), HA (1/1000; Abcam, 18181), Myc (1/1000; Cell Signaling, 2272), goat α-mouse IgG-HRP (1/5000; Jackson ImmunoResearch, 715-035-150), and goat α-rabbit IgG-HRP (1/5000; Jackson ImmunoResearch, 715-035-152).
Flag immunoprecipitation on ectopically expressed 3xFlag-SUZ12
HEK293T cells (1.25 × 10⁶) were plated in wells of a six-well dish ∼17 h before transfection. Forty-eight hours after transfection, cells were trypsin-harvested and washed twice with cold 1× PBS. Cells were lysed in 250 µL of cold NP-40 lysis buffer (1% nonidet P 40 substitute [Sigma-Aldrich, 74385], 25 mM Tris at pH 7.5, 5% glycerol, 150 mM NaCl, 2.5 mM MgCl2, 1× protease inhibitor cocktail [Thermo Fisher, A32965], 2 mM tris [2-carboxyethyl] phosphine [TCEP] at pH 7.0 [Thermo Fisher, 20490], 250 U/mL benzonase [Sigma-Aldrich, E1014]) for 30 min on ice with vortexing every 5 min. Cell lysate was clarified by centrifugation at >13,000 rcf for 10 min at 4°C. Lysate (150 µL) was bound to 15 µL of pre-equilibrated anti-Flag affinity resin (Sigma-Aldrich, A2220) resuspended in 50 µL of lysis buffer. The binding was performed for 2 h at 4°C, rotating end over end.
Beads were then washed four times with wash buffer (1% nonidet P 40 substitute [Sigma-Aldrich, 74385], 25 mM Tris at pH 7.5, 5% glycerol, 150 mM NaCl, 2.5 mM MgCl2,) at room temperature. The final wash was completely removed, and bound proteins were eluted for 30 min at room temperature in 60 µL of wash buffer supplemented with 150 ng/µL 3xFlag peptide (Sigma-Aldrich, F4799).
Live-cell single-molecule imaging
Live-cell imaging dishes were prepared as follows: Schott Nexterion 1.5H 22-mm × 22-mm coverslips (170 µm ± 5 µm) were sonicated for 30 min in 1 M KOH and an additional 30 min in 200 proof ethanol (Decon Labs, 2701). The treated coverslips were attached to the bottoms of the 35-mm dishes containing a hole in the center using Sylgard 184 silicone elastomer kit (Dow Corning, 3097366-1004).
Cells were plated on these coverslips ∼17 h before imaging and labeled with HaloTag Janelia fluor 646 (JF646 was a gift from the Lavis laboratory) for 30 sec in 37°C complete medium at a concentration that produced ∼10 localizations per frame (Zhen et al. 2016). The concentrations used were 5 nM HaloTag-EZH2 and 25 nM HaloTag-SUZ12.
Cells were imaged in 2 mL of FluoroBrite DMEM (Thermo Fisher, A1896701) at 37°C and 5% CO2. All single-molecule imaging was performed under high-incline laser conditions (Tokunaga et al. 2008) on a Nikon N-Storm microscope described previously (Schmidt et al. 2016). All imaging was performed using HiLo illumination (Tokunaga et al. 2008). Diffusion imaging was performed at 97.5 fps, 25% AOTF, and continuous illumination, whereas lifetime analysis imaging was performed at 2 fps, 15% AOTF, and 31-msec exposures of intermittent illumination. n > 12 cells were analyzed for each biological replicate.
Single-particle tracking
Particles were localized and tracked using MatLab 2011b to run SLIMfast (Serge et al. 2008). The trajectories of the particles were evaluated using evalSPT (Normanno et al. 2015). Particle trajectories were visually inspected, revealing that most molecules were tracked correctly and that trajectories followed single molecules. Diffusion coefficients and fractions bound were obtained with Spot-On using the following parameters: KineticModel = two-state, dZ = 0.7 µm, TimePoints = seven, GapsAllowed = one, JumpsToConsider = four, MaxJump = 3 µm, LocError = 0.035 µm, Dbound = [0.0005;0.08], Dfree = [0.15;25], Iterations = three, BinWidth = 0.01 µm, and ModelFit = CDF.
For static particle residence time (Fig. 4C), we used the empirical cumulative distribution function (MatLab) on all tracked particles to determine the survival probability of each of the particles as a function of time. For diffusion analysis, the following parameters were used: lag time = 10.3 msec, λex = 647 nm, λem = 670 nm, pixel size = 160 nm, numerical aperture = 1.49, expected Dmax = 10 µm2/sec, track length = more than two frames, deflation loops = none, localization error = 10−6, maximum competitors = one, and blinking = two frames. For survival probability (Fig. 4C), the following parameters were used: lag time = 500 msec, λex = 647 nm, λem = 670 nm, pixel size = 160 nm, numerical aperture = 1.49, expected Dmax = 0.1 µm2/sec, track length = more than three frames, deflation loops = none, localization error = 10−6, maximum competitors = one, and blinking = two frames.
FRAP imaging
3xFlag-HaloTag-EZH2 U2OS cells (5 × 10⁵) were plated in prepared imaging dishes (detailed above) in a total of 2 mL of complete medium ∼17 h before imaging. Cells were then labeled with 500 nM JF646 for 5 min and diluted in 37°C complete medium. The labeling medium was removed, and cell washes were performed as detailed above.
FRAP imaging was performed on a Nikon A1R scanning confocal microscope equipped with a quad emission filter, a 100× oil immersion objective, a 638-nm laser line, and an environmental chamber to control temperature, humidity, and CO2 levels. Nikon software was set to Nyquist acquisition with the following settings: pinhole size = 4.2 AU, fast mode pixel dwell time = 2.2 µsec, 638-nm laser power for acquisition = 2.0% AOTF, and 638-nm laser power for stimulation/bleach = 75% AOTF.
Regions of interest (ROIs) with identical areas were drawn around the EZH2-enriched lacO array and around two other nuclear sites (one was photobleached and the other was a reference ROI). The cells were then imaged for 30 sec before photobleaching, photobleached within the ROIs for 2 sec, and then imaged for 5 min after photobleaching to monitor recovery. The frame rate for all acquisitions was 0.5 fps except during stimulation, where the laser was illuminated for a continuous 2 sec. Mean intensity (t) data within each ROI were used for quantification of fluorescence recovery.
Quantifying recovery after photobleaching
All quantification of fluorescence recovery was done in Matlab. The background fluorescence (signal outside of the nucleus) was first subtracted from the intensity (t) within each ROI inside the nucleus. The normalized fluorescence recovery within either the nuclear nonspecific ROI or the lacO ROI was fit to y(t) = A(1 − e−Bt). We found that total fluorescent EZH2 was depleted after photobleaching the lacO array and nuclear site. A reference ROI within the same nucleus was used to calculate the fraction of fluorescent EZH2 remaining at the end of imaging (dotted line Fig. 3B) to account for both stimulation- and acquisition-induced photobleaching (C = [EZH2 fluorescence]end of imaging/[EZH2 fluorescence]before photobleach). The corrected immobile fraction = C − A. The recovery constant was reported as the value B of the fit curve.
Immunofluorescence and DNA-FISH imaging
Cells (1.5 × 10⁵) were plated in wells of a 24-well glass imaging dish (Cellvis, P24-1.5H-N) for ∼17 h before performing immunofluorescence. Cells were labeled for 5 min with 500 nM JF549 (Grimm et al. 2015) and then fixed in 1× PBS supplemented with 3.7% formaldehyde (Thermo Fisher, BP531500) for 10 min at room temperature. Fixing solution was removed, and the cells were washed twice with PBS and permeabilized in 1× PBS containing 0.1% Triton X-100 for 5 min at room temperature.
Cells were then dehydrated using 70% ethanol for 5 min at 4°C followed by 95% ethanol for 5 min at 4°C and then 100% ethanol for 5 min at 4°C. The ethanol was then removed entirely, and the cells were air-dried.
Hybridization buffer (70% formamide, 12 mM Tris at pH 8.0, 5 mM KCl, 1 mM MgCl2, 0.001% Triton X-100, 0.1 µg/mL salmon DNA) with 200 nM lacO PNA FISH probe (Alexa647-O-AATTGTTATCCGCTCAC) was heated to 78°C, and 400 µL was added to each well of the 24-well plate. The wells were then heated for 5 min to 78°C in the dark and then placed in a dark humidified chamber for 2 h at room temperature.
The hybridization buffer was removed, and the cells were rinsed once with 70% formamide/2× saline sodium citrate (SSC) buffer, washed twice with 70% formamide/2× SSC buffer for 15 min each, and washed three times with 1× PBS for 5 min each. The final wash was then replaced with 1× PBS containing 1 µg/mL Hoechst dye and 0.02% NaN3.
All fixed-cell imaging was performed on a DeltaVision Core microscope (Applied Precision). Twelve Z-sections were collected in 0.2-µm increments. A maximum intensity projection was used for presentation and quantification of colocalization.
Competing interest statement
T.R.C. is on the board of directors of Merck and Co. and is a scientific advisor for Storm Therapeutics.
Supplementary Material
Acknowledgments
We thank Karsten Rippe (University of Heidelberg, Germany) and David Spector (Cold Spring Harbor Laboratory, Cold Spring Harbor, NY) for providing the U2OS lacO array cell lines, and Luke Lavis and Zhe Liu (Howard Hughes Medical Institute Janelia Research Campus, Ashburn, VA) for providing the HaloTag Janelia dyes and the MatLab image analysis software used in this study We also thank all members of the Cech laboratory, especially Ci Ji Lim and Yicheng Long, for helpful discussions and suggestions; Dr. Joe Dragavon (University of Colorado at Boulder BioFrontiers Imaging Facility); and Theresa Nahreini (University of Colorado at Boulder Biochemistry Cell Culture Facility; S10ODO21601). A-395N and A-395 were supplied by the Structural Genomics Consortium under an Open Science Trust Agreement (http://www.thesgc.org/click-trust). J.C.S. was the recipient of an award from the National Institutes of Health (K99-GM120386). T.R.C. is an investigator of the Howard Hughes Medical Institute.
Author contributions: D.T.Y. conceptualized and performed experiments, performed data analysis and interpretation, and wrote and revised the manuscript. J.C.S. and T.R.C. conceptualized experiments, interpreted data, and wrote and revised the manuscript.
Footnotes
Supplemental material is available for this article.
Article published online ahead of print. Article and publication date are online at http://www.genesdev.org/cgi/doi/10.1101/gad.311936.118.
References
- Ballare C, Lange M, Lapinaite A, Martin GM, Morey L, Pascual G, Liefke R, Simon B, Shi Y, Gozani O, et al. 2012. Phf19 links methylated Lys36 of histone H3 to regulation of Polycomb activity. Nat Struct Mol Biol 19: 1257–1265. [DOI] [PMC free article] [PubMed] [Google Scholar]
- Brien GL, Gambero G, O'Connell DJ, Jerman E, Turner SA, Egan CM, Dunne EJ, Jurgens MC, Wynne K, Piao L, et al. 2012. Polycomb PHF19 binds H3K36me3 and recruits PRC2 and demethylase NO66 to embryonic stem cell genes during differentiation. Nat Struct Mol Biol 19: 1273–1281. [DOI] [PubMed] [Google Scholar]
- Cao R, Zhang Y. 2004. SUZ12 is required for both the histone methyltransferase activity and the silencing function of the EED–EZH2 complex. Mol Cell 15: 57–67. [DOI] [PubMed] [Google Scholar]
- Casanova M, Preissner T, Cerase A, Poot R, Yamada D, Li X, Appanah R, Bezstarosti K, Demmers J, Koseki H, et al. 2011. Polycomblike 2 facilitates the recruitment of PRC2 Polycomb group complexes to the inactive X chromosome and to target loci in embryonic stem cells. Development 138: 1471–1482. [DOI] [PMC free article] [PubMed] [Google Scholar]
- Chen J, Zhang Z, Li L, Chen BC, Revyakin A, Hajj B, Legant W, Dahan M, Lionnet T, Betzig E, et al. 2014. Single-molecule dynamics of enhanceosome assembly in embryonic stem cells. Cell 156: 1274–1285. [DOI] [PMC free article] [PubMed] [Google Scholar]
- Chen S, Jiao L, Shubbar M, Yang X, Liu X. 2018. Unique structural platforms of Suz12 dictate distinct classes of PRC2 for chromatin binding. Mol Cell 69: 840–852.e5. [DOI] [PMC free article] [PubMed] [Google Scholar]
- Choi J, Bachmann AL, Tauscher K, Benda C, Fierz B, Muller J. 2017. DNA binding by PHF1 prolongs PRC2 residence time on chromatin and thereby promotes H3K27 methylation. Nat Struct Mol Biol 24: 1039–1047. [DOI] [PubMed] [Google Scholar]
- Ciferri C, Lander GC, Maiolica A, Herzog F, Aebersold R, Nogales E. 2012. Molecular architecture of human polycomb repressive complex 2. Elife 1: e00005. [DOI] [PMC free article] [PubMed] [Google Scholar]
- Comet I, Riising EM, Leblanc B, Helin K. 2016. Maintaining cell identity: PRC2-mediated regulation of transcription and cancer. Nat Rev Cancer 16: 803–810. [DOI] [PubMed] [Google Scholar]
- Cong L, Ran FA, Cox D, Lin S, Barretto R, Habib N, Hsu PD, Wu X, Jiang W, Marraffini LA, et al. 2013. Multiplex genome engineering using CRISPR/Cas systems. Science 339: 819–823. [DOI] [PMC free article] [PubMed] [Google Scholar]
- Davidovich C, Zheng L, Goodrich KJ, Cech TR. 2013. Promiscuous RNA binding by Polycomb repressive complex 2. Nat Struct Mol Biol 20: 1250–1257. [DOI] [PMC free article] [PubMed] [Google Scholar]
- Fonseca JP, Steffen PA, Muller S, Lu J, Sawicka A, Seiser C, Ringrose L. 2012. In vivo Polycomb kinetics and mitotic chromatin binding distinguish stem cells from differentiated cells. Genes Dev 26: 857–871. [DOI] [PMC free article] [PubMed] [Google Scholar]
- Grijzenhout A, Godwin J, Koseki H, Gdula MR, Szumska D, McGouran JF, Bhattacharya S, Kessler BM, Brockdorff N, Cooper S. 2016. Functional analysis of AEBP2, a PRC2 Polycomb protein, reveals a Trithorax phenotype in embryonic development and in ESCs. Development 143: 2716–2723. [DOI] [PMC free article] [PubMed] [Google Scholar]
- Grimm JB, English BP, Chen J, Slaughter JP, Zhang Z, Revyakin A, Patel R, Macklin JJ, Normanno D, Singer RH, et al. 2015. A general method to improve fluorophores for live-cell and single-molecule microscopy. Nat Methods 12: 244–250. [DOI] [PMC free article] [PubMed] [Google Scholar]
- Hansen AS, Pustova I, Cattoglio C, Tjian R, Darzacq X. 2017. CTCF and cohesin regulate chromatin loop stability with distinct dynamics. Elife 6: e25776. [DOI] [PMC free article] [PubMed] [Google Scholar]
- Hansen AS, Woringer M, Grimm JB, Lavis LD, Tjian R, Darzacq X. 2018. Robust model-based analysis of single-particle tracking experiments with Spot-On. Elife 7: e33125. [DOI] [PMC free article] [PubMed] [Google Scholar]
- Hauri S, Comoglio F, Seimiya M, Gerstung M, Glatter T, Hansen K, Aebersold R, Paro R, Gstaiger M, Beisel C. 2016. A high-density map for navigating the human polycomb complexome. Cell Rep 17: 583–595. [DOI] [PubMed] [Google Scholar]
- He Y, Selvaraju S, Curtin ML, Jakob CG, Zhu H, Comess KM, Shaw B, The J, Lima-Fernandes E, Szewczyk MM, et al. 2017. The EED protein–protein interaction inhibitor A-395 inactivates the PRC2 complex. Nat Chem Biol 13: 389–395. [DOI] [PubMed] [Google Scholar]
- Hernandez-Munoz I, Taghavi P, Kuijl C, Neefjes J, van Lohuizen M. 2005. Association of BMI1 with polycomb bodies is dynamic and requires PRC2/EZH2 and the maintenance DNA methyltransferase DNMT1. Mol Cell Biol 25: 11047–11058. [DOI] [PMC free article] [PubMed] [Google Scholar]
- Hetey S, Boros-Olah B, Kuik-Rozsa T, Li Q, Karanyi Z, Szabo Z, Roszik J, Szaloki N, Vamosi G, Toth K, et al. 2017. Biophysical characterization of histone H3.3 K27M point mutation. Biochem Biophys Res Commun 490: 868–875. [DOI] [PubMed] [Google Scholar]
- Hojfeldt JW, Laugesen A, Willumsen BM, Damhofer H, Hedehus L, Tvardovskiy A, Mohammad F, Jensen ON, Helin K. 2018. Accurate H3K27 methylation can be established de novo by SUZ12-directed PRC2. Nat Struct Mol Biol 25: 225–232. [DOI] [PMC free article] [PubMed] [Google Scholar]
- Holoch D, Margueron R. 2017. Mechanisms regulating PRC2 recruitment and enzymatic activity. Trends Biochem Sci 42: 531–542. [DOI] [PubMed] [Google Scholar]
- Hunkapiller J, Shen Y, Diaz A, Cagney G, McCleary D, Ramalho-Santos M, Krogan N, Ren B, Song JS, Reiter JF. 2012. Polycomb-like 3 promotes polycomb repressive complex 2 binding to CpG islands and embryonic stem cell self-renewal. PLoS Genet 8: e1002576. [DOI] [PMC free article] [PubMed] [Google Scholar]
- Janicki SM, Tsukamoto T, Salghetti SE, Tansey WP, Sachidanandam R, Prasanth KV, Ried T, Shav-Tal Y, Bertrand E, Singer RH, et al. 2004. From silencing to gene expression: real-time analysis in single cells. Cell 116: 683–698. [DOI] [PMC free article] [PubMed] [Google Scholar]
- Jegou T, Chung I, Heuvelman G, Wachsmuth M, Gorisch SM, Greulich-Bode KM, Boukamp P, Lichter P, Rippe K. 2009. Dynamics of telomeres and promyelocytic leukemia nuclear bodies in a telomerase-negative human cell line. Mol Biol Cell 20: 2070–2082. [DOI] [PMC free article] [PubMed] [Google Scholar]
- Jiao L, Liu X. 2015. Structural basis of histone H3K27 trimethylation by an active polycomb repressive complex 2. Science 350: aac4383. [DOI] [PMC free article] [PubMed] [Google Scholar]
- Kasinath V, Faini M, Poepsel S, Reif D, Feng XA, Stjepanovic G, Aebersold R, Nogales E. 2018. Structures of human PRC2 with its cofactors AEBP2 and JARID2. Science 359: 940–944. [DOI] [PMC free article] [PubMed] [Google Scholar]
- Kim H, Kang K, Kim J. 2009. AEBP2 as a potential targeting protein for Polycomb Repression Complex PRC2. Nucleic Acids Res 37: 2940–2950. [DOI] [PMC free article] [PubMed] [Google Scholar]
- Kloet SL, Makowski MM, Baymaz HI, van Voorthuijsen L, Karemaker ID, Santanach A, Jansen P, Di Croce L, Vermeulen M. 2016. The dynamic interactome and genomic targets of Polycomb complexes during stem-cell differentiation. Nat Struct Mol Biol 23: 682–690. [DOI] [PMC free article] [PubMed] [Google Scholar]
- Klymenko T, Papp B, Fischle W, Kocher T, Schelder M, Fritsch C, Wild B, Wilm M, Muller J. 2006. A Polycomb group protein complex with sequence-specific DNA-binding and selective methyl-lysine-binding activities. Genes Dev 20: 1110–1122. [DOI] [PMC free article] [PubMed] [Google Scholar]
- Knight SC, Xie L, Deng W, Guglielmi B, Witkowsky LB, Bosanac L, Zhang ET, El Beheiry M, Masson JB, Dahan M, et al. 2015. Dynamics of CRISPR-Cas9 genome interrogation in living cells. Science 350: 823–826. [DOI] [PubMed] [Google Scholar]
- Laird PW, Zijderveld A, Linders K, Rudnicki MA, Jaenisch R, Berns A. 1991. Simplified mammalian DNA isolation procedure. Nucleic Acids Res 19: 4293. [DOI] [PMC free article] [PubMed] [Google Scholar]
- Le Y, Miller JL, Sauer B. 1999. GFPcre fusion vectors with enhanced expression. Anal Biochem 270: 334–336. [DOI] [PubMed] [Google Scholar]
- Li X, Isono K, Yamada D, Endo TA, Endoh M, Shinga J, Mizutani-Koseki Y, Otte AP, Casanova M, Kitamura H, et al. 2011. Mammalian polycomb-like Pcl2/Mtf2 is a novel regulatory component of PRC2 that can differentially modulate polycomb activity both at the Hox gene cluster and at Cdkn2a genes. Mol Cell Biol 31: 351–364. [DOI] [PMC free article] [PubMed] [Google Scholar]
- Li H, Liefke R, Jiang J, Kurland JV, Tian W, Deng P, Zhang W, He Q, Patel DJ, Bulyk ML, et al. 2017. Polycomb-like proteins link the PRC2 complex to CpG islands. Nature 549: 287–291. [DOI] [PMC free article] [PubMed] [Google Scholar]
- Liu Z, Legant WR, Chen BC, Li L, Grimm JB, Lavis LD, Betzig E, Tjian R. 2014. 3D imaging of Sox2 enhancer clusters in embryonic stem cells. Elife 3: e04236. [DOI] [PMC free article] [PubMed] [Google Scholar]
- Long Y, Bolanos B, Gong L, Liu W, Goodrich KJ, Yang X, Chen S, Gooding AR, Maegley KA, Gajiwala KS, et al. 2017. Conserved RNA-binding specificity of polycomb repressive complex 2 is achieved by dispersed amino acid patches in EZH2. Elife 6: e31558. [DOI] [PMC free article] [PubMed] [Google Scholar]
- Margueron R, Reinberg D. 2011. The Polycomb complex PRC2 and its mark in life. Nature 469: 343–349. [DOI] [PMC free article] [PubMed] [Google Scholar]
- Margueron R, Justin N, Ohno K, Sharpe ML, Son J, Drury WJ III, Voigt P, Martin SR, Taylor WR, De Marco V, et al. 2009. Role of the polycomb protein EED in the propagation of repressive histone marks. Nature 461: 762–767. [DOI] [PMC free article] [PubMed] [Google Scholar]
- Martin C, Cao R, Zhang Y. 2006. Substrate preferences of the EZH2 histone methyltransferase complex. J Biol Chem 281: 8365–8370. [DOI] [PubMed] [Google Scholar]
- Muller J, Hart CM, Francis NJ, Vargas ML, Sengupta A, Wild B, Miller EL, O'Connor MB, Kingston RE, Simon JA. 2002. Histone methyltransferase activity of a Drosophila Polycomb group repressor complex. Cell 111: 197–208. [DOI] [PubMed] [Google Scholar]
- Nekrasov M, Klymenko T, Fraterman S, Papp B, Oktaba K, Kocher T, Cohen A, Stunnenberg HG, Wilm M, Muller J. 2007. Pcl–PRC2 is needed to generate high levels of H3–K27 trimethylation at Polycomb target genes. EMBO J 26: 4078–4088. [DOI] [PMC free article] [PubMed] [Google Scholar]
- Normanno D, Boudarene L, Dugast-Darzacq C, Chen J, Richter C, Proux F, Benichou O, Voituriez R, Darzacq X, Dahan M. 2015. Probing the target search of DNA-binding proteins in mammalian cells using TetR as model searcher. Nat Commun 6: 7357. [DOI] [PMC free article] [PubMed] [Google Scholar]
- O'Connell S, Wang L, Robert S, Jones CA, Saint R, Jones RS. 2001. Polycomblike PHD fingers mediate conserved interaction with enhancer of zeste protein. J Biol Chem 276: 43065–43073. [DOI] [PubMed] [Google Scholar]
- Oliviero G, Brien GL, Waston A, Streubel G, Jerman E, Andrews D, Doyle B, Munawar N, Wynne K, Crean J, et al. 2016. Dynamic protein interactions of the polycomb repressive complex 2 during differentiation of pluripotent cells. Mol Cell Proteomics 15: 3450–3460. [DOI] [PMC free article] [PubMed] [Google Scholar]
- Pasini D, Bracken AP, Jensen MR, Lazzerini Denchi E, Helin K. 2004. Suz12 is essential for mouse development and for EZH2 histone methyltransferase activity. EMBO J 23: 4061–4071. [DOI] [PMC free article] [PubMed] [Google Scholar]
- Peng JC, Valouev A, Swigut T, Zhang J, Zhao Y, Sidow A, Wysocka J. 2009. Jarid2/Jumonji coordinates control of PRC2 enzymatic activity and target gene occupancy in pluripotent cells. Cell 139: 1290–1302. [DOI] [PMC free article] [PubMed] [Google Scholar]
- Piunti A, Shilatifard A. 2016. Epigenetic balance of gene expression by Polycomb and COMPASS families. Science 352: aad9780. [DOI] [PubMed] [Google Scholar]
- Poepsel S, Kasinath V, Nogales E. 2018. Cryo-EM structures of PRC2 simultaneously engaged with two functionally distinct nucleosomes. Nat Struct Mol Biol 25: 154–162. [DOI] [PMC free article] [PubMed] [Google Scholar]
- Sanulli S, Justin N, Teissandier A, Ancelin K, Portoso M, Caron M, Michaud A, Lombard B, da Rocha ST, Offer J, et al. 2015. Jarid2 methylation via the PRC2 complex regulates H3K27me3 deposition during cell differentiation. Mol Cell 57: 769–783. [DOI] [PMC free article] [PubMed] [Google Scholar]
- Schmidt JC, Zaug AJ, Cech TR. 2016. Live cell imaging reveals the dynamics of telomerase recruitment to telomeres. Cell 166: 1188–1197.e9. [DOI] [PMC free article] [PubMed] [Google Scholar]
- Schmitges FW, Prusty AB, Faty M, Stutzer A, Lingaraju GM, Aiwazian J, Sack R, Hess D, Li L, Zhou S et al. 2011. Histone methylation by PRC2 is inhibited by active chromatin marks. Mol Cell 42: 330–341. [DOI] [PubMed] [Google Scholar]
- Serge A, Bertaux N, Rigneault H, Marguet D. 2008. Dynamic multiple-target tracing to probe spatiotemporal cartography of cell membranes. Nat Methods 5: 687–694. [DOI] [PubMed] [Google Scholar]
- Shen X, Kim W, Fujiwara Y, Simon MD, Liu Y, Mysliwiec MR, Yuan GC, Lee Y, Orkin SH. 2009. Jumonji modulates polycomb activity and self-renewal versus differentiation of stem cells. Cell 139: 1303–1314. [DOI] [PMC free article] [PubMed] [Google Scholar]
- Tokunaga M, Imamoto N, Sakata-Sogawa K. 2008. Highly inclined thin illumination enables clear single-molecule imaging in cells. Nat Methods 5: 159–161. [DOI] [PubMed] [Google Scholar]
- Walker E, Chang WY, Hunkapiller J, Cagney G, Garcha K, Torchia J, Krogan NJ, Reiter JF, Stanford WL. 2010. Polycomb-like 2 associates with PRC2 and regulates transcriptional networks during mouse embryonic stem cell self-renewal and differentiation. Cell Stem Cell 6: 153–166. [DOI] [PMC free article] [PubMed] [Google Scholar]
- Wang X, Paucek RD, Gooding AR, Brown ZZ, Ge EJ, Muir TW, Cech TR. 2017. Molecular analysis of PRC2 recruitment to DNA in chromatin and its inhibition by RNA. Nat Struct Mol Biol 24: 1028–1038. [DOI] [PMC free article] [PubMed] [Google Scholar]
- Weth O, Paprotka C, Gunther K, Schulte A, Baierl M, Leers J, Galjart N, Renkawitz R. 2014. CTCF induces histone variant incorporation, erases the H3K27me3 histone mark and opens chromatin. Nucleic Acids Res 42: 11941–11951. [DOI] [PMC free article] [PubMed] [Google Scholar]
- Xi L, Schmidt JC, Zaug AJ, Ascarrunz DR, Cech TR. 2015. A novel two-step genome editing strategy with CRISPR-Cas9 provides new insights into telomerase action and TERT gene expression. Genome Biol 16: 231. [DOI] [PMC free article] [PubMed] [Google Scholar]
- Xiao J, Jin R, Yu X, Shen M, Wagner JD, Pai A, Song C, Zhuang M, Klasfeld S, He C, et al. 2017. Cis and trans determinants of epigenetic silencing by Polycomb repressive complex 2 in Arabidopsis. Nat Genet 49: 1546–1552. [DOI] [PubMed] [Google Scholar]
- Zhen CY, Tatavosian R, Huynh TN, Duc HN, Das R, Kokotovic M, Grimm JB, Lavis LD, Lee J, Mejia FJ, et al. 2016. Live-cell single-molecule tracking reveals co-recognition of H3K27me3 and DNA targets polycomb Cbx7-PRC1 to chromatin. Elife 5: e17667. [DOI] [PMC free article] [PubMed] [Google Scholar]
Associated Data
This section collects any data citations, data availability statements, or supplementary materials included in this article.