

Abstract
2D and 3D scatter dose display options are evaluated for usefulness and ease of interpretation for real-time feedback to staff to facilitate changes in individual positioning for dose reduction purposes, as well as improving staff consciousness of radiation presence. Room-sized scatter dose 3D matrices are obtained utilizing Monte Carlo simulations in EGSnrc. These distributions are superimposed on either a ceiling-view 2D graphic of the patient and table for reference or a 3D augmented reality (AR) display featuring a real-time video feed of the interventional room. A slice of the scatter dose matrix, at a selectable distance above the floor, is color-coded and superimposed on the computer graphic or AR display. The 3D display obtains depth information from a ceiling mounted Microsoft Kinect camera, which is equipped with a 1080p visual camera, as well as an IR emitter/receiver to generate a depth map of the interventional suite and persons within it. The 3D depth information allows parts of objects above the 2D dose map to pass through the map without being colorized by it so the height perspective of the dose map can be maintained. The 2D and 3D displays incorporate network information from the imaging system to scale the scatter dose with exposure factors and adjust rotation of the distribution to match the gantry. Demonstration images were displayed to neurosurgery interventional staff and survey responses were collected. Results from the survey indicated that scatter distribution displays would be desirable and helpful in managing staff dose.
Keywords: Scatter dose, display, staff dose, fluoroscopy, intervention, augmented reality
1. INTRODUCTION
The goal for dose management continues to be ALARA: as low as reasonably achievable. Of particular concern are interventional staff who are exposed to scatter radiation of varying intensity on a regular basis. Whitby et al noted that across 100 interventional procedures staff’s hands on average received 0.04 to 1.25 mSv per procedure and their legs received 0.19 to 2.61 mSv.1 The IAEA also posted a technical note that correlates patient skin dose to staff eye dose. They found that 1 Gy*cm2 to the patient resulted in 10 μSv to the staff’s eyes2. One method for reducing their exposure is awareness; specifically, real-time knowledge regarding the output of the beam and a reminder of where not to stand in the suite.
Two categories of scatter dose distribution displays were created for this study: a 2D computer graphic of the patient and table from the ceiling point of view and a 3D augmented reality (AR) display featuring a real-time video feed of the interventional room. Both displays feature a color-coded scatter field superimposed. The scatter distributions are derived from EGSnrc Monte Carlo software calculations of scatter dose matrices that vary with the exposure parameters and exposure geometry. This exposure information can be obtained from the imaging system’s digital communication network in real time.
The goal of this study is to evaluate proposed scatter display designs for usefulness and ease of understanding. The purpose of providing real-time feedback to staff is to facilitate changes in individual behavior for dose reduction purposes, as well as improved staff consciousness of the presence of radiation.
2. METHODS
2.1 DTS
A dose tracking system (DTS) has been developed that displays a color-coded mapping of the patient’s skin dose during fluoroscopically-guided interventional procedures.3 The dose is calculated by determining the intersection of the x-ray beam with a graphic representation of the patient. All geometric parameters of the hardware components of the imaging system are determined in real time from the messages on a digital Control Area Network bus. The position of the patient graphic is placed relative to the imaging system table and can be manually adjusted using a software GUI. The proposed scatter display utilizes the beam output and tube geometric parameters extracted by the DTS and augments the patient skin dose graphic information with a second screen displaying staff scatter dose.
2.2 Microsoft Kinect
The Microsoft Kinect camera system features a 1080p color camera, an IR emitter/receiver, and a microphone array. This system was selected to provide a video feed of the interventional suite and a 3D model of the objects and staff within it. The Kinect camera system also features software development toolkits than can enable staff motion tracking. These features are critical for the development of the 2D display featuring staff tracking and shadowing of the scatter dose field due to attenuating objects. For both displays, staff tracking can enable real-time display of individual staff dose rate estimates. The Kinect camera system provides a depth map of objects in the room in real time as demonstrated in Figure 1.
Figure 1.
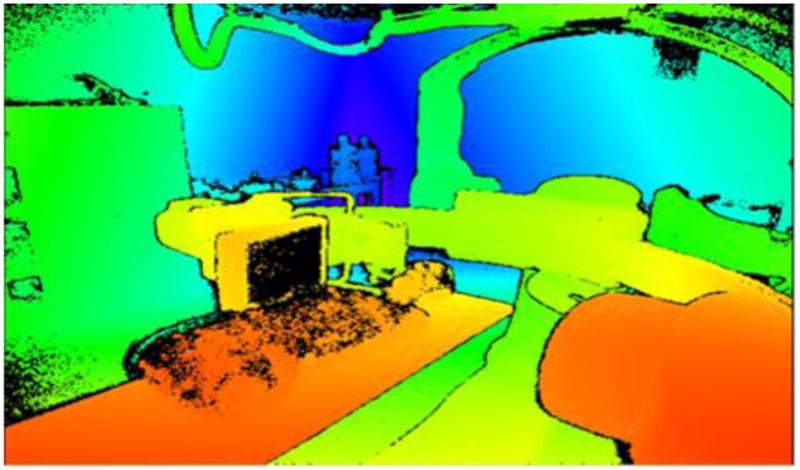
Infrared depth-map image from Kinect camera system with red representing the objects closest to the camera and purple the furthest. This information is utilized by the Kinect Fusion algorithm to generate a 3D STL object file of the room structure.
2.3 Display Algorithm
The 2D display of the room scatter dose distribution utilizes information from our Dose Tracking System (DTS) that was initially designed to provide a color-coded map of real-time skin dose on a patient graphic. Real-time information from this system on patient location in the beam, as well as gantry geometry and beam parameters allows a graphic to be constructed on a display of the room mimicking the scatter from the procedure conditions. An accurate color-coded representation of the scatter distribution at a given height above the floor can be superimposed on this graphic room display, with added distance markers for improved scale comprehension. While the interventionist may not be able to readily modify their position, the scatter dose display will make him/her aware of the changes in scatter intensity. Ancillary staff in the room might benefit more from a visual display reminding them where the areas of highest scatter are located in the dynamic environment of the procedure. The 2D display utilizes the patient graphic and table information from the DTS and overlays a pre-calculated slice of the scatter dose matrix, representing the scatter typically at one meter above the floor. Input from the imaging system network enables the appropriate selection of scatter dose slice for changing C-arm angle and beam parameters.
The scatter display algorithm currently utilizes MathWorks Matlab as a framework for development; however, the final scatter display algorithm will be rewritten in C++ for integration into the DTS system. The 2D algorithm can be divided into three parts: scatter distribution generation, staff tracking and shadowing, and assembly/output of frames.
The scatter distributions are calculated in EGSnrc, a Monte Carlo program, in which the beam of a Toshiba/Canon Infinix C-arm fluoroscopic suite has been modeled. A 16 cm PMMA head phantom was modeled in the software and each simulation used 2*109 photons. The values of scatter were calculated for a three meter cubed volume of air surrounding the phantom. Parameters such as field size, kVp, C-arm angle, and filtration were varied to generate a library of distributions4. Display distributions are interpolated to match the unique combinations of procedure beam parameters.
The 2D display is presented as a top-down view of the interventional suite, with a color-map of the scatter radiation values calculated one meter off of the floor, a common table height. The display algorithm received values for kVp, field size, and C-arm angle, among others, which are passed from the Infinix Control Area Network (CAN) bus to the DTS system. Scatter distribution generation is comprised of a series of evaluations to select the appropriate combination of distribution influencing factors based upon the input factors. The selected matrix of scatter values can then be converted into a color-map to indicate the relative intensity of scatter radiation in a particular location. In the absence of staff tracking, static distance indicators can be overlaid on the display and correlate to indicators on the floor of the suite.
As previously mentioned, the 2D display would benefit from Kinect-based staff tracking by receiving the 2D coordinates of staff members from the top-down oriented Kinect camera. With the staff member localized, a geometric indicator of staff location can be superimposed upon the scatter display. Multiplying the location matrix by the scatter matrix enables the presentation of an estimated real-time scatter dose rate display which is placed inside the staff location indicator. The dose rate indicated can be that at the selected height of the distribution map or it could be set to indicate the maximum dose rate for that individual at any other height (e.g., eye level or lower extremity).
Generation of staff shadows utilizes the Kinect camera to localize staff members and the geometric relations shown in Figure 2. X and Y coordinates from the Kinect camera indicate the center of a tracked staff member from the top-down view. From this point, the distance is calculated to the central “focal point” of the scatter distribution. The angle of a line connecting the two described points relative to the horizontal axis is also found at this time. The shadowing edges of the circular geometric staff indicator are defined by two points at the radius of the circle. The line between the two shadowing edges is perpendicular to the line connecting the center of the scatter distribution and the center of a tracked staff member. Lines are then drawn from the center of the scatter distribution, through the shadowing edges of the geometric staff indicator, and on to the edges of the total scatter display. The polygon described by the lines connecting the shadowing edges to each other, the lines connecting the shadowing edges to the boundaries of the display and the lines for the boundaries of the display is the final shadowed area. Matlab’s inpolygon function is used for simplicity in determining which values of the scatter distribution fall within the shadowed area.5 Those values within the polygon are set to zero, creating an area of low scatter behind a staff member; alternatively, the values can be scaled by a fractional value of the unattenuated scatter, although this fraction is nearly zero for staff wearing an apron.
Figure 2.
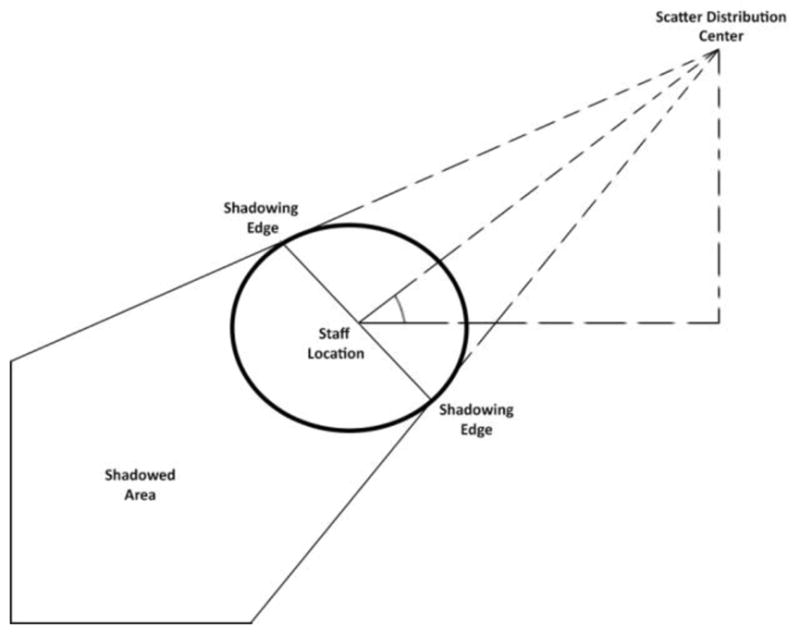
Diagram of staff shadow calculation key features. Video 3 displays the impact of the diagram above.
To evaluate initial impressions of the potential usefulness of a proposed scatter display system features, demonstration images which depicted what the final system would most likely look like were generated. The images were displayed to a panel of practicing neuro-interventionists. The two display modes (2D and 3D AR) were explained and a questionnaire was distributed to determine the utility of the proposed displays. The content of the questionnaire was focused on answering three questions: is there interest in a scatter display system, would staff prefer a 2D or 3D AR display, and would staff prefer that their tracked location was displayed? Feedback acquired will be used to guide feature selection for the final demonstration scatter display, at which time a secondary questionnaire will be given.
3. RESULTS AND DISCUSSION
The 2D display is assembled by selecting the appropriately angled C-arm background template based upon the CAN bus data and the final frame is assembled by overlaying the modified scatter distribution with reduced opacity, followed by adding the geometric staff indicator(s). The frame is then pushed to the display. Total time to generate frames on an Intel I3-6100 processor is 0.297 seconds on average. Previous works indicate that GPU processing could reduce the calculation time required to produce frames.6
Videos demonstrating various aspects that can be represented in the 2D display were created and are shown in Videos 1, 2, 3, and 4.
Video 1.
Scatter display showing variation of the distribution with rotation of the C-Arm gantry. A geometric staff indicator shown as the oval object displays the dose rate at that location. Red indicates higher dose; a color bar indicating correlation to scatter intensity could be added to the room display. http://dx.doi.org/10.1117/12.2294575.1
Video 2.
Scatter display demonstrating the dose distribution variation with kVp and field size. A geometric staff indicator displays dose rate at that location. The C-arm gantry is positioned at 45 degrees. http://dx.doi.org/10.1117/12.2294575.2
Video 3.
Scatter display showing the change in dose rate as the staff member moves closer and away from the beam. The dose rate at the location is indicated in the oval object and shadowing by the object is included. http://dx.doi.org/10.1117/12.2294575.3
Video 4.
Scatter display recreating 20 seconds from a clinical interventional procedure using the geometric and beam parameter log file recorded by the DTS. http://dx.doi.org/10.1117/12.2294575.4
The 3D AR display builds upon the 2D display algorithm. The scatter distribution selection process, staff tracking and shadowing are all reused. For the 3D display, the Kinect camera system provides the base video feed and 3D model of the structures in the room: a requirement for accurately placing the scatter dose slice and displaying appropriate phasing behavior as objects pass through the slice. The Kinect Fusion algorithm creates an STL object of the structures within its view by emitting an IR beam matrix and measuring the time for the beams to return, with a maximum distance of roughly four meters.7 This virtual scene’s objects can pass through each other (phase) and the portion of the scatter slice 3D object that intersects an additional object is removed. This implementation for the dose slice and other objects creates a visual effect similar to that of a person standing in a waist-high pool of water. Demonstration images of the 3D display were prepared for this study featuring images with the C-arm in the zero-degree position, the ninety-degree position, and the zero-degree position with a staff member in the image (Figs. 3A–C). For these three images, the selected scatter dose slice presents the distribution’s dependence upon C-arm gantry angle. Without the phasing property mentioned above, the dose slice would be overlaid on the video feed without any 3D effect as seen in Figure 3D, losing the appearance of depth in the final video output, which is composed of the virtual scene’s objects and the 1080p color camera feed.
Figure 3.

3D (AR) scatter demo image featuring an anatomical phantom, with the C-arm in (A) the zero-degree position, (B) the ninety-degree position, (C) the zero-degree position with a staff member in the image and (D) Fig. 3C repeated without phasing implemented. Each scatter dose slice features the appropriate C-arm dependent distribution. Red represents the highest dose rate and blue the lowest.
The accuracy of a Kinect Fusion reconstruction diminishes at distances beyond four meters from the camera, and thus the camera’s location is of concern.7 Kinect camera positioning was tested by placing the camera in different locations above the table along its longitudinal axis and running the Kinect Fusion algorithm. A successful position was one that had a view of the entire patient (an SK150 head and torso phantom) and a staff member near the patient’s foot, while the C-arm was rotated to various angles. Mounting the camera near/on the ceiling of the suite, above the patient foot area, would provide a reconstruction with detailed C-arm, patient, and near-table staff definition, and sufficient floor detail to measure height. Post processing with human intervention is currently required to insure smoothness of the 3D object phasing behavior for this demonstration; this step that will be replaced with software should this display mode be chosen as the preferred approach. Accuracy of the distribution display is dependent upon appropriate scaling of the distribution to match the suite dimensions, as well as validation of the EGSnrc calculations.4,8
For the questionnaire shown in Table 1, eight responses to each question were recorded on a scale of one to five, with one representing “strongly disagree” with the question or statement and five representing “strongly agree.” Respondents varied in neuro-interventional experience, from resident level to senior staff members. Results from the survey shown in Table 1 indicate that a real-time scatter display would be important to the interventionists and they believe it could facilitate ALARA for staff. The 2D display featuring distance indicators received positive feedback. The interventionists had a slight preference for the 3D display, but their comments indicated that additional dose distribution display elements would be preferential (such as multiple slices or a transparent iso-dose overlay). The questionnaire also indicated that staff position tracking and displaying individual staff dose rate estimates were desired. Outliers such as the one response of “Disagree” for question eight are most likely due to differences in personal preference, the perception that the risk of additional information may be a distraction during a procedure or the opinion that the color-coding is sufficient without a need for numerical values. A secondary questionnaire will be required, after a complete system is available for demonstration, to readdress any areas of concern for the staff members who will utilize this display.
Table 1.
Results from a questionnaire given to practicing neuro-interventionalists regarding staff dose display options.
| Number of Responses for Each Choice | ||||||
|---|---|---|---|---|---|---|
|
| ||||||
| Weight | 1 | 2 | 3 | 4 | 5 | |
|
| ||||||
| Strongly disagree | Disagree | Neither agree nor disagree | Agree | Strongly agree | Weighted Average | |
| 1. A real-time scatter display would be helpful for procedure room staff to reduce their dose. | 5 | 3 | 4.38 | |||
| 2. Real-time feedback of room scatter is important to me. | 4 | 4 | 4.50 | |||
| 3. The 2D color-coded graphic display of scatter distribution would provide useful information. | 5 | 3 | 4.38 | |||
| 4. Distance reference indicators are needed on the 2D graphic. | 2 | 4 | 2 | 4.00 | ||
| 5. The augmented reality display would be preferred over a 2D graphic display. | 1 | 3 | 2 | 2 | 3.63 | |
| 6. Showing the scatter distribution for a single horizontal plane is sufficient. | 2 | 1 | 4 | 2.29 | ||
| 7. Tracking of individual staff on the 2D graphic display is desirable. | 6 | 2 | 4.25 | |||
| 8. Numerically showing the dose rates of individual staff is important. | 1 | 5 | 2 | 4.00 | ||
Overall, the results of the questionnaire indicate the desire by interventionists for a scatter dose display. A 2D scatter dose display software package can be designed and implemented, incorporating the feedback from this study regarding staff preferences and feasibility. The 3D AR display system will require the Kinect camera, or equivalent, hardware installation. The addition of dose display elements, such as supplementary dose slices, will be matched to staff preferences and automation of the phasing-behavior smoothing will ensure real-time operation.
4. CONCLUSIONS
A scatter dose distribution display available during fluoroscopic interventions has the potential to provide staff members with valuable education and real-time awareness of changing scatter conditions within the procedure room and meet the ALARA principle for reducing risk. Evaluations of the proposed displays, with consideration of the feedback gathered in this study, can facilitate the creation of a scatter dose display that is useful and easy to comprehend.
When combined with existing DTS hardware, a scatter dose display such as the one proposed in this study can provide valuable feedback to staff members with minimal added cost. Added hardware should be limited to a depth camera, such as the Kinect. The results from the initial questionnaire indicate an interest among staff members in real-time information regarding the scatter radiation they are exposed to on regular basis. This study demonstrates the feasibility and methodology for creating such a system.
Acknowledgments
This work was partially supported by Toshiba (Canon) Medical Systems Corp. The resources of the Center for Computational Research of the University at Buffalo were used for the Monte-Carlo calculations.
Footnotes
Disclosure The authors receive research support from Toshiba (Canon) Medical Systems. The dose tracking system (DTS) software is licensed to Toshiba (Canon) Medical Systems by the Office of Science, Technology Transfer and Economic Outreach of the University at Buffalo.
References
- 1.Whitby M, Martin CJ. The British Journal of Radiology. U.S. National Library of Medicine; May, 2003. Radiation Doses to the Legs of Radiologists Performing Interventional Procedures: Are They a Cause for Concern? www.ncbi.nlm.nih.gov/pubmed/12763947. [DOI] [PubMed] [Google Scholar]
- 2.Radiation Protection of Medical Staff from Cataract. IAEA; Jul 28, 2017. www.iaea.org/resources/rpop/health-professionals/radiology/cataract/staff. [Google Scholar]
- 3.Bednarek Daniel R, et al. Verification of the Performance Accuracy of a Real-Time Skin-Dose Tracking System for Interventional Fluoroscopic Procedures. Proceedings of SPIE--the International Society for Optical Engineering; 13 Feb. 2011; U.S National Library of Medicine; www.ncbi.nlm.nih.gov/pmc/articles/PMC3127243. [DOI] [PMC free article] [PubMed] [Google Scholar]
- 4.Guo Chao, et al. Developing a Database of 3D Scattered Radiation Distributions for a c-Arm Fluoroscope as a Function of Exposure Parameters and Phantom. Conference Detail for Physics of Medical Imaging, Paper 10573-223; Feb. 2018; spie.org/MI/conferencedetails/physics-of-medical-imaging. [DOI] [PMC free article] [PubMed] [Google Scholar]
- 5.Points Located inside or on Edge of Polygonal Region. MATLAB Inpolygon, MathWorks; 2006. Inpolygon - Matlab. www.mathworks.com/help/matlab/ref/inpolygon.html?requestedDomain=www.mathworks.com. [Google Scholar]
- 6.Rana Vijay, et al. Use of a Graphics Processing Unit (GPU) to Facilitate Real-Time 3D Graphic Presentation of the Patient Skin-Dose Distribution during Fluoroscopic Interventional Procedures. Proceedings of SPIE, U.S. National Library of Medicine; 23 Feb. 2012; www.ncbi.nlm.nih.gov/pmc/articles/PMC3766975/ [DOI] [PMC free article] [PubMed] [Google Scholar]
- 7.Kinect Hardware Key Features and Benefits. Kinect Hardware, Microsoft. 2013 developer.microsoft.com/en-us/windows/kinect/hardware.
- 8.Chao Guo, et al. Scattered Radiation Dose-Rate Distribution Around An Interventional C-Arm Fluoroscope and Variation with Exposure Parameters. AAPM 59th Annual Meeting & Exhibition - Meeting Program - Session Information; July 2017; AAPM; 2017. www.aapm.org/meetings/2017AM/PRAbs.asp?mid=127. [Google Scholar]