Abstract
Despite with accumulating evidences on the anti-diabetic effects of mulberry branch (MB), the major active component for the activity has not been known. Oral administration of MB ethanol (EtOH) extracts [0.5 or 1 g/kg body weight (BW)] once a day for 22 days to streptozotocin-induced diabetic ICR mouse significantly reduced fasting blood and plasma glucose level in a dose dependent manner compared to those of the diabetic control. Administration of oxyresveratrol [ORT, 0.6 g/kg BW], a major compound of MB EtOH extracts, to diabetic ICR mouse also significantly reduced fasting plasma glucose level. Further, ORT increased hepatic glucose transporter 2 transcription and glycogen content. Plasma insulin concentration and intestinal disaccharidase activity were not different between diabetic control and ORT groups. This suggests that ORT reduced plasma glucose by stimulating hepatic glucose uptake and glycogen storage. MB EtOH extracts and ORT could be potential adjunct therapies for diabetes management.
Keywords: Diabetes, Mulberry branch, Oxyresveratrol, Streptozotocin, Mouse
Introduction
The prevalence of diabetes mellitus (DM) is steadily increasing worldwide. In 2013, 382 million was diagnosed with DM and this is expected to rise to 592 million in 2035 [1]. The pathophysiology of type 1 DM (T1DM) is characterized by absolute defect of insulin secretion caused by pancreatic injury and type 2 DM (T2DM) is characterized by insulin resistance. Chronic DM can develop into serious complications such as micro- and macro-vascular complications, notably retinopathy, neuropathy and nephropathy as well as atherosclerosis and hypertension in the latter [2]. Thus, the primary aim of diabetes management is effective control of blood glucose to achieve near normal levels. Patients with T1DM require insulin therapy but occasionally oral hypoglycemic agents are used as adjunct therapy. Currently, metformin (Met) is the only oral hypoglycemic agent approved by the Food and Drug Administration in the United States for juvenile T1DM [3]. However, the efficacy of combined treatment of Met and insulin is not clear. The management of T2DM commonly consists of use of biguanides such as metformin, sulfonylureas, α-glucosidase inhibitors, and thiazolidinediones, in addition to diet control and exercise [4]. However, the currently available drugs have been reported to exert several side effects such as hypoglycemia, loss of insulin secretion capacity, gastric upset, renal and hepatic impairment [4]. In addition, some drugs that are associated with severe hepatotoxicity or cardiovascular side effects have been prohibited for use. Therefore, in recent years, plant-derived phytochemicals with limited side effects have been extensively studied for the treatment of DM.
The fruits, leaves, branches, and root barks of mulberry (Morus alba L.) have long been used for the treatment of diabetes in traditional Korean and Chinese medicine [5]. Recent studies have identified its anti-hyperglycemic mechanism and major active components in the sericultural products [6–10]. In particular, mulberry branch (MB) was recently found to exhibit significant hypoglycemic activities in vitro and in vivo [8, 9]. Ye et al. [8] reported that the aqueous extracts of MB possess potent intestinal α-glucosidase inhibitory activity and significantly reduced fasting blood glucose level in alloxan-induced diabetic rats and mice [8]. The effect was comparable to that of acarbose, an anti-diabetic drug that acts as an α-glucosidase inhibitor. Our recent study also showed that MB exerts stronger α-glucosidase inhibitory effect than other parts of the mulberry tree [11]. However, the major active component for anti-diabetic activity of the MB extracts has not been known. Guo et al. [9] reported that polysaccharides isolated from MB reduced blood glucose level in streptozotocin (STZ)-induced diabetic mice. Inflammatory response and oxidative stress in pancreatic tissues were inhibited whereas body weight and insulin levels were restored after polysaccharide treatment. These effects were comparable to those of the metformin.
We recently isolated and identified that MB ethanol (EtOH) extracts contains oxyresveratrol(ORT, trans-2′,3,4′,5-tetrahydroxystilbene), resveratrol, and moracin [12]. Among these, oxyresveratrol 3′,4-O-β-d-diglucoside (mulberroside A, MSA) and its aglycone (ORT) are the major functional constituents of MB and they are widely known for their anti-inflammatory [13], anti-melanogenic [14], and antioxidant activities [15]. However, the anti-diabetic action of ORT in STZ-induced diabetic mice has not been studied in vivo.
In this study, we therefore investigated the anti-diabetic effect of MB EtOH extracts and its major active component, ORT, in STZ-induced diabetic mice.
Materials and methods
Plant materials and chemicals
The branch of “Chongilppong” cultivar including M. alba L. were collected on early March in the Yeongcheon Province, Koreaand identified by Gyoo-Byung Sung, National Institute of Agricultural Sciences, Jeonbuk, Korea. A voucher specimen has been deposited in the herbarium of the Institute of Natural Sciences of Catholic University of Daegu. All solvents for HPLC analysis were of Merck HPLC grade (Darmstadt, Germany). All other reagents used in this study were of analytical grade.
Preparation of ethanol extracts of MB and oxyresveratrol
Dried MB (2 kg) were cut into small pieces and refluxed twice in 60% EtOH (4 L) for 2 h. The EtOH solution was cooled, filtered, and evaporated under reduced pressure at 50 °C. The crude EtOH extract was redissolved in the same EtOH solution and left overnight at room temperature. The upper layer was evaporated in vacuo to obtain EtOH extract of MB (yield: 7.4 ± 0.3%). ORT and MSA were isolated from the ethanolic extract of mulberry (M. alba L.) twigs by a series of separation procedures, including solvent fractionation, and silica-gel, ODS-A, and Sephadex LH-20 column chromatographies as previously reported [12].
Quantification of MSA and ORT by HPLC
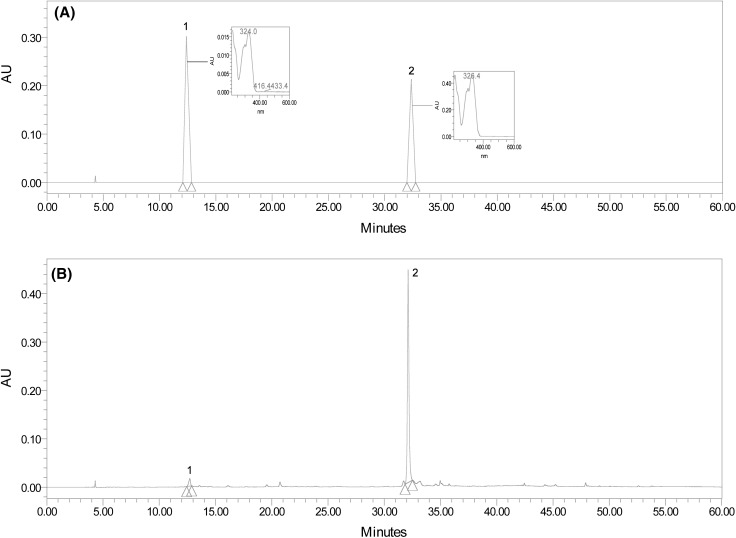
The EtOH extract (1.0 g) of MB was solubilized in EtOH (100 mL), followed by dilution and filtration by 0.45 μm membrane filter (Whatman, Maidstone, England), and finally injected into an analytical HPLC. HPLC was performed on a Waters e2690/5 HPLC system (Milford, MA, USA) equipped with 2998 photodiode array detector at 320 nm and autosampler. HPLC analysis was carried out using a YMC-Pack Pro C18 column (46 mm i.d. × 250 mm, YMC Inc., USA) with a Guard-Pak C18 precolumn insert. The separation was conducted using a linear gradient of two solvent systems; solvent A, 0.05% H3PO4 in H2O; solvent B, CH3CN at a flow rate of 0.8 mL/min. The gradient elution program was performed as follows: initial 5 min run of 10% B (v/v), followed by a 45 min linear gradient to 80% B, and holding for 5 min. The injection volume was 10 μL. MSA and ORT were identified by a comparison of their retention time with those of the two standard compounds isolated previously [12]. Linear correlation coefficients were superior to 0.995 for two compounds. Levels of two compounds were determined by calibration curves of the two standards (MSA; y = 1.5083x + 1.4372, ORT; y = 5.7642x − 1.5011) and expressed as mg per 100 g of dried weight of MB. Recovery rates of two compounds were above 97%. The typical HPLC chromatograms of the two standard compounds and of the EtOH extract of MB are shown in Fig. 1.
Fig. 1.
HPLC chromatograms of two standards, mulberroside A (MSA) and oxyresveratrol (ORT) (A), and the EtOH extract of mulberry branch (MB) (B). 1: Mulberroside A (MSA), 2: oxyresveratrol (ORT)
Animals
Six-week-old male ICR mice were purchased from the Koatech bio (Busan, Korea). The animals were kept under controlled conditions (humidity of 50 ± 10%, 12 h light/dark cycle, and at 25 ± 2 °C). The mice received food and water ad libitum during the experimental period. Their body weight was measured twice a week throughout the entire experimental period. Animal experiments were performed in compliance with the institutional guidelines and the protocols were approved by the Animal Care and Use Committee at Catholic University of Daegu (IACUC-2015-022, Geongsan, Korea).
Experimental procedure
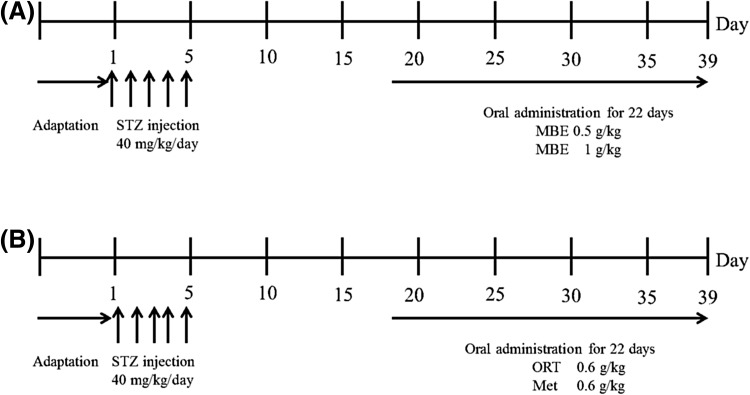
For experiment I, mice were randomly divided into four groups: normal control (NC, n = 10), diabetes control (DC, n = 10), diabetes + MB EtOH extracts 0.5 g/kg BW (MBE0.5, n = 10), and diabetes + MB EtOH extracts 1 g/kg BW (MBE1, n = 10) (Fig. 2). For experiment II, mice were divided into four groups: NC (n = 7), DC (n = 7), DORT (diabetes + ORT, n = 10), and DMet (diabetes + metformin, n = 10). To induce diabetes, STZ (Sigma chemical, St. Louis, Missouri, USA) was dissolved in 0.1 M of citrate buffer (pH 4.5) and intraperitoneallyinjected (40 mg/kg/day) to mice for five consecutive days. After we evaluate that blood glucose concentration from the tail vein is reached > 300 mg/dL by STZ injection, animals were orally administered with MB EtOH extracts (0.5 or 1 g/kg BW) once a day for 22 consecutive days in experiment I. In experiment II, mice were orally administered with ORT (0.6 g/kg BW) or Met (0.6 g/kg BW) for 22 consecutive days. Mice in NC and DC groups were administered with vehicle.
Fig. 2.
Schematic representation of the experiments in T1DM animal model. (A) Experiment I; after 1 week of adaptation, male ICR mice were injected 5 times with STZ (40 mg/kg/day). Experimental supplement was orally administrated to mice in each group once a day for 22 days after the last injection of STZ. STZ, streptozotocin; MBE, mulberry branch EtOH extract, (B) experiment II; After 1 week of adaptation, male ICR mice were injected 5 times with STZ (40 mg/kg/day). Experimental supplement was orally administrated to mice in each group once a day for 22 days after the last injection of STZ. STZ streptozotocin, ORT oxyresveratrol, Met metformin
Tissue preparations
When the experiments I and II were completed, mice were fasted for 12 h, anaesthetized with CO2 and sacrificed. Blood was taken from the inferior vena cava in a heparin-coated tube and centrifuged at 3000g for 15 min at 4 °C to separate the plasma. After the blood was collected, the liver was promptly removed, rinsed, weighed, frozen in liquid nitrogen, and stored at − 70 °C until analysis. The small intestine (the section 10 cm away from the pylorus and just before the appendix) was immediately removed and gently flushed with ice-cold phosphate buffer saline (PBS). It was divided into three parts (proximal, middle, and distal) and was used to prepare the crude enzyme solution for determination of disaccharidase activity.
Plasma and whole blood biomarkers
The concentration of fasting blood glucose was measured with whole blood obtained from the tail vein after 12 h of fasting using a glucose analyzer, blood glucose monitoring kit (Arkray, Japan). The plasma glucose and insulin levels were analyzed with commercially available kits: glucose (Asan, Seoul, Korea) and mouse ultrasensitive insulin ELISA Kit (Alpco, Salem, NH, USA).
Disaccharidase activities
Intestinal disaccharidase activities were determined by measuring the amount of glucose released from lactose, sucrose, and maltose [16]. Briefly, individual intestinal parts were opened and flushed with ice-cold PBS, and the mucosa was collected by scraping with a glass slide and homogenized in 4 volumes of distilled water. After centrifugation at 7000g for 10 min at 4 °C, the homogenate supernatant was diluted onefold, eightfold, and tenfold to measure the activity of lactase, sucrase, and maltase, respectively. An equal volume of 0.1 M sodium maleate buffer (pH 6.0) containing 56 mM disaccharide solution was added to each diluents and incubated for 1 h at 37 °C. The mixture was heated in boiling water for 2 min and cooled, and a glucose oxidase reagent containing o-dianisidine as a chromogen was added. After 1 h of incubation at 37 °C, the absorbance was measured at 420 nm. Disaccharidase activity was expressed as U/mg protein.
Measurement of hepatic glycogen content
The hepatic glycogen content was determined according to the method of Seifter and Dayton [17] with modification. Briefly, the liver tissue was homogenized in 6 volumes of 30% (w/v) KOH solution and dissolved at 100 °C for 30 min. Three volumes of 95% EtOH were added and O/N was incubated at 4 °C. Next day, it was centrifuged at 5000g for 15 min at 4 °C and the pellet was collected and dissolved in distilled water. The dissolved pellet was treated with an anthrone (Kanto, Osaka, Japan) reagent (0.02 g anthrone/L of 95% (v/v) H2SO4) and glycogen content was determined by measuring the absorbance at 620 nm.
RNA isolation and mRNA expression analysis
Total RNA was isolated from the liver. RNA was reversibly transcribed with reverse transcriptase (TaKaRa, Dalian, China) and oligo-(dT) primer (Macrogen, Seoul, Korea). The mRNA expression of glyceraldehyde-3-phosphate dehydrogenase (GAPDH) (forward: 5′-GAGGGGCCATCCACAGTCTTC-3′, reverse: 5′-CATCACCATCTTCCAGGAGCG-3′), and glucose transporter 2 (GLUT2, forward: 5′-GCTGTCTCTGTGCTGCTTGT-3′, reverse: 5′-CGTAACTCATCCAGG CGAAT-3′) were determined by quantitative real time polymerase chain reaction (qRT-PCR). The reaction was carried out in 10 μL of SYBR Green Master Mix (Invitrogen, Eugene, OR, USA) according to the manufacturer’s instructions. Relative ratios were calculated based on the 2−ΔΔCt method [18]. Relative quantification is based on the expression levels of GLUT2 (target gene) versus GAPDH (reference gene). Expression of GLUT2 mRNA was normalized by GAPDH and is presented as GLUT2/GAPDH ratio. PCR was monitored using the Mini Opticon Real Time PCR System (Bio-Rad, Philadelphia, PA).
Statistical analysis
All statistical analyses were performed using the SPSS program (ver. 19, IBM Korea, Seoul, Korea). The data were analyzed by one-way analysis of variance (ANOVA) and presented as mean ± standard error mean (SEM). The differences were considered significant at p < 0.05.
Results and discussion
Levels of MSA and ORT in mulberry branches
Prior to selecting MB, the content of ORT and MSA in mulberry twigs (small and thin branches, < 1.0 cm in diameter) and stems (big and thick branches, 1.0–3.0 cm in diameter) were analyzed by HPLC. Levels of MSA of mulberry stems and twigs were 2.08 and 2.21%, respectively, while those of ORT of mulberry stems and twigs were 11.95 and 3.83%, respectively (Table 1). Thus, ORT level of mulberry stems was higher than that of mulberry twigs, whereas MSA level of mulberry twigs was higher than that of mulberry stems. The EtOH extracts of MB including mulberry twigs and stems were herein used as a sample.
Table 1.
Contents of ORT and MSA of mulberry branches including twigs and stems
| Part of mulberry branch | Content (%, EtOH ext.) | |
|---|---|---|
| MSA | ORT | |
| Stem | 2.08 ± 0.23 | 11.95 ± 1.12 |
| Twig | 2.21 ± 0.29 | 3.83 ± 0.31 |
| Average | 2.14 ± 0.26 | 7.89 ± 0.71 |
Data represent mean ± SD of triplicate determinations
MB decreased the fasting blood and plasma glucose in diabetic mice
Hypoglycemic effects of mulberry tree-derived products including mulberry fruits [6], leaves [7], and root barks [10] are well documented. However, limited studies have reported the hypoglycemic activity of MB in diabetic animal models.
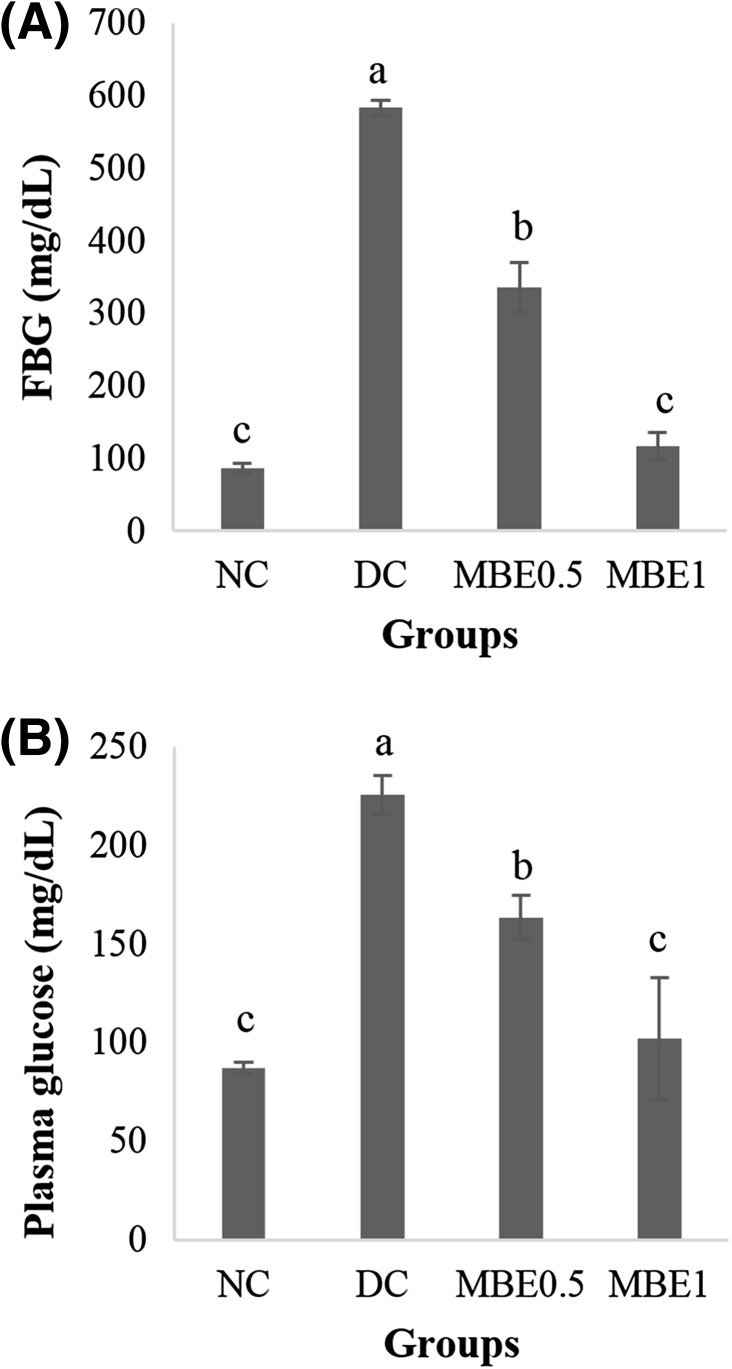
Ten days after the oral administration of MB, fasting blood glucose (FBG) was measured. FBG level in mice of the DC group (583.3 ± 10.57 mg/dL) was significantly higher than that in mice of the NC group (86.2 ± 6.84 mg/dL). However, FBG level was significantly lower in the MBE0.5 group (42%) and MBE1 group (80%) than in the DC group [Fig. 3(A)]. The concentrations of plasma glucose were measured after animals were euthanized. The plasma glucose concentrations of NC and DC mice were 87.0 ± 3.14 and 225.7 ± 9.71 mg/dL, respectively [Fig. 3(B)]. MBE0.5 and MBE1 groups showed significant decrease of plasma glucose level compared to the DC group in a dose dependent manner. Notably, MBE1 decreased the level of plasma glucose relative to that in the NC group.
Fig. 3.
Hypoglycemic effects of MB EtOH extracts. In STZ-induced diabetic ICR mouse, EtOH extracts of MB (0.5 or 1 g/kg BW) were orally administered for 22 days. After 10 days of oral administration, fasting blood glucose (FBG) (A) was measured from mouse tail vein. Concentration of plasma glucose (B) was measured after euthanization. Values are presented as the mean ± SE. Means with different letters are significantly different at p < 0.05 using Duncan’s multiple range test. NS, not significant; NC, normal control; DC, diabetes control; MBE0.5, mulberry branch EtOH extract 0.5 g/kg BW; MBE1, mulberry branch EtOH extract 1 g/kg BW
STZ is a naturally occurring chemical with selective toxicity to insulin-producing beta cells in the pancreatic islets in mammals and has long been used to induce T1DM in experimental animals. Since its structure is highly similar to glucose, it has been thought that STZ is transported to cells through glucose transport protein, GLUT2, and it has been shown that STZ was not recognized by other glucose transporters [19]. This finding explains its specificity to beta cells because these cells express relatively high levels of GLUT2 [20].
It has been reported that normal and alloxan-induced diabetic mice and rats treated with water extracts of MB at doses of 1.25, 2.5, and 5 g/kg BW demonstrated blood glucose concentration reduction in a dose-dependent manner [8]. Guo et al. [9] reported that oral administration of polysaccharides (PS) isolated from MB at a dose of 0.6 g/kg BW significantly reduced fasting blood glucose level in STZ-diabetic mice. Moreover, the severely damaged structures and number of islets of pancreatic beta cells were effectively restored following PS administration. In this study, we identified that MB EtOH extracts also possesses potent hypoglycemic activity.
Notably, the levels of FBG and plasma glucose were quite different in this experiment. FBG levels of diabetic animals were about 2 times higher than plasma glucose level. Although we do not know an exact reason, we speculate that the temporary mouse health or metabolic state caused this difference. The reported levels of FBG varied in the range of 150–500 mg/dL in STZ-induced diabetic mice within the same species [21, 22]. Nevertheless, MBE administration significantly reduced both FBG and plasma glucose in a dose dependent manner.
ORT improved hyperglycemia in diabetic mice
In the previous HPLC analysis of MB EtOH extract (Fig. 1), we found the extracts are consisted of major ORT (7.89 ± 0.71%) and minor its glycoside, MSA (2.14 ± 0.26%) (Fig. 1). We therefore hypothesized that ORT is the primary bioactive compound accounts for the anti-diabetic action of MB.
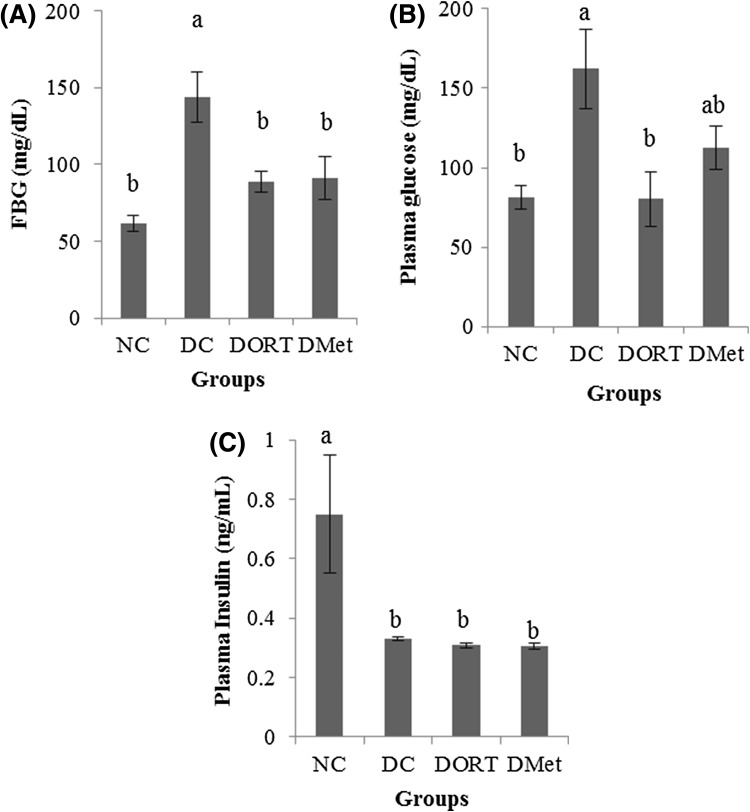
To test our hypothesis, we administered ORT at 0.6 g/kg BW to the diabetic animals for 19 days and compared to the blood glucose lowering effect of Met (0.6 g/kg BW). The dose of Met used in reported mouse studies are varied in the range of 0.25–1 g/kg BW. We chose 0.6 g/kg BW of ORT in our study as Guo et al. [9] compared the anti-diabetic effect of polysaccharides isolated from mulberry branches to that of Met at 0.6 g/kg BW on STZ-diabetic mice. FBG level was significantly lower in the DORT and DMet groups than in the DC group [Fig. 4(A)]. The plasma glucose levels of DORT group and DMet group were reduced to a similar level to that of NC group [Fig. 4(B)]. Similar to the result of MB, STZ injection significantly reduced plasma insulin level [Fig. 4(C)]. However, no significant difference was found between the diabetic groups. Again, these results suggest that the anti-diabetic effect of ORT was not dependent on insulin secretion.
Fig. 4.
Effect of ORT on the level of plasma glucose and insulin. In STZ-induced diabetic ICR mouse, ORT (0.6 g/kg BW) and Met (0.6 g/kg BW) were orally administered for 22 days. After 10 days of oral administration, fasting blood glucose (FBG) (A) was measured from mouse tail vein. Concentration of plasma glucose (B) and insulin (C) was measured after euthanization. Values are presented as the mean ± SE. Means with different letters are significantly different at p < 0.05 using Duncan’s multiple range test. NS not significant, NC normal control, DC diabetes control, DORT diabetes + oxyresveratrol; DMet diabetes + metformin
ORT, a hydroxylated form of resveratrol, is a natural hydroxystilbene found at high concentration in mulberry trees. Despite its good solubility in aqueous solution and high bioavailability (approximately 50%) [23], the biological activities of ORT have not been fully explored. ORT is known to inhibit tyrosinase [13], cyclooxygenase [24], and rat liver mitochondrial ATPase activities [25]. Further, ORT has been reported as a potent antioxidant and free radical scavenger in microglial cells [14]. Further, its anti-inflammatory [12] and anti-immune activities [26] have been demonstrated in vitro and in vivo. Mouihate et al. [26] reported that ORT-induced dampening of neuroimmune response was largely attributed to its inhibitory effect on tumor necrosis factor-alpha production. It has been reported that MSA from mulberry root barks exerted significant hypoglycemic effects on alloxan-induced diabetic mice [10]. MSA (50 mg/kg) markedly reduced plasma glucose level and the reduction was comparable to that of gliclazide. Taken together, although MSA was found to exhibit hypoglycemic activity in T2DM, the hypoglycemic effect of ORT has not yet been demonstrated in T1DM. To our knowledge, this is the first study to report the anti-diabetic activity of ORT and its ability as a potent blood glucose-lowering agent in STZ-induced T1DM diabetic animal model.
Intestinal disaccharidase activity of ORT in diabetic mice
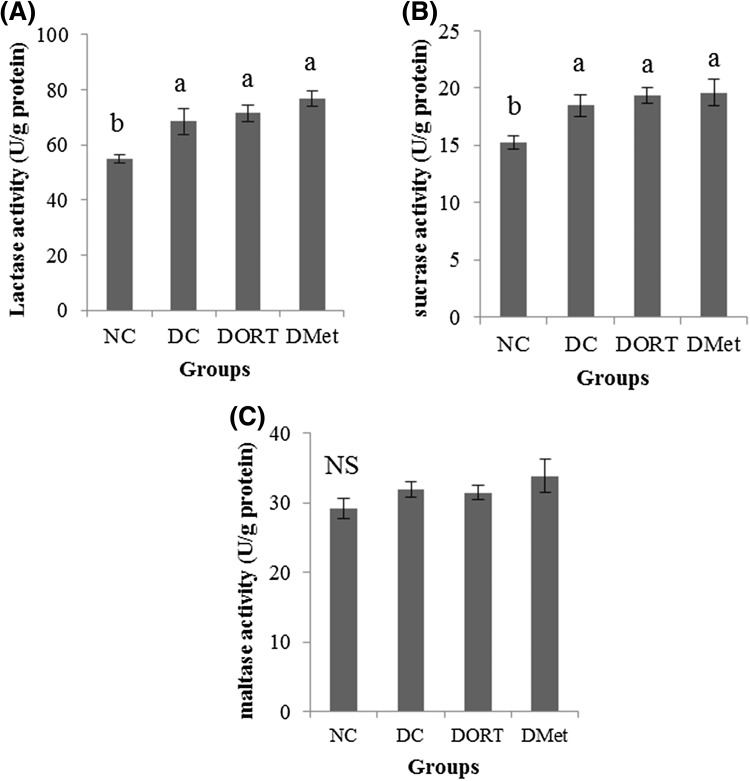
To investigate the mechanism of the anti-diabetic activity of ORT, the disaccharidase activity in the small intestine was first evaluated. Since disaccharidases were predominantly active at the proximal part of the small intestine and monosaccharides are absorbed at the proximal jejunum, the enzyme activities were measured at the proximal region. As shown in Fig. 5, the activities of lactase, sucrase, and maltase were higher in all diabetic mice than those in NC mice. However, no significant difference was found among the experimental groups.
Fig. 5.
Effect of ORT on intestinal disaccharidase activity. Lactase (A), sucrase (B), and maltase (C) activity were measured at the proximal region of the small intestine. Values are presented as the mean ± SE. Means with different letters are significantly different at p < 0.05 using Duncan’s multiple range test. NS not significant, NC normal control, DC diabetes control, DORT diabetes + oxyresveratrol, DMet diabetes + metformin
Carbohydrates are generally digested into oligosaccharides and disaccharides by digestive enzymes secreted into the small intestine. Disaccharides are then converted into monosaccharides by disaccharidase located on the brush border membranes in the small intestinal mucosa. Intestinal disaccharidases contain sucrase, maltase, and lactase. Sucrase and maltase are known as α-glucosidase since they can catalyze the liberation of α-glucose from the non-reducing end of the substrate. The increase in disaccharidase activity would directly cause postprandial hyperglycemia, which is considered to be a major risk factor for diabetes patients [27]. In fact, significant increase in disaccharidase activities has been observed in the small intestine of experimental animals [28] and diabetic patients. Therefore, limiting and/or delaying glucose absorption after meals is known to be beneficial in controlling plasma glucose concentration and diabetic complications [4].
The aqueous extracts of MB have been reported as a potent α-glucosidase inhibitor in the small intestine of rats and mice after screening hundreds of traditional Chinese medicines [8]. The hypoglycemic effect of high dose MB (2.5 and 5 g/kg body wt.) was comparable to that of acarbose, an α-glucosidase inhibitor. Although increased disaccharidase activity was promoted by diabetes induction, it was found that ORT and Met administration did not affect enzyme activities.
ORT increased GLUT2 transcription and glycogen contents in the liver
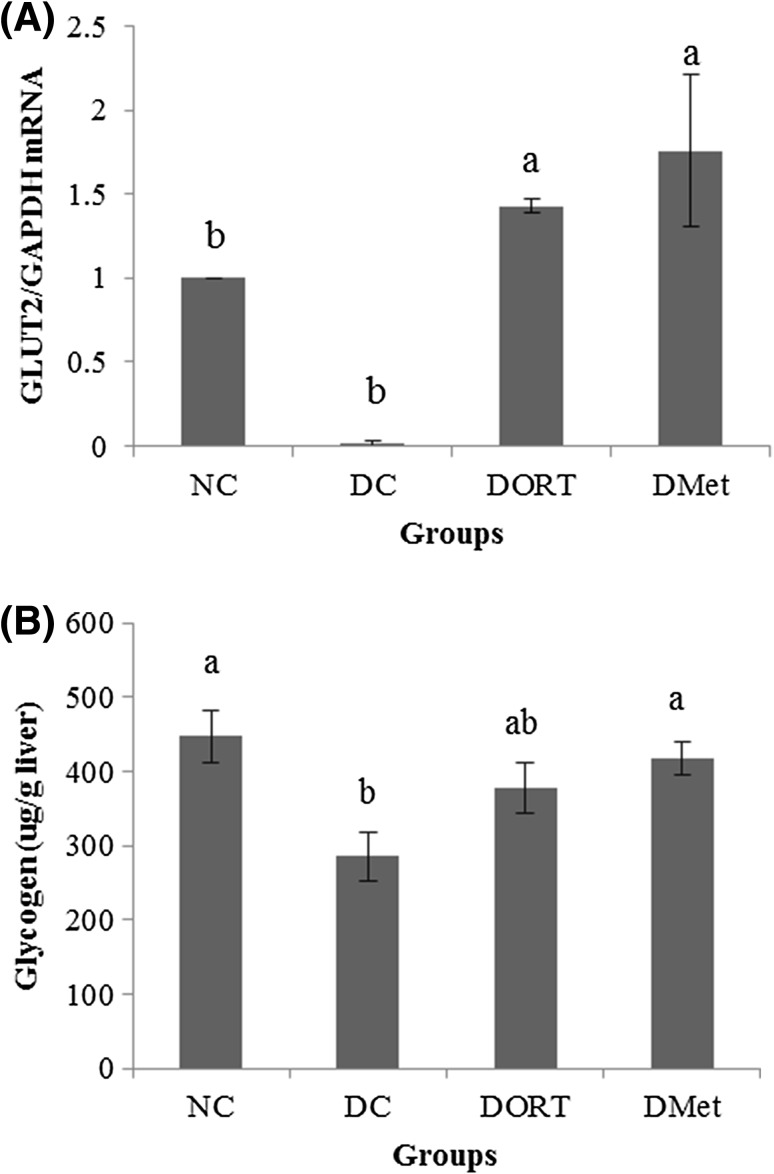
Since intestinal disaccharidase activity and level of plasma insulin did not differ significantly among the diabetic groups, hepatic GLUT2 mRNA level was measured to investigate whether ORT reduced blood glucose level by stimulating hepatic glucose uptake. GLUT2 mRNA level in the liver was significantly lower in DC mice than in NC mice [Fig. 6(A)]. However, GLUT2 expression was significantly higher in the DORT and DMet groups than in the DC group.
Fig. 6.
Effect of ORT on GLUT2 expression and glycogen contents in the liver of diabetic mouse. In STZ-induced diabetic ICR mouse, ORT (0.6 g/kg BW) and Met (0.6 g/kg BW) were orally administered for 22 days. After euthanization, expression of glucose transporter 2 (GLUT2) mRNA in the liver (A) was measured by qRT-PCR. Concentration of liver glycogen (B) was measured. Values are presented as the mean ± SE. Means with different letters are significantly different at p < 0.05 using Duncan’s multiple range test. NS not significant, NC normal control, DC diabetes control, DORT diabetes + oxyresveratrol, DMet diabetes + metformin
In diabetes, hepatic glycogen is metabolized to glucose, which is released into the blood and contributes to hyperglycemia. As shown in Fig. 6(B), the level of hepatic glycogen in DC mice was significantly lower than that in NC mice. Consistent with the findings of GLUT2 expression, hepatic glycogen contents in DORT and DMet groups also increased to a similar level to that of the NC group. Taken together, these suggest that ORT may be responsible for the anti-diabetic action of MB by stimulating hepatic glucose uptake and glycogen storage.
The liver plays an important role in glucose homeostasis by regulating glucose uptake and glucose storage. In contrast to muscle and fat, where glucose transport is stimulated by insulin, liver glucose transport is not sensitive to insulin [29]. GLUT2, a facilitated-diffusion glucose transporter, is expressed in a tissue-specific (liver, pancreatic β-cells, kidney tubular epithelial cells, and intestinal mucosa cells) manner and is the main isoform of glucose transporters in the liver [30]. Several studies have demonstrated that liver GLUT2 expression is regulated by glucose concentration. It has been shown that GLUT2 expression reduced during starvation but increased to normal levels after food intake [31]. However, in diabetic animals, liver GLUT2 expression appears to be contradictory. It has been reported that GLUT2 gene expression is upregulated in diabetic rats [30]. In cultured rat hepatocytes, the levels of GLUT2 mRNA and protein were significantly increased by glucose stimulation [32]. However, Akarte et al. [33] showed that GLUT2 expression in the liver of STZ-induced diabetic rats was lower than that in normal rats. Immunostained hepatocytes of STZ-induced hyperglycemic animals demonstrated that hyperglycemic rats possess markedly fewer GLUT2 positive hepatocytes than control rats do. In the present study, GLUT2 mRNA expression was significantly lower in the DC group than in the NC group.
Glycogen synthesis in the liver is impaired during diabetes [33] hence, decreased glycogen content is commonly found in the liver of diabetic animals [34]. Similarly, our study showed that glycogen levels in liver tissues were significantly lower in the DC group than in the NC group. This decrease is largely attributed to reduced glycogen synthase activity either by insulin depletion or by insulin resistance. When insulin binds to an insulin receptor on the plasma membrane, Akt signaling pathway is activated, subsequently active Akt phosphorylates and inactivates glycogen synthase kinase 3 (GSK3). Inactive GSK3 is unable to phosphorylate glycogen synthase. Thereafter, unphosphorylated active glycogen synthase initiate glycogen synthesis from glucose-6-phosphate. Any defect in the glycogen synthesis pathway leads to diabetic complications [35]. Taken together, ORT showed hypoglycemic effects by increasing liver GLUT2 expression and glycogen content. Therefore, we propose that facilitated hepatic glucose uptake and glycogen synthesis is a mechanism of the anti-diabetic effect of ORT.
There are several limitations in this study. First, since the anti-diabetic effect of MB and ORT was investigated in two independent experiments, the hypoglycemic activity of MB and ORT could not be compared. Second, only single oral doses of ORT were evaluated. It will be interesting to investigate whether the anti-diabetic activity of ORT exhibit a dose–response relationship. Third, STZ-induced diabetic animal model was employed to evaluate T1DM; therefore, it would be interesting to include insulin as a positive control. Nevertheless, to the best of our knowledge, this study is the first to report the anti-diabetic and hypoglycemic effects of MB and ORT in diabetic animals (T1DM). Considering that insulin injection is the only therapy available for controlling blood glucose concentration in T1DM patients, the insulin independent blood glucose lowering effect of ORT suggests that MB extract and its bioactive compound ORT could be developed as healthy functional food for T1DM patients.
Acknowledgements
This study was supported by Regional Innovation System (RIS) program (R0002111), Ministry of Trade, Industry and Energy, Republic of Korea.
Compliance with ethical standards
Conflict of interest
All authors declare that they have no conflict of interest.
References
- 1.Guariguata L, Whiting DR, Hambleton I, Beagley J, Linnenkamp U, Shaw JE. Global estimates of diabetes prevalence for 2013 and projections for 2035. Diabetes Res. Clin. Pract. 2014;103:137–149. doi: 10.1016/j.diabres.2013.11.002. [DOI] [PubMed] [Google Scholar]
- 2.Nakagawa T, Tanabe K, Croker BP, Johnson RJ, Grant MB, Kosugi T, Li Q. Endothelial dysfunction as a potential contributor in diabetic nephropathy. Nat. Rev. Nephrol. 2011;7:36–44. doi: 10.1038/nrneph.2010.152. [DOI] [PMC free article] [PubMed] [Google Scholar]
- 3.Weigensberg MJ, Goran MI. Type 2 diabetes in children and adolescents. Lancet. 2009;373:1743–1744. doi: 10.1016/S0140-6736(09)60961-2. [DOI] [PubMed] [Google Scholar]
- 4.Van Gaal L, Scheen A. Weight Management in Type 2 Diabetes: Current and Emerging Approaches to Treatment. Diabetes Care. 2015;38:1161–1172. doi: 10.2337/dc14-1630. [DOI] [PubMed] [Google Scholar]
- 5.Hur J. DongeubogamDongeuhak Institute. Seoul, Korea: Ryogang; 1994. pp. 2803–2805. [Google Scholar]
- 6.Kwon EH, Jang HS, Kim SW, Choi SW, Rhee SJ, Cho SH. Effects of mulberry juice and cake powders on blood glucose and lipid lowering and erythrocyticantioxidative enzyme activities in streptozotocin-induced diabetic rats. Korean J. Nut. 2007;40:199–210. [Google Scholar]
- 7.Katsube T, Yamasaki M, Shiwaku K, Ishijima T. Effect of flavonol glycoside in mulberry (Morus alba L.) leaf on glucose metabolism and oxidative stress in liver in diet-induced obese mice. J. Sci. Food Agric. 2010;90:2386–2392. doi: 10.1002/jsfa.4096. [DOI] [PubMed] [Google Scholar]
- 8.Ye F, Shen Z, Xie M. Alpha-glucosidase inhibition from a Chinese medical herb (Ramulusmori) in normal and diabetic rats and mice. Phytomedicine. 2002;9:161–166. doi: 10.1078/0944-7113-00065. [DOI] [PubMed] [Google Scholar]
- 9.Guo C, Li R, Zheng N, Xu L, Liang T, He Q. Anti-diabetic effect of ramulusmori polysaccharides, isolated from Morus alba L., on STZ-diabetic mice through blocking inflammatory response and attenuating oxidative stress. Int. Immunopharmacol. 2013;16:93–99. doi: 10.1016/j.intimp.2013.03.029. [DOI] [PubMed] [Google Scholar]
- 10.Zhang MI, Chen M, Zhang HQ, Sun S, Xia B, Wu FH. In vivo hypoglycemic effects of phenolics from the root bark of Morus alba. Fitoterapia. 2009;80:475–477. doi: 10.1016/j.fitote.2009.06.009. [DOI] [PubMed] [Google Scholar]
- 11.Choi SW, Lee YJ, Ha SB, Jeon YH, Lee DH. Evaluation of biological activity and analysis of functional constituents from different parts of mulberry (Morus alba L.) Tree. J. Korean Soc. Food Sci. Nutr. 44: 823–831 (2015)
- 12.Choi SW, Jang YJ, Lee YJ, Leem HH, Kim EO. Analysis of Functional Constituents in Mulberry (Morus alba L.) Twigs by Different Cultivars, Producing Areas, and Heat Processings. Prev. Nutr. Food Sci. 18: 256–262 (2013) [DOI] [PMC free article] [PubMed]
- 13.Chen YC, Tien YJ, Chen CH, Beltran FN, Amor EC, Wang RJ, Wu DJ, Mettling C, Lin YL, Yang WC. Morus alba and active compound oxyresveratrol exert anti-inflammatory activity via inhibition of leukocyte migration involving MEK/ERK signaling. BMC Complement Altern. Med. 2013;13:45. doi: 10.1186/1472-6882-13-45. [DOI] [PMC free article] [PubMed] [Google Scholar]
- 14.Zheng ZP, Cheng KW, Zhu Q, Wang XC, Lin ZX, Wang MF. Tyrosinase inhibitory constituents from the roots of Morusnigra: A structure-activity relationship study. J. Agric. Food Chem. 2010;58:5368–5373. doi: 10.1021/jf1003607. [DOI] [PubMed] [Google Scholar]
- 15.Lorenz P, Roychowdhury S, Engelmann M, Wolf G, Horn TF. Oxyresveratrol and resveratrol are potent antioxidants and free radical scavengers: effect on nitrosative and oxidative stress derived from microglial cells. Nitric Oxide. 2003;9:64–76. doi: 10.1016/j.niox.2003.09.005. [DOI] [PubMed] [Google Scholar]
- 16.Dahlqvist A. Assay of intestinal disaccharidases. Scand. J. Clin. Lab Invest. 1984;44:169–172. doi: 10.3109/00365518409161400. [DOI] [PubMed] [Google Scholar]
- 17.Seifter S, Dayton S. The estimation of glycogen with the anthrone reagent. Arch. Biochem. 1950;25:191–200. [PubMed] [Google Scholar]
- 18.Pfaffl MW. A new mathematical model for relative quantification in real-time RT–PCR. Nucleic Acids Res. 2001;29:e45. doi: 10.1093/nar/29.9.e45. [DOI] [PMC free article] [PubMed] [Google Scholar]
- 19.Zhou J, Xu G, Yan J, Li K, Bai Z, Cheng W, Huang K. Rehmanniaglutinosa (Gaertn.) DC. polysaccharide ameliorates hyperglycemia, hyperlipemia and vascular inflammation in streptozotocin-induced diabetic mice. J. Ethnopharmacol. 2015;164:229–238. doi: 10.1016/j.jep.2015.02.026. [DOI] [PubMed] [Google Scholar]
- 20.Wang Z, Gleichmann H. GLUT2 in pancreatic islets: crucial target molecule in diabetes induced with multiple low doses of streptozotocin in mice. Diabetes. 1998;47:50–56. doi: 10.2337/diab.47.1.50. [DOI] [PubMed] [Google Scholar]
- 21.Chassaing B, Raja SM, Lewis JD, Srinivasan S, Gewirtz AT. Colonic microbiota encroachment correlates with dysglycemia in humans. Available from: 10.1016/j.jcmgh.2017.04.001. Accessed April 2017 [DOI] [PMC free article] [PubMed]
- 22.Wei SH, Chen YP, Chen MJ. Selecting probiotics with the abilities of enhancing GLP-1 to mitigate the progression of type 1 diabetes in vitro and in vivo. J. Funct. Foods. 2015;18:473–486. doi: 10.1016/j.jff.2015.08.016. [DOI] [Google Scholar]
- 23.Qiu F, Komatsu K, Saito K, Kawasaki K, Yao X, Kano Y. Pharmacological properties of traditional medicines. XXII. Pharmacokinetic study of mulberroside A and its metabolites in rat. Biol. Pharm. Bull. 1996;19:1463–1467. doi: 10.1248/bpb.19.1463. [DOI] [PubMed] [Google Scholar]
- 24.Shin NH, Ryu SY, Lee H, Min KR, Kim Y. Inhibitory effects of hydroxystilbenes on cyclooxygenase from sheep seminal vesicles. Planta Med. 1998;64:283–284. doi: 10.1055/s-2006-957430. [DOI] [PubMed] [Google Scholar]
- 25.Wang Q, Xu J, Rottinghaus GE, Simonyi A, Lubahn D, Sun GY, Sun AY. Resveratrol protects against global cerebral ischemic injury in gerbils. Brain Res. 2002;958:439–447. doi: 10.1016/S0006-8993(02)03543-6. [DOI] [PubMed] [Google Scholar]
- 26.Mouihate A, Horn TF, Pittman QJ. Oxyresveratrol dampens neuroimmune responses in vivo: a selective effect on TNF-alpha. Am. J. Physiol. Regul. Integr. Comp. Physiol. 2006;291:R1215–1221. doi: 10.1152/ajpregu.00250.2006. [DOI] [PubMed] [Google Scholar]
- 27.Lam KS, Tiu SC, Tsang MW, Ip TP, Tam SC. Acarbose in NIDDM patients with poor control on conventional oral agents. A 24-week placebo-controlled study. Diabetes Care. 1998;21:1154–1158. doi: 10.2337/diacare.21.7.1154. [DOI] [PubMed] [Google Scholar]
- 28.Deng YX, Chen YS, Zhang WR, Chen B, Qiu XM, He LH, Mu LL, Yang CH, Chen R. Polysaccharide from Gynuradivaricata modulates the activities of intestinal disaccharidases in streptozotocin-induced diabetic rats. Br. J. Nutr. 2011;106:1323–1329. doi: 10.1017/S0007114511001693. [DOI] [PubMed] [Google Scholar]
- 29.Williams TF, Exton JH, Park CR, Regen DM. Stereospecific transport of glucose in the perfused rat liver. Am. J. Physiol. 1968;215:1200–1209. doi: 10.1152/ajplegacy.1968.215.5.1200. [DOI] [PubMed] [Google Scholar]
- 30.Thorens B, Sarkar HK, Kaback HR, Lodish HF. Cloning and functional expression in bacteria of a novel glucose transporter present in liver, intestine, kidney, and beta-pancreatic islet cells. Cell. 1988;55:281–290. doi: 10.1016/0092-8674(88)90051-7. [DOI] [PubMed] [Google Scholar]
- 31.Thorens B, Flier JS, Lodish HF, Kahn BB. Differential regulation of two glucose transporters in rat liver by fasting and refeeding and by diabetes and insulin treatment. Diabetes. 1990;39:712–719. doi: 10.2337/diab.39.6.712. [DOI] [PubMed] [Google Scholar]
- 32.Im SS, Kang SY, Kim SY, Kim HI, Kim JW, Kim KS, Ahn YH. Glucose-stimulated upregulation of GLUT2 gene is mediated by sterol response element-binding protein-1c in the hepatocytes. Diabetes. 2005;54:1684–1691. doi: 10.2337/diabetes.54.6.1684. [DOI] [PubMed] [Google Scholar]
- 33.Akarte AS, Srinivasan BP, Gandhi S. Vildagliptin selectively ameliorates GLP-1, GLUT4, SREBP-1c mRNA levels and stimulates beta-cell proliferation resulting in improved glucose homeostasis in rats with streptozotocin-induced diabetes. J. Diabetes Complications. 2012;26:266–274. doi: 10.1016/j.jdiacomp.2012.03.013. [DOI] [PubMed] [Google Scholar]
- 34.Welihinda J, Karunanayake EH. Extra-pancreatic effects of Momordicacharantia in rats. J. Ethnopharmacol. 1986;17:247–255. doi: 10.1016/0378-8741(86)90112-1. [DOI] [PubMed] [Google Scholar]
- 35.Rashid K, Das J, Sil PC. Taurine ameliorate alloxan induced oxidative stress and intrinsic apoptotic pathway in the hepatic tissue of diabetic rats. Food Chem. Toxicol. 2013;51:317–329. doi: 10.1016/j.fct.2012.10.007. [DOI] [PubMed] [Google Scholar]


