Abstract
Our experiments investigated roles of phenolic compounds and melanoidins on antioxidant activity of Indonesia robusta and arabica coffee extracts. The 2,2,-diphenyl-1-picrylhydrazyl (DPPH) assay and a ferric reducing antioxidant power (FRAP) method were used to determine the antioxidant activity. An increase in the roasting degree (green, light, medium, and dark) reduced phenolic compounds and the antioxidant activity of coffee extracts, but enhanced melanoidin content. Principle component analysis (PCA) demonstrated that phenolic compounds showed stronger effects on antioxidant activity of coffee extracts in comparison with melanoidins. This finding was supported by the results of metabolomic fingerprint by partial least square (PLS), which describes the correlation of functional groups of coffee extracts on antioxidant activity. Based on the PLS analysis, hydroxyl groups (O–H) were observed to show a positive correlation, but carbonyl (C=O) and amine (N–H) groups were attributed to a negative correlation on antioxidant activity of coffee extracts.
Keywords: Antioxidant activity, Melanoidin, PCA, Phenolic, PLS
Introduction
Coffee is considered as one of the most important commodities in the world. It is reported to have high antioxidant potential, which is even higher than that of tea, wine, and beer [1]. Ruiz et al. [2] reported that phenolic compounds such as chlorogenic acid contribute to antioxidant activity of coffee. Other compounds responsible for antioxidant activity of coffee are caffeic acids, ferulic acids, and hydroxycinnamic acids [3]. However, the roasting process may decrease antioxidant activity of coffee, which is conferred by the degradation of phenolic compounds [4].
During roasting, changes in chemical composition may occur through the Maillard reaction. Decomposition of coffee results in some compounds such as trigonella and chlorogenic acid, but another compound, melanoidin is also formed [5]. Melanoidin is the end product of the Maillard reaction, which is formed as a result of interaction between reducing sugar and amino acids. This compound is reported to have antioxidant activity [6]. The influence of the roasting conditions on antioxidant activity has remained an interesting consideration mainly related to the roles of phenolic compounds and melanoidins on antioxidant activity, which is useful in optimizing functional effects of coffee beverages.
In our study, a metabolomic approach was used to investigate the influence of phenolic compounds and melanoidins on antioxidant activity of coffee extracts. Metabolomics is a qualitative or quantitative comprehensive metabolite assessment of an organism using multivariate analyses [7]. Multivariate analyses with PCA are used to understand the influence of phenolic compounds and melanoidins on antioxidant activity of coffee extracts. Additionally, PLS was also employed to observe the correlation between changes in chemical composition as a result of the roasting process and antioxidant activity of coffee extracts.
Materials and methods
Materials
Samples and preparation
Green coffee (C. arabica var. Mangkuraja and C. canephora var. Lampung) was obtained from PT. Aneka Coffee Industry Sidoarjo, East Java, Indonesia. The green beans were roasted using a sample coffee roaster Probat (Emmerich, Germany) at 200–210 °C to attain a roasting degree corresponding to the index of reflectance (IR): light (108–115), medium (86–91), and dark (76–80). IR was measured using a colorimeter Colorette 3b Probat (Emmerich, Germany). All samples were packaged using aluminum foil and stored at 4 °C for analysis.
Coffee beans were grounded using a coffee grinder Eureka Mignon (IE Global Pte Ltd, Singapore) to obtain the adequate particle size: 50% retention in 50 mesh, 40% retention in 40 mesh, and 10% retention in 30 mesh. Coffee powder (5 g) was added to boiling water (100 °C) and stirred using a magnetic stirrer for 1 min in a hotplate. The solution was then cooled and stirred using a magnetic stirrer for 2 min and filtered using Whatman paper no. 1 (Whatman International Ltd., Maidstone, England). The coffee extract was transferred to a dark glass bottle, and its total soluble solid (TSS) content was detected using a refractometer SCM 1000 (Shanghai Ltd, Shanghai, China). TSS values were then used for chemical analyses.
Chemicals and reagents
Folin–Ciocalteau reagent; DPPH (2,2-diphenyl-1-picrylhydrazil); TPTZ (2,4,6-tri(2-pyridyl)-S-triazine); trolox (6-hydroxy-2,5,7,8,-tetramethylchromane-2-carboxylic acid); and iron (III) chloride hexahydrate) were obtained from Sigma–Aldrich (St. Louis, MO, USA). Other materials (sodium carbonate, gallic acid, ascorbic acid, acetic acid, hydrogen chloride, potassium bromide, and ethanol) were supplied from Merck (Darmstadt, Germany). All reagents and solvents used were of analytical grade.
Methods
Determination of total phenol
Total phenol was determined according to the method of Shetty et al. [8]. The coffee extract (2.5 mL) was diluted to 10 mL using deionized water. The extract (0.1 mL) was mixed with 95% ethanol (1.9 mL) and deionized water (5 mL). Folin Ciocalteu reagent (0.5 mL) and then 5% sodium carbonate (1 mL) were added to each sample. Samples were kept in a dark room for 60 min, and their absorbance was detected at λ = 725 nm using a Shimadzu 2450 UV–Vis spectrophotometer (Tokyo, Japan). A blank sample was made by substituting the sample solution with 95% ethanol. The absorbance of the gallic acid solution with different concentrations was plotted as the calibration curve. The phenol content was expressed as g gallic acid/100 g TSS.
Determination of melanoidin content
Melanoidins were determined using a dialysis method as previously described by Vignoli et al. [9]. Roasted coffee (15 mL) was transferred in 12–14 kD cutoff membranes (Spectra/Por, Irving, USA) and agitated in a baker glass containing 400 mL of water. The water was changed every 8 h to obtain colorless water. The solution remaining in the membranes was lyophilized, and melanoidins obtained were weighed, and expressed as g melanoidin/100 g TSS.
Determination of antioxidant activity
DPPH method
The DPPH assay was conducted according to a procedure described by Vignoli et al. [9] with modifications. Coffee extracts (1, 2, 3, 4, 5, and 6 mL) were diluted with deionized water to reach a volume of 10 mL. Acetic buffer (100 mM, 1 mL, pH 5.5), ethanol (1 mL), and DPPH reagent (0.5 mL) were mixed and added to the extract (10 μL). A solution of DPPH was made by mixing DPPH reagent (1.3 mg) and ethanol (10 mL). A positive control was prepared without addition of coffee extracts (absorbance 0.5–0.6), while a blank was prepared in the absence of the DPPH solution. After 5 min, the absorbance was measured at 517 nm using a UV–Vis spectrophotometer. The inhibition activity (IA %) was calculated as follows: IA (%) = 100 − (Abs sample/Abs control) × 100. Value of antioxidant activity were expressed as the minimum concentration that provides 50% reduction of free radicals (IC50).
FRAP method
The FRAP assay was performed following Vignoli et al. [9]. FRAP reagent was prepared by mixing 10 mM TPTZ (2.5 mL) in 20 mM hydrogen chloride, 20 mM iron (III) chloride hexahydrate (2.5 mL), and acetic acid (pH 3.6, 2.5 mL). The mixture was incubated at 37 °C for 30 min. The FRAP reagent (900 μL), deionized water (90 μL), and coffee extract (10 μL) were mixed and incubated at 37 °C. After 30 min, absorbance was measured at 595 nm using a UV–Vis spectrophotometer. The Trolox solution in ethanol (100–450 ppm) was used to obtain the calibration curve. Results were expressed as g trolox/100 g TSS.
Determination of functional groups using FTIR
Coffee extracts were lyophilized to form the powder. The powder obtained was then analyzed using FTIR Tensor 37 (Bruker, America) with a detector of Deuterated Triglycine Sulfate Doped with l-Alanine (DLATGS) operated at 20 ± 0.5 °C [10]. The powder (10 mg) was mixed with 90 mg of potassium bromide which was used as a reference. All samples were analyzed in a range of 4000–400 cm−1 with a resolution of 4 cm−1.
Statistical analysis
Data were evaluated using one-way ANOVA factorial, and the significance of their variance was verified by means of the Duncan test (p < 0.05) performed using the SAS 9.4 software (SAS Institute, NC, USA). The composition parameters (total phenol, melanoidins, and antioxidant activity) were the active variables used in the derivation of the principal components. PCA was also presented as a Pearson correlation of variables. PLS was constructed from FTIR absorbance (X) and antioxidant activity from FRAP (Y). PCA and PLS were performed using the XLSTAT 5.03 software Addinsoft (New York, America).
Results and discussion
Content of total phenol, melanoidins, and antioxidant activity of coffee extracts
Analysis of total phenol demonstrated that phenolic compounds decreased as roasting degree increased (Table 1). Sacchetti et al. [11] have shown that phenolic compounds of coffee extracts decrease in response to higher roasting temperature. A high temperature in the roasting process could degrade phenolic compounds. Phenolic compounds, especially chlorogenic acid degraded during roasting and were responsible for the formation of the final flavor of coffee [12]. On the contrary, there was an increase in the melanoidin content of coffee extracts with increasing roasting degree. The Maillard reaction was positively correlated with increased temperature responsible for the production of melanoidins. Berkedam et al. [5] reported that polysaccharide, galactomannan, arabinogalactan, protein, and several phenolic compounds contributed to the formation of melanoidins in coffee.
Table 1.
Content of total phenol, melanoidins, and antioxidant activity (AA) of robusta (R) and arabica (A) coffee extracts
| Samples | Total phenol (g gallic acid/100 g TSS*) | Melanoidin (g/100 g TSS*) | AA DPPH (IC50) | AA FRAP (g trolox/100 g TSS*) |
|---|---|---|---|---|
| R. green | 1.83 ± 0.02a | –** | 3.29 ± 0.05a | 38.61 ± 0.79a |
| R. light | 1.34 ± 0.01b | 18.32 ± 0.86a | 3.79 ± 0.05b | 33.75 ± 0.45a |
| R. med | 1.16 ± 0.01c | 21.17 ± 0.82a | 3.86 ± 0.07b | 28.60 ± 0.78a |
| R. dark | 1.11 ± 0.02d | 23.37 ± 0.08a | 4.74 ± 0.05d | 28.60 ± 0.78a |
| A. green | 1.28 ± 0.06b | –** | 4.17 ± 0.13c | 32.22 ± 1.25a |
| A. light | 1.16 ± 0.05c | 19.03 ± 0.70a | 5.39 ± 0.23e | 25.74 ± 1.12a |
| A. med | 1.12 ± 0.05d | 21.09 ± 0.62a | 5.75 ± 0.17f | 21.18 ± 1.21a |
| A. dark | 1.02 ± 0.07e | 22.86 ± 0.74a | 5.79 ± 0.46f | 21.05 ± 1.45a |
Values are mean ± standard deviation of five repetitions. The values in each column with different letters (a–f) show a significant difference (p < 0.05)
* Total soluble solid, ** not measured
The antioxidant activity of coffee extracts decreased with an increase in roasting degree. This is associated with degradation of phenolic compounds as a result of the roasting process. Ruiz et al. [2] stated that phenolic compounds were the main contributors to antioxidant activity of coffee. Increase in the roasting degree resulted in higher degradation of phenolic compounds, leading to decreased antioxidant activity. Our experiment showed that results of the DPPH assay and the FRAP method exhibited the same trend, with a Pearson correlation of −0.92 (the negative value is due to IC50 used for determination antioxidant activity using DPPH).
Roles of phenolic compounds and melanoidins on antioxidant activity of coffee extracts
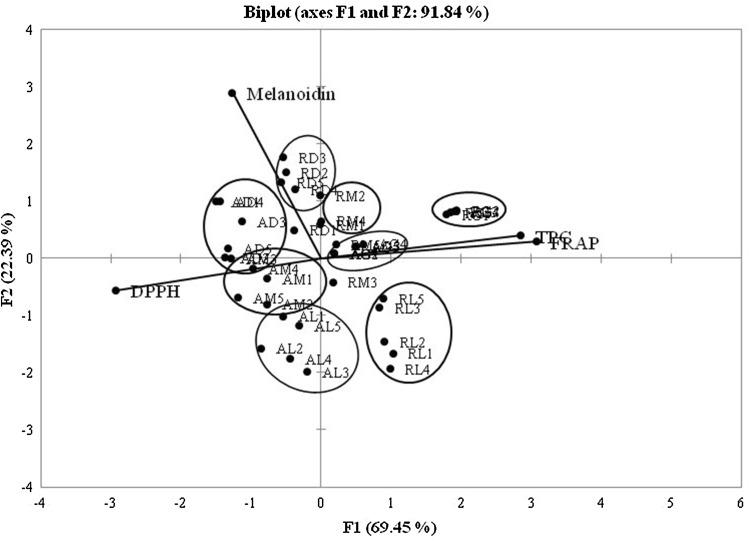
The PCA evaluation showed a PC of 91.84%. The biplot PCA could organize samples based on coffee types and roasting degree (Fig. 1). Coffee extracts of green bean robusta showed the highest correlation of total phenol and FRAP. Dark coffee samples of both coffees indicated to have high melanoidin content.
Fig. 1.
PCA total phenol (TPC), DPPH, FRAP, and melanoidins of (R) robusta (A) arabica coffee extracts. Roasting degree: green (G), light (L), med (M), and dark (D)
The biplot also exhibited that phenolic compounds had a high correlation to antioxidant activity with close loading lines, while melanoidins were located in different quadrants from the loading line of antioxidant activity. This showed that phenolic compounds affected antioxidant activity of coffee extracts more than melanoidins. Borreli et al. [13] reported that melanoidins exhibited antioxidant activity, and the presence of this component was higher with an increase in roasting degree. However, our results revealed that melanoidins showed a low contribution to antioxidant activity of coffee extracts during roasting. Del Castillo et al. [14] reported that melanoidins of coffee were grouped as some fractions: low molecule weight (LMW) and high molecule weight (HMW). LMW was only the fraction directly affecting antioxidant activity. Other results reported by Sacchetti et al. [11] showed that non-phenolic compounds had a lower contribution to antioxidant activity compared with phenolic compounds.
Correlation of functional groups to coffee extracts and antioxidant activity
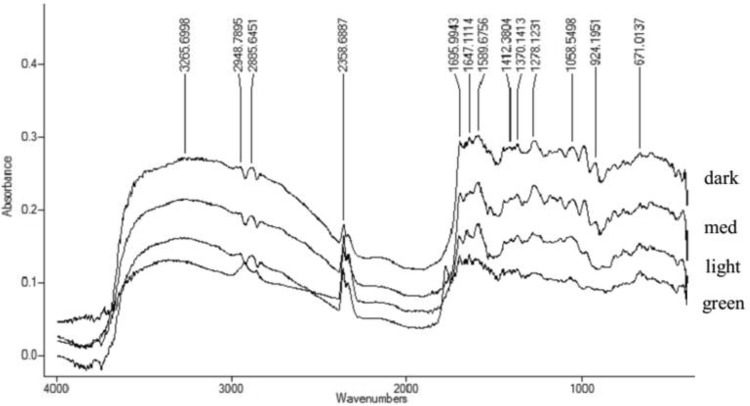
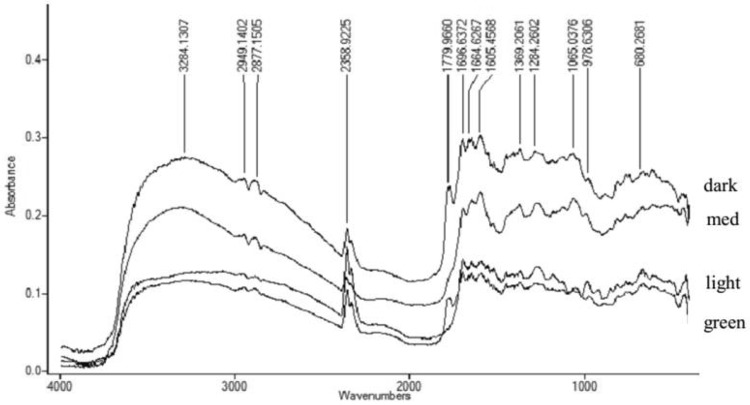
The peak at 3300 cm−1 was a hydroxyl functional group and acid hydroxyl (O–H), while the peaks at 2900 and 2800 cm−1 were the functional groups of N–H and C–H (Fig. 2). The FTIR spectrum of robusta and arabica coffee extracts showed the same pattern. A higher roasting degree resulted in a higher absorbance of functional groups. The roasting process could oxidize organic compounds such as hydroxyl groups to form aldehydes, ketones, and carboxylates, which lead to a higher absorbance of carbonyl groups (1800–1660 cm−1). The absorbance of aldehyde and ketone (1698 cm−1) of arabica coffee extracts was higher due to the roasting process from green (0.08); light (0.17); medium (0.21); and dark (0.27) (Fig. 3). Wang et al. [15] also found an increase in functional groups of ester/lactone (1788 cm−1), aldehyde (1739–1722 cm−1), ketone (1725–1705 cm−1), aromatic acids (1700–1680 cm−1), and aliphatic (1714–1705 cm−1) due to roasting process.
Fig. 2.
FTIR spectrum of robusta coffee extracts
Fig. 3.
FTIR spectrum of arabica coffee extracts
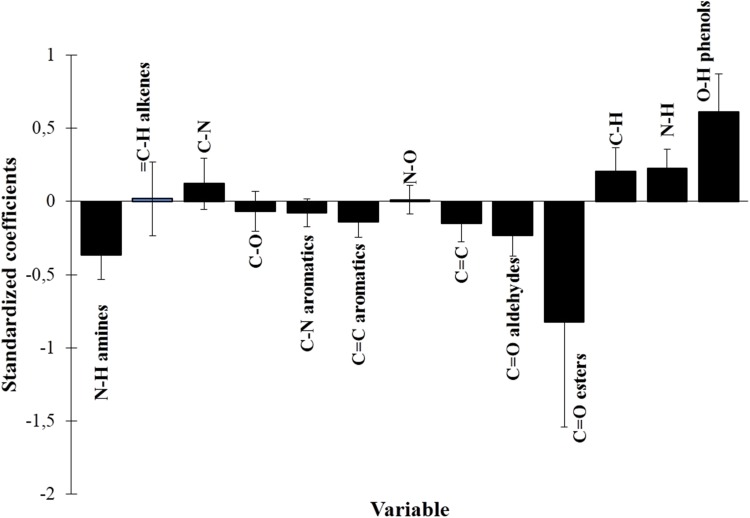
Identification of functional groups in coffee extracts was then combined to antioxidant activity using the fingerprint metabolomic approach with PLS modeling. Absorbance of the functional groups was used as the predictor matrix, while antioxidant activity from FRAP was used as the response matrix. One of PLS outputs was a standardization plot which showed effects of each predictor on the model. Our results demonstrated that hydroxyl groups (O–H) had the highest standardization coefficient (Fig. 4), suggesting that hydroxyl groups were the greatest contributors to antioxidant activity. The hydroxyl groups may have resulted from the phenolic compounds in coffee. The antioxidant mechanism of O–H was hydrogen atom transfer (HAT). Free radicals promoted H removal thus the free radicals could be scavenged [16]. Other functional groups that had positive coefficients were N–H, C–H, and C–N.
Fig. 4.
Standardization coefficient plot of functional groups and antioxidant activity of coffee extracts
Carbonyl groups such as C=O ester and C=O aldehyde showed a negative standardization coefficient, suggesting a negative correlation with antioxidant activity. These functional groups might be from components of melanoidins such as furfural and heterocyclic from the Maillard reaction. Heterocyclic component was a product of Maillard reaction on roasted coffee that had volatile properties and contribution to the formation of coffee flavor. Gonzales et al. [17] found that furan was the main component in roasted arabica coffee, followed by ketone, pyrazines, pyridines, and pyrroles. Furan had a heterocyclic structure with carbonyl functional groups. Furthermore, products of sugar degradation through the Maillard reaction, such as furfural and HMF, were also attributed to the high carbonyl groups. Therefore, C=O ester could also be a product of the Maillard reaction. Other functional groups such as amine (N–H) and aromatic (C–N) compounds could also be contributed from the Maillard reaction, particularly heterocyclic components such as pyrazines and pyridines that had amine (N–H) and aromatic (C–N) groups. Therefore, the stronger effect of phenolic compounds on antioxidant activity of coffee extracts rather than melanoidin PLS was amplified by the PLS results.
In general, melanoidin was known to have antioxidant activity, but this study obtained the reverse results. The PLS model only estimated of ester (C=O), amine (N–H), and aromatic (C–N) groups derived from melanoidins. This functional group may be derived from other components in the coffee extracts. The chemical structure of coffee melanoidins remains largely unknown [18]. This causes the mechanism and method to measured of melanoidin did not known clearly. The selection of the DPPH assay and FRAP method was a source of uncertainty in this study. Therefore, the results of this study estimated that phenolic compounds showed stronger effects on antioxidant activity of coffee extracts in comparison with melanoidin compounds.
Our conclusion revealed that the higher roasting degree showed a decrease in phenolic compounds and antioxidant activity of coffee extracts, but enhanced melanoidin content. Phenolic compounds promoted higher antioxidant activity of Indonesia robusta and arabica coffee than melanoidins. Metabolomic analysis with PLS revealed that hydroxyl groups (O–H) positively correlated to antioxidant activity of coffee extracts, while carbonyl (C=O) and amine (N–H) groups showed a negative correlation.
Compliance with ethical standards
Conflict of interest
The authors declare no conflict of interest.
References
- 1.Pellegrini N, Serafini M, Colombi B, Del Rio D, Salvatore S, Bianchi M, Brighenti F. Total antioxidant capacity of plant foods, beverages and oils consumed in Italy assessed by three different in vitro assays. J. Nutr. 2003;133:2812–2819. doi: 10.1093/jn/133.9.2812. [DOI] [PubMed] [Google Scholar]
- 2.Ruiz G, Lake DS, Ames JM. In vitro antioxidant activity of coffee compounds and their metabolites. J. Agr. Food Chem. 2007;55:6962–6969. doi: 10.1021/jf0710985. [DOI] [PubMed] [Google Scholar]
- 3.Daglia M, Racchi M, Papetti A, Lanni C, Govoni S, Gazzani G. In vitro and ex vivo antihydroxil radical activity of green and roasted coffee. J. Agr. Food Chem. 2004;52:1700–1704. doi: 10.1021/jf030298n. [DOI] [PubMed] [Google Scholar]
- 4.Somporn C, Kamtuo A, Theerakulpisut P, Siriamornpun S. Effects of roasting degree on radical scavenging activity, phenolics and volatile compounds of Arabica coffee beans. Food Sci. Technol. 2011;46:2287–2296. [Google Scholar]
- 5.Bekedam EK, Schols HA, Van Boekel MA, Smit G. Incorporation of chlorogenic acids in coffee brew melanoidins. J. Agr. Food Chem. 2008;56:2055–2063. doi: 10.1021/jf073157k. [DOI] [PubMed] [Google Scholar]
- 6.Pastoriza S, Rufián JA. Contribution of melanoidins to the antioxidant capacity of the Spanish diet. Food Chem. 2014;164:438–445. doi: 10.1016/j.foodchem.2014.04.118. [DOI] [PubMed] [Google Scholar]
- 7.Dunn WB, Ellis DI. Metabolomics: current analytical platforms and methodologies. Trends Anal. Chem. 2005;24:285–294. doi: 10.1016/j.trac.2004.11.021. [DOI] [Google Scholar]
- 8.Shetty K, Curtis OF, Levin RE, Witkowsky R, Ang W. Prevention of vitrification associated with in vitro shoot clture of oregano (Origanum vulgare) by Pseudomonas spp. J. Plant Physiol. 1995;147:447–451. doi: 10.1016/S0176-1617(11)82181-4. [DOI] [Google Scholar]
- 9.Vignoli JA, Bassoli DG, Benassi MT. Antioxidant activity, polyphenols, caffeine and melanoidins in soluble coffee: The influence of processing conditions and raw material. Food Chem. 2011;124:863–868. doi: 10.1016/j.foodchem.2010.07.008. [DOI] [Google Scholar]
- 10.Craig PA, Franca AS, Oliveira LS. Discrimination between defective and non-defective roasted coffees by diffuse reflectance infrared Fourier transform spectroscopy. Food Sci. Technol. 2012;47:505–511. [Google Scholar]
- 11.Sacchetti G, di Mattia C, Pittia P, Mastrocola D. Effect of roasting degree, equivalent thermal effect and coffee type on the radical scavenging activity of coffee brews and their phenolic fraction. J. Food Eng. 2009;90:74–80. doi: 10.1016/j.jfoodeng.2008.06.005. [DOI] [Google Scholar]
- 12.Trugo LC, Macrae R. An investigation of coffee roasting using high performance liquid chromatography. Food Chem. 1986;19:1–9. doi: 10.1016/0308-8146(86)90125-1. [DOI] [Google Scholar]
- 13.Borrelli RC, Visconti A, Mennella C, Anese M, Fogliano V. Chemical characterization and antioxidant properties of coffee melanoidins. J. Agr. Food Chem. 2002;50:6527–6533. doi: 10.1021/jf025686o. [DOI] [PubMed] [Google Scholar]
- 14.Del Castillo MD, Gordon MH, Ames JM. Peroxyl radical-scavenging activity of coffee brews. Eur. Food Res. Technol. 2005;221:471–477. doi: 10.1007/s00217-005-1209-1. [DOI] [Google Scholar]
- 15.Wang N, Fu Y, Lim LT. Feasibility study on chemometric discrimination of roasted arabica coffees by solvent extraction and fourier transform Infrared spectroscopy. J. Agr. Food Chem. 2011;59:3220–3226. doi: 10.1021/jf104980d. [DOI] [PubMed] [Google Scholar]
- 16.Liang N, Kitts DD. Antioxidant Property of Coffee Components: Assessment of Methods that Define Mechanisms of Action. Molecules. 2014;19:19180–19208. doi: 10.3390/molecules191119180. [DOI] [PMC free article] [PubMed] [Google Scholar]
- 17.Gonzalez-Rios O, Suarez-Quiroz ML, Renaud BR, Barel M, Guyot B, Guiraud JP, Schorr-Galindo S. Impact of ‘‘ecological’’ post-harvest processing on coffee aroma: II. roasted coffee. J. Food Compos. Anal. 2007;20:297–307. doi: 10.1016/j.jfca.2006.12.004. [DOI] [Google Scholar]
- 18.Moreira AS, Nunes FM, Domingues MR, Coimbra MA. Coffee melanoidins: structures, mechanisms of formation and potential health impacts. Food Funct. 2012;3:903–915. doi: 10.1039/c2fo30048f. [DOI] [PubMed] [Google Scholar]


