

Abstract
To provide a platform for evaluating significant interactions contributing to the enhanced physiological efficacy and reduced hepatotoxicity, we used a robust design to determine the optimal combination of six major green tea catechins, epigallocatechin gallate (EGCG), epigallocatechin (EGC), epicatechin gallate (ECG), epicatechin (EC), gallocatechin, and catechin. Based on the mixture design, 28 experiments were performed to inhibit nitric oxide (NO) in RAW 264.7 cells and hepatotoxicity in Chang liver cells. Significant candidates, EGCG, EC, gallocatechin and catechin, were selected after optimization. The combination showing simultaneous enhancement of NO inhibition and reduction of hepatotoxicity was EGCG and gallocatechin at a ratio of 0.65 to 0.35 by surface response methodology and desirability function, through which their co-treatment was validated. Here, we describe a platform for simultaneously determining the optimized combination of natural components exerting enhanced efficacy and reduced toxicity.
Electronic supplementary material
The online version of this article (doi:10.1007/s10068-017-0111-5) contains supplementary material, which is available to authorized users.
Keywords: Catechins, Hepatotoxicity, Nitric oxide, Robust design, Robust optimization
Introduction
Accumulating evidence has demonstrated that natural resources possess health benefits for preventing the chronic diseases including obesity, inflammation, and cancer [1–3]. Natural resources contain a number of components, and studies have attempted to identify single molecules responsible for physiological activity using different extraction methods and/or instrumental analysis [4, 5]. Many studies have also evaluated the synergistic effects of natural product ingredients [6, 7]. Recently, combination of resveratrol and ellagic acid was found to synergistically inhibit 7,12-dimethylbenz[a]anthracene-induced epidermal hyperplasia [7]. However, studies of natural substances and their major active constituents have shown controversial results. For example, the consumption of soy food has been reported to be associated with a significant reduction of breast cancer risk [8–10], while some animal studies showed enhanced breast tumor growth following treatment with genistein, a major active isoflavone [11–14]. In addition, capsaicin, a major pungent constituent in hot pepper, was reported to act as a co-carcinogen during skin carcinogenesis [15]. These results suggest that the different interactions among food constituents lead to different physiological outcomes.
One concern related to pure ingredients from a natural product is toxicity. Herbal medicines used for a long period of time in Asia are generally considered as safe, but some were reported to induce hepatotoxicity [16]. However, PHY906 prepared from four herbs (Scutellaria baicalensis, Paeonia lactiflora, Ziziphus jujube, and Glycyrrhiza uralensis) reduced gastrointestinal toxicity induced by the chemotherapeutic drug irinotecan and enhanced the anti-tumor activity of irinotecan in colorectal cancer [17, 18], supporting that combinations of natural resources can modulate toxicity.
It is important to identify optimal combinations of natural ingredients to enhance the efficacy of health benefits and reduce toxicity. However, it is difficult to test interactions among the constituents in natural resources because of the large number of tests required. In addition, conventional ‘one-at-a-time’ approximation may not reveal the optimal combination of natural ingredients because it cannot characterize possible interactions among input variables when considering the concentrations and different types of ingredients. Therefore, an approach for minimizing the number of tests to obtain the maximum number of significant results it is required.
Based on the reliability of statistical information, a small number of experiments may not provide reliable information containing all possible statistical interactions because the degree of freedom is not sufficient for statistical analysis. However, experimental design methods can reveal high dimensional correlations and interactions among many input variables by reducing the number of experimental runs. Based on the results of these experiments, it is often necessary to determine optimal input variable settings to minimize/maximize their associated output responses. Robust design (RD), which is a sequential design and optimization method, can provide the best settings for input variables while identifying functional relationships between input variables and output responses. In natural product experiments, RD can be used to determine the optimal combinations of natural ingredients. RD methods involve three main procedures: experimental design, parameter estimation, and optimization to obtain optimal variable settings [19]. A systematic RD procedure was developed by integrating both the mixture experimental design considering the combination of natural ingredients and response surface methodology (RSM) analyzing the functional relationship between input variables and their associated output responses. In addition, the optimal combination of natural ingredients can also be obtained using an RD optimization method based on a desirability function (DF).
In this study, we provided the significant platform using an RD approach for determining the optimal combination enhancing biological efficacy, nitric oxide (NO) inhibition, and reducing hepatotoxicity simultaneously with six catechins in green tea and validated.
Materials and methods
Reagents and cell culture
Epigallocatechin gallate (EGCG), epigallocatechin (EGC), epicatechin gallate (ECG), epicatechin (EC) and catechin were purchased from Sigma (St. Louis, MO, USA) and gallocatechin was from BOC Science (Shirley, NY, USA). Chang liver cells were obtained from ATCC (Manassas, VA USA) and cultured in Dulbecco’s modified eagle’s medium (DMEM, Biowest, Nuaillé France) with 10% fetal bovine serum (Biowest) and 1% penicillin/streptomycin (Life Technologies, Carlsberg, CA, USA). RAW 264.7 cells were obtained from the Korean Cell Line Bank (Seoul, Korea) and cultured in DMEM supplemented with 10% fetal bovine serum, 1% penicillin/streptomycin and 1% HEPES (Life Technologies). The cells were incubated at 37 °C, and 5% CO2 (Panasonic Healthcare, Wood Dale, IL, USA).
Inhibition of NO synthesis
RAW 264.7 cells were seeded in a 96-well plate and treated with 100 ng/mL lipopolysaccharide (LPS, Sigma) and different combination of green tea catechins for 15 h. NO production was quantified using Griess reagent system (Promega, Madison, WI, USA). Briefly, supernatants were collected and the concentration of NO was measured using sulfanilamide solution (1% sulfanilamide in 5% phosphoric acid) and naphthylethylenediamine solution (0.1% N-1-napthylethylenediamine dihydrochloride in distilled water) for 10 min. The absorbance at 540 nm was measured using microplate reader (Molecular Devices, Sunnyvale, CA, USA).
Lactate dehydrogenase (LDH) assay
Chang liver cells were seeded in 96-well plates and treated with different combinations of green tea catechins for 24 h. Next, the activity of LDH released into the medium was measured using a Pierce™ LDH Cytotoxicity Assay Kit (Pierce, Rockford, IL, USA).
Robust design methods
The proposed systematic design and statistical analysis procedure were sequentially implemented in natural ingredient experiments. The main purpose of these experiments was to identify the optimal combinations of six input ingredients (green tea catechins) in order to simultaneously minimize hepatotoxicity and maximize NO inhibitory activity. The overall procedure and analysis methods are shown in Fig. 1. In addition, the sequential RD methods including experimental design, estimation, and optimization are shown in Table S1.
Fig. 1.
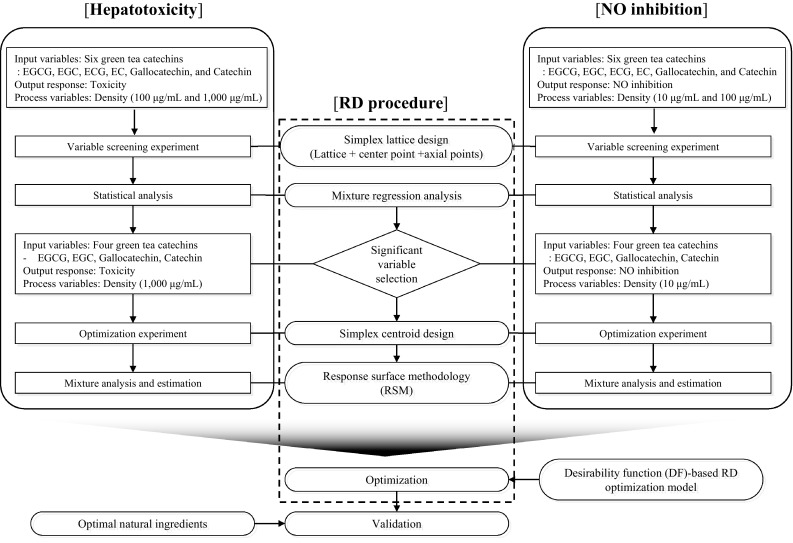
Overall scheme of the application of robust design (RD) (experimental design, parameter estimation, and optimization) for determining the optimized combination that simultaneously increased NO inhibitory activity and reduced hepatotoxicity
Experimental design
The mixture design proposed by Scheffe [20] is often used to examine mixtures of ingredients and their associated interactions. The properties of the mixture are functions of the relative proportions in different ingredients rather than their absolute amounts. Here, the values of input variables were their proportions in the mixture, which can be between zero and one [21]. The proportions of all ingredients in each mixture experimental design point must sum to 100%. Therefore, the properties of a mixture were represented using the following formula:
| 1 |
where is the proportion of component () and is the number of components (i.e., input variables). Among the mixture designs, the simplex design is one of the most popular methods for conducting blending experiments. In this design, the polynomial regression model illustrates the response surface across the entire simplex region. There are standard simplex mixture designs for fitting standard models, such as simplex lattice designs and simplex centroid designs.
Regression analysis
Among the variety of ingredients in natural products, a large number of potentially significant ingredients can be considered as candidates in the mixture. The main objective of this experiment was to reduce the dimensionality associated with the large number of input ingredients by investigating the criticality and importance of mixture ingredients. A first-order or first-degree mixture design model is often used to construct screening designs and their corresponding models as follows:
| 2 |
where denotes a non-negative estimated coefficient. The relative effects of the ingredients can be assessed by ranking the ratios of the estimated coefficients and their associated relative standard errors. Small and large values of the estimated coefficients approximately represent insignificant and significant values, respectively.
Biological functions are often depended on a process variable (i.e., concentration) which is not a part of natural mixture ingredients, but a conditional variable affecting the blending properties of the mixture. Experimental runs are exponentially increased when process variables are added. In order to resolve this large dimensionality problem, a regression analysis method (i.e., stepwise regression) can be applied by systematically conducting significant variable screening based on statistical criteria (i.e., correlation, R 2, and p value). This regression analysis method is a semi-automated process used for model building by successively adding or removing variables solely based on the t-statistics of their estimated coefficients [22].
Response surface methodology (RSM)
RSM is typically used to identify the functional relationship between input variables and their associated output responses. In a natural product mixture experiment, the second order estimated response surface model for physiological efficacy and toxicity can be represented as follows:
| 3 |
where denotes the estimated coefficient in the regression functions. The coefficient can be estimated by using least square method as follows:
| 4 |
where is the design matrix of input variables .
Optimization
The main goal of the optimization stage was to identify the optimal settings of natural ingredients. Among the several optimization methods available, the DF-based optimization method was utilized to solve the simultaneous dual-objectives including enhancing physiological efficacy and minimizing hepatotoxicity where “the larger the better (L)-type” of the DF and “the smaller the better(S)-type” of the DF were applied, respectively. The L-type and S-type of individual desirability functions can be identified as;
| 5 |
| 6 |
where and denote the estimated functions between ingredients of a natural product. and denote the lower and upper values of physiological efficacy and and denote the lower and upper values of hepatotoxicity. The superscripts r and s represent the importance of individual DFs. The overall desirability, , a geometric mean of all DFs, can be expressed as follows:
| 7 |
The optimal combinations of ingredients are obtained when the overall desirability is maximized.
Results and discussion
Initial experiment of six different green tea catechins to investigate NO inhibition and hepatotoxicity
NO is generally produced by NO synthase in activated macrophages and plays a critical role in immune responses and inflammation where it is involved in the synthesis of different reactive nitrogen species [23]. In the initial experimental design to screen significant variables to evaluate NO inhibitory efficacy and hepatotoxicity simultaneously, the simplex lattice design with two lattices including center and axial points was performed in 28 runs (Table S2). The inhibition of NO synthesis induced by LPS was tested at two different concentrations, 10 µg/mL () and 100 µg/mL () with three replications based on different combinations of six green tea catechins, EGCG (), EGC (), ECG (), EC (), gallocatechin (), and catechin () in RAW 264.7 cells. As shown in Table S2, single treatment with EGCG, EGC, ECG, EC, gallocatechin, and catechin exerted 32.6, 48.8, 21.9, 32.6, 19.3, and 7.0% of NO inhibitory activities at 10 μg/mL, respectively. However, a mixture of six catechins in which the major component was EC showed the strongest NO inhibition of 62.3%, suggesting that interactions among catechins may enhance physiological efficacy. Similarly, hepatotoxicity induced by combination treatment of green tea catechins was also investigated at 100 µg/mL () and 1000 µg/mL () with three replications in Chang liver cells.
Interactive combinations exerting enhanced NO inhibition and reduced hepatotoxicity among six green tea catechins based on regression analysis
The main effects on NO inhibition and hepatotoxicity of six green tea catechins at different concentrations were investigated using well-established regression analysis methods. In many experimental design and analysis cases, regression analysis methods can be utilized to perform significant ingredient selections based on the large number of main and interaction effects. As shown in Fig. 2(A and B) and Fig. S1 (A and B), 10 µg/mL EC and 100 µg/mL EGC and gallocatechin were most effective inhibitors of LPS-induced NO synthesis, respectively, whereas 100 µg/mL and 1000 µg/mL ECG showed the weakest hepatotoxicity. In addition, the interaction effects of six green tea catechins are shown in Fig. 2(C and D) and Fig. S1 (C and D). According to NO inhibition analysis, the combination of 10 µg/mL of EGCG, EC, and catechin and 100 µg/mL of EGCG and catechin showed the strongest enhancement of activity in RAW 264.7 cells, respectively, whereas the combination of 100 µg/mL of ECG, EC, and catechin and 1000 µg/mL of EGCG, gallocatechin, and catechin reduced hepatotoxicity in Chang liver cells. However, because of the high complexity and dimensionality associated with a large number of interaction effects, we conducted optimization using the DF model as identified in Eqs. (5), (6), and (7) in order to identify ingredients that significantly affected NO inhibition and hepatotoxicity. The optimization results shown in Table 1 revealed four significant ingredients, EGCG, EC, gallocatechin, and catechin, which were selected for further experiments.
Fig. 2.

A and B Main-effects of six green tea catechins on NO inhibition at 10 μg/mL and hepatotoxicity at 1000 μg/mL, respectively. C and D Interactive effects of six green tea catechins on NO inhibition at 10 μg/mL and hepatotoxicity 1000 μg/mL, respectively
Table 1.
Optimization results for the screening experiment
| Response | Target | Optimal value | Optimal setting | |||||
|---|---|---|---|---|---|---|---|---|
| EGCG | EGC | ECG | EC | Gallocatechin | Catechin | |||
| Hepatotoxicity | Min | −10.33 | 35.35 (Significant) | 0 (Not significant) | 0 (Not significant) | 5.39 (Significant) | 30.32 (Significant) | 28.94 (Significant) |
| No inhibition | Max | 96.00 | ||||||
Simplex centroid design for further RSM and statistical analysis
In order to design additional detailed experiments for the selected four candidates, EGCG (), EC (), gallocatechin (), and catechin (), a simplex centroid design was employed and 19 runs of experiments examining NO inhibition and hepatotoxicity were performed. A more clearly optimized combination of selected catechins was investigated to maximize the inhibition of NO synthesis at lower concentration (10 µg/mL) and minimize hepatotoxicity at higher concentration (1000 µg/mL). As shown in Table 2, co-treatment with EGCG and gallocatechin at the same ratio inhibited NO synthesis to a larger extent than any other combinations or single treatment, whereas catechin and co-treatment with EC and catechin showed lower hepatotoxicity.
Table 2.
Simplex centroid experimental design results
| SOa | EOa | Input variables | Output response (% NO production inhibition) | Output response (% Toxicity) | |||||||||||||
|---|---|---|---|---|---|---|---|---|---|---|---|---|---|---|---|---|---|
| (10 μg/mL) | (1000 μg/mL) | ||||||||||||||||
| 17 | 1 | 0.12 | 0.62 | 0.12 | 0.12 | 12.6 | 23.0 | 23.0 | 21.1 | 8.4 | 21.1 | 26.0 | 26.6 | 28.8 | 22.3 | 24.7 | 25.1 |
| 5 | 2 | 0.50 | 0.50 | 0.00 | 0.00 | 28.7 | 26.2 | 26.2 | 21.3 | 23.7 | 23.7 | 31.2 | 30.8 | 31.6 | 25.3 | 26.1 | 26.7 |
| 9 | 3 | 0.00 | 0.50 | 0.00 | 0.50 | 6.0 | 13.9 | 13.9 | -9.3 | 4.6 | 4.6 | 6.6 | 6.1 | 6.0 | 3.3 | 4.0 | 4.8 |
| 18 | 4 | 0.12 | 0.12 | 0.62 | 0.12 | 13.7 | 8.7 | 8.7 | 11.4 | 10.2 | 17.6 | 22.2 | 21.8 | 20.5 | 17.3 | 18.1 | 17.1 |
| 11 | 5 | 0.33 | 0.33 | 0.33 | 0.00 | 24.3 | 20.4 | 20.4 | 38.9 | 41.5 | 41.5 | 22.9 | 23.7 | 21.5 | 20.6 | 18.2 | 17.8 |
| 10 | 6 | 0.00 | 0.00 | 0.50 | 0.50 | 10.0 | 6.0 | 6.0 | 13.5 | 11.0 | 17.3 | 18.1 | 18.7 | 17.8 | 14.7 | 15.3 | 15.8 |
| 13 | 7 | 0.33 | 0.00 | 0.33 | 0.33 | 17.5 | 20.0 | 20.0 | 32.3 | 27.4 | 32.3 | 18.1 | 18.7 | 17.0 | 13.4 | 14.2 | 12.9 |
| 7 | 8 | 0.50 | 0.00 | 0.00 | 0.50 | 19.1 | 34.7 | 34.7 | 30.0 | 32.6 | 31.3 | 15.7 | 17.9 | 16.8 | 11.8 | 12.1 | 14.2 |
| 14 | 9 | 0.00 | 0.33 | 0.33 | 0.33 | 7.5 | 7.5 | 7.5 | 10.2 | 12.7 | 12.7 | 18.0 | 19.1 | 19.8 | 16.3 | 13.7 | 16.0 |
| 15 | 10 | 0.25 | 0.25 | 0.25 | 0.25 | 23.7 | 20.0 | 20.0 | 31.1 | 33.6 | 33.6 | 21.6 | 20.1 | 22.3 | 17.0 | 15.4 | 17.7 |
| 16 | 11 | 0.62 | 0.12 | 0.12 | 0.12 | 24.3 | 21.7 | 21.7 | 28.8 | 23.7 | 25.0 | 14.9 | 15.6 | 15.7 | 10.9 | 11.6 | 12.0 |
| 12 | 12 | 0.33 | 0.33 | 0.00 | 0.33 | 19.1 | 15.2 | 15.2 | 19.9 | 21.1 | 21.1 | 20.4 | 20.7 | 20.6 | 15.8 | 18.2 | 16.2 |
| 3 | 13 | 0.00 | 0.00 | 1.00 | 0.00 | 12.5 | 11.2 | 11.2 | 13.9 | 15.1 | 11.4 | 18.2 | 17.8 | 16.0 | 12.1 | 12.1 | 12.4 |
| 2 | 14 | 0.00 | 1.00 | 0.00 | 0.00 | 22.5 | 23.7 | 23.7 | 20.0 | 21.3 | 21.3 | 18.3 | 17.4 | 18.8 | 15.2 | 14.8 | 15.8 |
| 6 | 15 | 0.50 | 0.00 | 0.50 | 0.00 | 47.8 | 45.2 | 45.2 | 51.6 | 46.6 | 49.1 | 13.5 | 15.1 | 14.5 | 10.7 | 12.0 | 11.7 |
| 8 | 16 | 0.00 | 0.50 | 0.50 | 0.00 | 21.2 | 27.5 | 27.5 | 28.6 | 27.4 | 25.0 | 26.3 | 26.1 | 28.6 | 21.2 | 21.0 | 20.5 |
| 1 | 17 | 1.00 | 0.00 | 0.00 | 0.00 | 29.5 | 23.0 | 23.0 | 28.8 | 26.2 | 27.5 | 8.3 | 8.1 | 8.2 | 4.5 | 5.3 | 5.3 |
| 19 | 18 | 0.12 | 0.12 | 0.12 | 0.62 | 7.5 | 10.0 | 10.0 | 18.8 | 12.7 | 12.7 | 16.4 | 16.8 | 17.8 | 13.5 | 12.5 | 13.4 |
| 4 | 19 | 0.00 | 0.00 | 0.00 | 1.00 | 20.4 | 20.4 | 20.4 | 9.7 | 31.3 | 12.2 | 2.1 | 3.2 | 2.8 | 0.2 | 0.3 | 0.7 |
aSO and EO represent standard and experimental orders for the proposed simplex centroid experiment design, respectively
Functional relationships between output responses including NO inhibition and hepatotoxicity and their associated input variables including four green tea catechins estimated by RSM
The analysis of variance (ANOVA) results of RSM for the inhibition of NO synthesis and hepatotoxicity are summarized in Tables 3 and 4, respectively, where small p values (i.e., less than 0.05) represent significant interaction effects. The ANOVA results revealed that six interaction effects (i.e., EGCG·gallocatechin, EGCG·catechin, EC·gallocatechin, EC·catechin, EGCG·EC·Gallocatechin, and EGCG·gallocatechin·catechin) associated with NO inhibition as well as six interaction effects (i.e., EGCG·EC, EGCG·Catechin, EC·gallocatechin, EC·catechin, gallocatechin·catechin, and EGCG·EC·gallocatechin) related to hepatotoxicity were statistically significant. In addition, the estimated second-order response functions of RSM for the inhibition of NO synthesis and hepatotoxicity were respectively estimated as follows:
| 8 |
| 9 |
Table 3.
ANOVA for inhibition of NO synthesis
| Term | Degree of freedom | Sum of square | Mean square | F-value | p value |
|---|---|---|---|---|---|
| Inhibition of NO synthesis (10 μg/mL) | |||||
| Regression | 14 | 10,138.90 | 724.21 | 20.19 | 0.000 |
| Linear | 3 | 925.21 | 308.40 | 8.60 | 0.000 |
| Quadratic | 6 | 4943.93 | 823.99 | 22.98 | 0.000 |
| EGCG·EC | 1 | 2.72 | 2.72 | 0.08 | 0.783 |
| EGCG·Gallocatechin | 1 | 3237.96 | 3237.96 | 90.28 | 0.000 |
| EGCG·Catechin | 1 | 201.91 | 201.91 | 5.63 | 0.020 |
| EC·Gallocatechin | 1 | 306.28 | 306.28 | 8.54 | 0.004 |
| EC·Catechin | 1 | 1027.51 | 1027.51 | 28.65 | 0.000 |
| Gallocatehcin·Catechin | 1 | 96.12 | 96.12 | 2.68 | 0.105 |
| 3 variables interaction | 4 | 375.75 | 93.94 | 2.62 | 0.039 |
| EGCG·EC·Gallocatechin | 1 | 142.90 | 142.90 | 3.98 | 0.049 |
| EGCG·EC·Catechin | 1 | 0.53 | 0.53 | 0.01 | 0.904 |
| EGCG·Gallocatechin·Catechin | 1 | 267.21 | 267.21 | 7.45 | 0.008 |
| EC·Gallocatechin·Catechin | 1 | 27.53 | 27.53 | 0.77 | 0.383 |
| 4 variables interaction | 1 | 63.60 | 63.60 | 1.77 | 0.186 |
| EGCG·EC·Gallocatechin·Catechin | 1 | 63.60 | 63.60 | 1.77 | 0.186 |
| Error | 99 | 3550.54 | 35.86 | ||
| Total | 113 | ||||
| S = 5.98866 | R 2 = 74.06% | ||||
· Represents interaction among components (i.e., input variables)
Table 4.
ANOVA for hepatotoxicity
| Term | Degree of freedom | Sum of square | Mean square | F-value | p value |
|---|---|---|---|---|---|
| Toxicity (1000 μg/mL) | |||||
| Regression | 14 | 4565.63 | 326.12 | 43.13 | 0.000 |
| Linear | 3 | 1054.51 | 351.50 | 46.48 | 0.000 |
| Quadratic | 6 | 2172.63 | 362.10 | 47.89 | 0.000 |
| EGCG·EC | 1 | 1150.20 | 1150.20 | 152.11 | 0.000 |
| EGCG·Gallocatechin | 1 | 18.48 | 18.48 | 2.44 | 0.121 |
| EGCG·Catechin | 1 | 450.90 | 450.90 | 59.63 | 0.000 |
| EC·Gallocatechin | 1 | 275.92 | 275.92 | 36.49 | 0.000 |
| EC·Catechin | 1 | 60.70 | 60.70 | 8.03 | 0.006 |
| Gallocatehcin·Catechin | 1 | 298.21 | 298.21 | 39.44 | 0.000 |
| 3 variables interaction | 4 | 79.67 | 19.92 | 2.63 | 0.039 |
| EGCG·EC·Gallocatechin | 1 | 62.52 | 62.52 | 8.27 | 0.005 |
| EGCG·EC·Catechin | 1 | 0.01 | 0.01 | 0.00 | 0.974 |
| EGCG·Gallocatechin·Catechin | 1 | 10.22 | 10.22 | 1.30 | 0.248 |
| EC·Gallocatechin·Catechin | 1 | 3.95 | 3.95 | 0.52 | 0.472 |
| 4 variables interaction | 1 | 6.87 | 6.87 | 0.91 | 0.343 |
| EGCG·EC·Gallocatechin·Catechin | 1 | 6.87 | 6.87 | 0.91 | 0.343 |
| Error | 99 | 748.62 | 7.56 | ||
| Total | 113 | ||||
| S = 2.74987 | R 2 = 85.91% |
· Represents interaction among components (i.e., input variables)
As shown in Tables 3 and 4, the validity of the estimated response functions in Eqs. (8) and (9) was demonstrated by the small p values of regression and large values for R 2 (i.e., less than 0.05 p value and greater than 70% R 2) in the ANOVA results. In many RSM applications, second-order response functions are often utilized because of their coverture and quadratic representations with high precision. By using these second-order response functions, RD can be optimized in order to obtain the optimal ingredients while simultaneously maximizing NO inhibition and minimizing hepatotoxicity [21].
Optimal combinations of significant ingredients exerting enhanced NO inhibition and reduced hepatotoxicity simultaneously using the DF model
In order to calculate the two objectives of enhancing physiological efficacy and minimizing hepatotoxicity simultaneously, the DF-based optimization method identified in Eqs. (5), (6), and (7) was used, where the estimated functions associated with NO inhibition and hepatotoxicity were transformed into same scale. The DFs in Eqs. (5) and (6) were integrated with the estimated response functions of RSM identified in Eqs. (8) and (9). The overall desirability in Eq. (7) was then maximized to identify the optimal ingredient settings and associated values of inhibition of NO synthesis and hepatotoxicity using the MINITAB software package (Version 17, Minitab Inc. State College, PA, USA.). Using this software package, we performed the proposed RD methods with many statistical design and analysis tools, such as experimental design, regression, RSM, and optimization. This DF approach is also widely utilized in pharmaceutical science to simultaneously optimize multiple objectives associated with numorous input formulation components (24). As shown in Table 5, the optimization results for the four ingredients showed that the specific mixture of EGCG and gallocatechin at a ratio 0.65:0.35 simultaneously maximized NO inhibition and minimized hepatotoxicity.
Table 5.
Simultaneous optimization results associated with NO inhibition and hepatotoxicity
| Criteria | Objecta | Lowerb | Targetc | Upperd |
|---|---|---|---|---|
| NO inhibition | Maximum | 20 | 55 | – |
| Hepatotoxicity | Minimum | – | 0 | 30 |
| Component | EGCG | EC | Gallocatechin | Catechin |
| Optimal solutions | 0.65 | 0 | 0.35 | 0 |
aObjectives (i.e., minimize and maximize) of responses (i.e., NO inhibition and Hepatotoxicity)
bAllowable minimum values
cDesirable target values
dAllowable maximum values
Co-treatment of EGCG and gallocatechin was validated to enhance NO inhibitory activity and reduce hepatotoxicity
To validate the final optimization showing maximized NO inhibitory activity and minimized hepatotoxicity, we performed experiments with EGCG and gallocatechin at a ratio of 0.65 and 0.35. As shown in Fig. 3, co-treatment of EGCG (6.5 µg/mL) and gallocatechin (3.5 µg/mL) in LPS-induced RAW 264.7 cells exerted 1.5- and 1.6-fold enhancements in NO inhibitory activity compared to the single treatment of EGCG (10 µg/mL) and gallocatechin (10 µg/mL), respectively. In addition, the hepatotoxicity induced by co-treatment with EGCG (650 µg/mL) and gallocatechin (350 µg/mL) in Chang liver cells were reduced by 1.9- and 2.4-fold, compared to individual treatment with EGCG (1000 µg/mL) and gallocatechin (1000 µg/mL), respectively. These results suggest that co-treatment with EGCG and gallocatechin at a ratio of 0.65:0.35 simultaneously enhanced NO inhibition and reduced hepatotoxicity. In addition, RD and its statistical approach for identifying the optimized combination were well-matched with the actual biological phenotypes. Previously, an experimental design was employed to optimize the extraction conditions such as extraction temperature, ethanol concentration, and extraction time to improve anti-inflammatory activity in guava leaf extracts [25]. In pharmaceutical formulations, RD has been used to optimize the formulation ratios of lubricants, retinol nanoparticles, and hydrophilic polymers [24, 26, 27]. The results of previous studies as well as the current results suggest that a statistical approach employing RD to investigate the interaction between ingredients is reliable. Furthermore, our study is unique because we determined the optimal combination of green tea catechins considering health beneficial efficacy and hepatotoxicity together using a DF model. In conclusion, we determined the optimal combination of six major green tea components that simultaneously increased NO inhibition and reduced the hepatotoxicity through RD application. The biological data based on an experimental design were analyzed and optimized using RSM and DF, respectively. The final optimized combination, EGCG and gallocatechin at a ratio of 0.65:0.35, was also validated. To our best knowledge, it is the first report employing the systematic approach involving RD considering dual physiological efficacies and may provide a reliable and significant platform for increasing the efficiency of biological experiments with the optimized number of experimental runs.
Fig. 3.
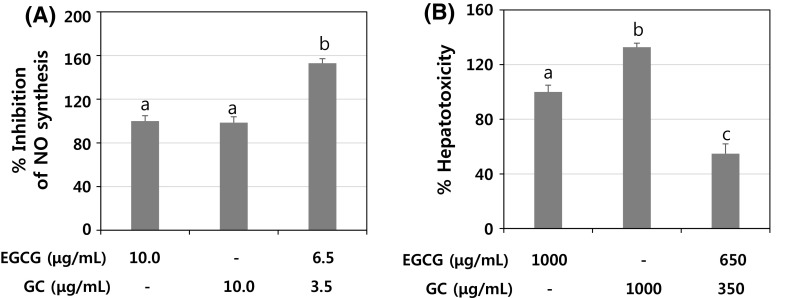
Validation of effects of the optimized combination (EGCG:gallocatechin = 0.65:0.35) on NO inhibition (A) and hepatotoxicity (B). A RAW 264.7 cells (4 × 10⁴ cells/well in 96-well plate) were treated with EGCG (10 μg/mL), GC (10 μg/mL), or EGCG (6.5 μg/mL) + GC (3.5 μg/mL) for 24 h, and NO in the culture media was quantified as described in Materials and Methods. B Change cells (1 × 10⁴ cells/well in 96-well plate) were treated with EGCG (1000 μg/mL), GC (1000 μg/mL), or EGCG (650 μg/mL) + GC (350 μg/mL) for 24 h, and cytotoxicity was measured by LDH assay. Values represent mean ± SD. a–d different letters indicate statistical differences at p < 0.05
Electronic supplementary material
Below is the link to the electronic supplementary material.
Acknowledgements
This work was supported by the Bio-Synergy Research Project (NRF2013M3A9C4078156) of the Ministry of Science, ICT and Future Planning through the National Research Foundation and Chung-Ang University Research Scholarship Grants in 2017.
Contributor Information
Sangmun Shin, Phone: +82-51-200-7688, Email: sshin@dau.ac.kr.
Hong Jin Lee, Phone: +82-31-670-3030, Email: hongjin@cau.ac.kr.
References
- 1.Balaji M, Ganjayi MS, Hanuma Kumar GE, Parim BN, Mopuri R, Dasari S. A review on possible therapeutic targets to contain obesity: The role of phytochemicals. Obes. Res. Clin. Pract. 2016;10:363–380. doi: 10.1016/j.orcp.2015.12.004. [DOI] [PubMed] [Google Scholar]
- 2.Gullett NP, Ruhul Amin AR, Bayraktar S, Pezzuto JM, Shin DM, Khuri FR, Aggarwal BB, Surh YJ, Kucuk O. Cancer prevention with natural compounds. Semin. Oncol. 2010;37:258–281. doi: 10.1053/j.seminoncol.2010.06.014. [DOI] [PubMed] [Google Scholar]
- 3.Kaulmann A, Bohn T. Carotenoids, inflammation, and oxidative stress-implications of cellular signaling pathways and relation to chronic disease prevention. Nutr. Res. 2014;34:907–929. doi: 10.1016/j.nutres.2014.07.010. [DOI] [PubMed] [Google Scholar]
- 4.Arai MA, Akamine R, Sadhu SK, Ahmed F, Ishibashi M. Hedgehog/GLI-mediated transcriptional activity inhibitors from Crinum asiaticum. J. Nat. Med. 2015;69:538–542. doi: 10.1007/s11418-015-0922-8. [DOI] [PubMed] [Google Scholar]
- 5.Arai MA, Tateno C, Hosoya T, Koyano T, Kowithayakorn T, Ishibashi M. Hedgehog/GLI-mediated transcriptional inhibitors from Zizyphus cambodiana. Bioorg. Med. Chem. 2008;16:9420–9424. doi: 10.1016/j.bmc.2008.09.053. [DOI] [PubMed] [Google Scholar]
- 6.Axanova LS, Chen YQ, McCoy T, Sui G, Cramer SD. 1,25-dihydroxyvitamin D(3) and PI3 K/AKT inhibitors synergistically inhibit growth and induce senescence in prostate cancer cells. Prostate. 2010;70:1658–1671. doi: 10.1002/pros.21201. [DOI] [PMC free article] [PubMed] [Google Scholar]
- 7.Kowalczyk MC, Kowalczyk P, Tolstykh O, Hanausek M, Walaszek Z, Slaga TJ. Synergistic effects of combined phytochemicals and skin cancer prevention in SENCAR mice. Cancer Prev. Res. (Phila) 2010;3:170–178. doi: 10.1158/1940-6207.CAPR-09-0196. [DOI] [PubMed] [Google Scholar]
- 8.Hilakivi-Clarke L, Andrade JE, Helferich W. Is soy consumption good or bad for the breast? J. Nutr. 2010;140:2326S–2334S. doi: 10.3945/jn.110.124230. [DOI] [PMC free article] [PubMed] [Google Scholar]
- 9.Shu XO, Zheng Y, Cai H, Gu K, Chen Z, Zheng W, Lu W. Soy food intake and breast cancer survival. JAMA. 2009;302:2437–2443. doi: 10.1001/jama.2009.1783. [DOI] [PMC free article] [PubMed] [Google Scholar]
- 10.Taylor CK, Levy RM, Elliott JC, Burnett BP. The effect of genistein aglycone on cancer and cancer risk: a review of in vitro, preclinical, and clinical studies. Nutr. Rev. 2009;67:398–415. doi: 10.1111/j.1753-4887.2009.00213.x. [DOI] [PubMed] [Google Scholar]
- 11.Allred CD, Allred KF, Ju YH, Clausen LM, Doerge DR, Schantz SL, Korol DL, Wallig MA, Helferich WG. Dietary genistein results in larger MNU-induced, estrogen-dependent mammary tumors following ovariectomy of Sprague-Dawley rats. Carcinogenesis. 2004;25:211–218. doi: 10.1093/carcin/bgg198. [DOI] [PubMed] [Google Scholar]
- 12.Allred CD, Ju YH, Allred KF, Chang J, Helferich WG. Dietary genistin stimulates growth of estrogen-dependent breast cancer tumors similar to that observed with genistein. Carcinogenesis. 2001;22:1667–1673. doi: 10.1093/carcin/22.10.1667. [DOI] [PubMed] [Google Scholar]
- 13.Hsieh CY, Santell RC, Haslam SZ, Helferich WG. Estrogenic effects of genistein on the growth of estrogen receptor-positive human breast cancer (MCF-7) cells in vitro and in vivo. Cancer Res. 1998;58:3833–3838. [PubMed] [Google Scholar]
- 14.Messina M, McCaskill-Stevens W, Lampe JW. Addressing the soy and breast cancer relationship: review, commentary, and workshop proceedings. J. Natl. Cancer Inst. 2006;98:1275–1284. doi: 10.1093/jnci/djj356. [DOI] [PubMed] [Google Scholar]
- 15.Hwang MK, Bode AM, Byun S, Song NR, Lee HJ, Lee KW, Dong Z. Cocarcinogenic effect of capsaicin involves activation of EGFR signaling but not TRPV1. Cancer Res. 2010;70:6859–6869. doi: 10.1158/0008-5472.CAN-09-4393. [DOI] [PubMed] [Google Scholar]
- 16.Calitz C, du Plessis L, Gouws C, Steyn D, Steenekamp J, Muller C, Hamman S. Herbal hepatotoxicity: current status, examples, and challenges. Expert Opin. Drug Metab. Toxicol.: 1–15 (2015) [DOI] [PubMed]
- 17.Kummar S, Copur MS, Rose M, Wadler S, Stephenson J, O’Rourke M, Brenckman W, Tilton R, Liu SH, Jiang Z, Su T, Cheng YC, Chu E. A phase I study of the chinese herbal medicine PHY906 as a modulator of irinotecan-based chemotherapy in patients with advanced colorectal cancer. Clin. Colorectal Cancer. 2011;10:85–96. doi: 10.1016/j.clcc.2011.03.003. [DOI] [PubMed] [Google Scholar]
- 18.Lam W, Bussom S, Guan F, Jiang Z, Zhang W, Gullen EA, Liu SH, Cheng YC. The four-herb Chinese medicine PHY906 reduces chemotherapy-induced gastrointestinal toxicity. Sci. Transl. Med. 2: 45ra59 (2010) [DOI] [PubMed]
- 19.Shin S, Cho BR. Studies on a biobjective robust design optimization problem. IIE Transactions. 2009;41:957–968. doi: 10.1080/07408170902789084. [DOI] [Google Scholar]
- 20.Scheff H. Experiments with mixtures. J. R. Stat. Soc. Series B Stat. Methodol. 20: 344–360 (1958)
- 21.Shin S, Truong NKV, Goethals PL, Cho BR, Jeong SH. Robust design modeling and optimization of a multi-response time series for a pharmaceutical process. Int. J. Adv. Manuf. Tech. 2014;74:1017–1031. doi: 10.1007/s00170-014-6036-8. [DOI] [Google Scholar]
- 22.Abderrahmane H, Abidine FZE, Hamenna B, Ammar B. Correlation, path analysis and stepwise regression in durum wheat (Triticum durum Desf.) under rainfed conditions. J. Agric. Sustain. 3: 122–131 (2013)
- 23.Predonzani A, Cali B, Agnellini AH, Molon B. Spotlights on immunological effects of reactive nitrogen species: When inflammation says nitric oxide. World J. Exp. Med. 2015;5:64–76. doi: 10.5493/wjem.v5.i2.64. [DOI] [PMC free article] [PubMed] [Google Scholar]
- 24.Jung YJ, Truong NK, Shin S, Jeong SH. A robust experimental design method to optimize formulations of retinol solid lipid nanoparticles. J. Microencapsul. 2013;30:1–9. doi: 10.3109/02652048.2012.668958. [DOI] [PubMed] [Google Scholar]
- 25.Jang M, Jeong S-W, Cho SK, Yang HJ, Yoon D-S, Kim J-C, Park K-H. Improvement in the anti-inflammatory activity of guava (Psidium guajava L.) leaf extracts through optimization of extraction conditions. J. Func. Foods 10: 161–168 (2014)
- 26.Choi DH, Lim JY, Shin S, Choi WJ, Jeong SH, Lee S. A novel experimental design method to optimize hydrophilic matrix formulations with drug release profiles and mechanical properties. J. Pharm. Sci. 2014;103:3083–3094. doi: 10.1002/jps.24080. [DOI] [PubMed] [Google Scholar]
- 27.Choi DH, Shin S, Khoa Viet Truong N, Jeong SH. A new experimental design method to optimize formulations focusing on a lubricant for hydrophilic matrix tablets. Drug Dev. Ind. Pharm. 38: 1117–1127 (2012) [DOI] [PubMed]
Associated Data
This section collects any data citations, data availability statements, or supplementary materials included in this article.