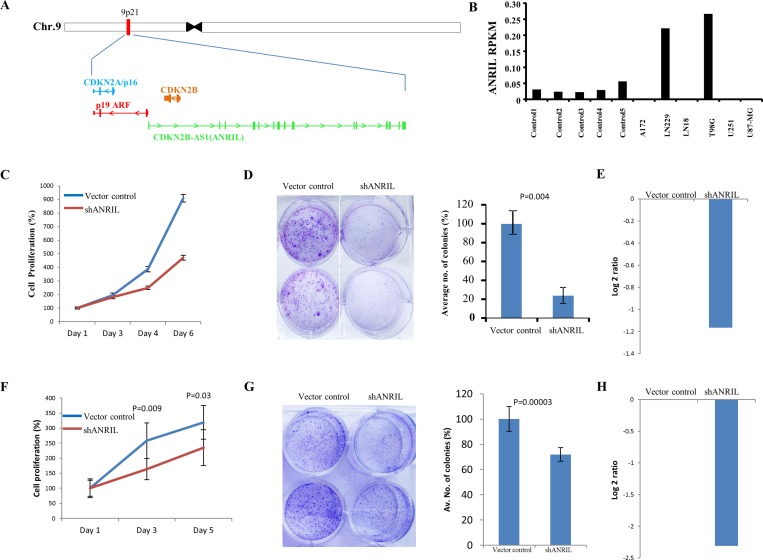
Figure 6. ANRIL is upregulated in GBM and its downregulation results in the inhibition of proliferation.
(A) A snapshot depicting the genomic location of ANRIL gene in the intronic anti-sense region of CDKN2B gene. (B) Column plot indicating the expression of ANRIL (log2 ratio) across different glioma cell lines compared to control brain tissue. (C) LN229 cells were transfected with vector control or shANRIL, plated for the proliferation assay and the relative proliferation was quantified by MTT assay. (D) LN229 cells were transfected with vector control or shANRIL. The cells were then plated in duplicates in a 6-well plate. After 2 weeks of plating, the colonies were stained with crystal violet, photographed (left) and counted (right). % colony density ± sd is plotted. (E) Log2 transformed levels of ANRIL transcript upon 48 hrs of shRNA knockdown in LN229 cell line. (F) T98G cells were transfected with vector control or shANRIL, plated for the proliferation assay and the relative proliferation was quantified by trypan blue assay. (G) T98G cells were transfected with vector control or shANRIL. The cells were then plated in duplicates in a 6-well plate. After 2 weeks of plating, the colonies were stained with crystal violet, photographed (left) and counted (right). % colony density ± sd is plotted. (H) Log2 transformed levels of ANRIL transcript upon 48 hrs of shRNA knockdown in T98G cell line.

