

Abstract
Programmed death-ligand 1 (PD-L1) is a well-known immune checkpoint protein that helps cancer cells evade immune response. Anti-PD-L1 immune therapy has been approved for the treatment of several advanced human cancers. Therefore, further understanding of the regulatory mechanisms of PD-L1 is critical to improve PD-L1-targeting immunotherapy. Recent studies indicated that contact-dependent pathways may regulate anticancer immunity, highlighting the importance of cell contact-induced signaling in cancer immunity. Here we show that tumor cell contact upregulates PD-L1 expression and reduces T cell-mediated cell killing through the membrane receptor tyrosine kinase ephrin receptor A10 (EphA10), which is not expressed in normal tissues except testis and is known to mediate cell contact-dependent juxtacrine signaling. Knockout of EphA10 in tumor cells increased T cell-mediated antitumor immunity in syngeneic mouse models. EphA10 expression also correlated positively with PD-L1 in human breast tumor tissues. Together our data reveal that in addition to paracrine/autocrine signaling, cell contact-mediated juxtacrine signaling also promotes PD-L1 expression, implying that tumor cells may escape immune surveillance via this mechanism and that targeting EphA10 to boost antitumor immunity may be a new immune checkpoint blockade strategy for female breast cancer patients.
Keywords: Cancer immunity, Juxtacrine signaling, Cell contact-dependent signaling, PD-L1 regulation, EphA10
Introduction
Tumor cells escape immune surveillance through the expression of multiple immune checkpoint inhibitory ligands on the cell surface that leads to cytotoxic T lymphocyte (CTL) dysfunction (1). One of the primary inhibitory ligands is PD-L1, which binds to receptor programmed cell death protein-1 (PD-1) on T cells to inhibit immune surveillance. Many cancer types evade antitumor immunity via PD-L1 expression (2). To date, several pro-inflammatory molecules or cytokines, such as EGF, INF-γ, TNF-α, VEGF, GM-CSF, and IL-10 secreted from tumor cells or tumor microenvironment, have been reported to induce PD-L1 expression on tumors through paracrine or autocrine signaling (3–5). Interestingly, cell contact-dependent juxtacrine signaling has been shown to support tumor-initiating cell (TIC) state, and PD-L1 is also expressed on TICs during the tumor initiation stage (6–8). However, it is largely unclear whether cell contact-dependent signaling regulates immune evasion of PD-L1-expressing tumor cells. Recent studies indicated that the Hippo pathway kinases, LATS1/2, which mediate contact-dependent growth inhibition, repress antitumor immunity (9), suggesting that contact-mediated signaling also regulates cancer immunity. Thus, furthering our understanding of the regulation of PD-L1 through contact-dependent mechanism on tumor cells may offer insights into cancer immunity and identify additional targets for cancer immunotherapy.
The erythropoietin-producing hepatocellular carcinoma (Eph) receptors belong to the largest family of receptor tyrosine kinases (RTKs) with 14 members, are involved in embryonic development and tissue organization, and implicated in various diseases, including cancer (10). Eph receptors interact with their membrane-bound ligands, ephrins, on neighboring cells to induce cell contact-dependent juxtacrine signals. Although the roles of Eph receptors have been explored in tumor progression and immune cell development (11,12), the relationship between their functions and cancer immunity is still unclear. Previous studies indicated that one of the Eph members, EphA10, which is only expressed in testis and many breast cancer tissues but not in other normal tissues, correlated with stage progression and lymph node metastasis in breast cancer and is a promising drug target (13). However, it is not clear how EphA10 blockade induces breast cancer regression. Here, we show that silencing EphA10 in breast cancer induces CTL activity and attenuates PD-L1 expression, unveiling a possible mechanism linking cell contact-mediated signaling to cancer immunity and a new potential target for cancer immunotherapy.
Materials and Methods
Cell lines and treatment
Most of cell lines used in this study were provided by American Type Culture Collection (ATCC), except SUM149, and regularly checked by STR DNA fingerprinting at MD Anderson Cancer Center and routinely examined for mycoplasma contamination. The cell lines obtained from ATCC were cultured in the medium recommended by ATCC. SUM149 was obtained from Asterand Bioscience. Recombinant ephrinA3 protein (Sino Biological Inc. #10188-H08H-100) treatment was carried out at a concentration of 0.5 μg/ml for the indicated times after serum-free starvation for 2 h.
Sphere culture
MDA-MB-231 expressing PD-L1 cells were cultured in ultra-low attached plate (Corning) under normal culture condition (DMEM, 10%FBS, 1% PS) without special supplement. In this condition, MDA-MB-231 cells formed spheres in a floating state within a few days (from 3 to 7 days). When the size of spheres reached a size suitable for observation, spheres were attached to the cover slip. With attachment, single cells were dissociated from the spheres. Two days after attachment, the samples were fixed with 4% PFA and applied to immunofluorescence staining.
Plasmids, siRNA, and knocking out constructs
The lentiviral-based shRNA (pGIPZ) which has the shRNA sequence targeting 3’UTR of human PD-L1 was used as the template. The original cDNA for GFP was replaced with cDNA for Flag-PD-L1. Using this pGIPZ-shPD-L1/Flag-PD-L1 dual expression construct, we established MDA-MB-231, BT-549 and Hep3B stable cell lines expressing Flag-PD-L1 with endogenous PD-L1 knockdown. Commercial siRNAs were used to knock down EphA2 (Sigma-Aldrich #1 SASI_Hs02_00337600 and #2 SASI_Hs01_00026514), and EphA4 (Sigma-Aldrich #1 SASI_Hs01_00085625 and #2 SASI_Hs01_00085626). Nonspecific siRNA control (Sigma-Aldrich, SIC001-10NMOL) was used as a control in the experiments. siRNAs were transfected into MDA-MB-231 cells using Electroporator (Nucleofector II; Amaxa Biosystems) according to the manufacturer’s instructions. To generate EphA10 knockout or control MDA-MB-231/4T1, three different regions of human EphA10 (NM_001099439.1) and mouse EphA10 (NM_001256432.1) were targeted using pLentiCRISPRv2 vectors, respectively. The targeting sequences are as follows;
Human EphA10-1: CAAAATCGACACGATCGCGG (533 to 555);
Human EphA10-2: AACACAGAGGTGCGCGAGAT (606 to 628);
Human EphA10-3: AGAAGGCACGGTCCGCTAGT (2874 to 2852);
Mouse EphA10-1: GGAAGTGGCTGGAACGTGCG (792 to 814);
Mouse EphA10-2: GCGAGTAGGTGACGTCGGAG (1213 to 1191);
Mouse EphA10-3: TCCAGGAACGTGCGTCGTGT (1952 to 1930).
Stable cells were selected with Puromycin (InvivoGen #ant-pr-1) for 4 weeks. Puromycin (0.5 μg/ml) was used to select for BT-549 and Hep3B stable cells, and puromycin (1 μg/ml) for MDA-MB-231 stable cells, and puromycin (1.5 μg/ml) for 4T1 stable cells.
Western blotting
Cells were harvested and lysed in the lysis buffer (1.25 M urea and 2.5 % SDS) after washing with PBS. Protein concentration measured by Pierce BCA Protein Assay (ThermoFisher #PI-23227). Immunoblotting was performed with primary antibodies against PD-L1 (1:1500; Cell Signaling Technology #13684), PCNA (1:1000; Santa Cruz #sc-56), β-actin (1:10,000; Sigma-Aldrich #A2228), EphA2 (1:1000; Cell Signaling Technology #6997), EphA4 (1:1000; ECM Biosciences #EM2801), EphA10 (1:500; R&D Systems #MAB5188), mouse EphA10 (1:500; ThermoFisher #PA5-20775), and mouse PD-L1 (1:1000; R&D Systems #MAB90781). Western blot detection was performed using chemiluminescent detection reagents (Bio-Rad #170-5061 or ThermoFisher #34075) and ImageQuant LAS 4010 (GE Healthcare).
Flow-cytometric analysis of PD-L1 expression
For analysis of PD-L1 expression on cell membrane, 5 × 10⁵ of cells were collected in Cell Staining Buffer (BioLegend #420201) and stained with APC-conjugated anti-human PD-L1 antibody (1:60 for 20 min; BioLegend #329707) by APC Mouse IgG2b (1:60 for 20 min; BioLegend #400319) as control staining. Stained cells were subjected to flow cytometric analysis using the BD FACSCanto II cytometer (BD Biosciences) and data processed by the FlowJo v10 software.
RNA extraction, reverse transcription, and qRT-PCR analysis
Cell lysates were harvested using the TRIzol Reagent (ThermoFisher #15596026), and total RNA isolated with the RNeasy Mini Kit (Qiagen #74104) according to the manufacturers’ protocols. cDNA was synthesized through the reverse transcription from purified RNA using SuperScript III First-Strand cDNA synthesis system (ThermoFisher #18080051) according to the manufacturer’s protocol. qRT-PCR was performed using the CFX96 Real-Time System (Bio-Rad). GAPDH was used as an internal control for mRNA expression. The data was analyzed by the 2-ΔΔCT method. Primer sequences (5´ to 3´) are shown below:
PD-L1-Forward: ACAGCTGAATTGGTCATCCC (cDNA amplicon size: 108 bp);
PD-L1-Reverse: TGTCAGTGCTACACCAAGGC
GAPDH-Forward: AAGGTGAAGGTCGGAGTCAA (cDNA amplicon size: 108 bp);
GAPDH-Reverse: AATGAAGGGGTCATTGATGG
Immunofluorescence
Under anesthesia, the tumor mass was isolated from mice after perfusion with 0.1 M PBS (pH 7.4) and embedded into OCT block and frozen for cryostat section. Cryostat sections (8-μm thick) were fixed with 4% paraformaldehyde (PFA) for 15 min at room temperature (RT). After PBS washing, cryostat sections were incubated in the blocking solution (PBS including 3% donkey serum, 1% BSA, 0.3% Triton X-100, pH 7.4) for 30 min at RT. For cell staining, cells on round cover glass were fixed in 4% PFA at RT for 15 min after PBS washing. Cells were permeabilized in 0.5% Triton X-100 for 10 min and then in the blocking solution for 30 min at RT. In antibody reaction buffer (PBS plus 1% BSA, 0.3% Triton X-100, pH 7.4), samples were stained with primary antibodies against active caspase 3 (1:300; Cell Signaling Technology #9661L), CD8 (1:100; BioRad #MCA609G), GranzymeB (1:500; R&D Systems #AF1865), PD-L1 (1:200; Cell Signaling Technology #13684), and phalloidin (ThermoFisher #A12379) overnight at 4 °C, followed by Alexa 350, 488, 546, and 647 (1:3,000, Life Technologies) secondary antibodies at RT for 1 hour. Hoechst 33342 (Life Technologies) was used for nuclear staining. The confocal microscope (Carl Zeiss, LSM700) were used for image analysis.
Duolink in situ proximity ligation assay (PLA)
PLA was carried out to investigate the proximity of epitopes recognized by the two anti-different epitopes of PD-L1 antibodies that represent the detection of PD-L1 in cancer cells using the Duolink® In Situ Red Starter kit (Sigma-Aldrich #DUO92101) according to the manufacturer’s instruction. Briefly, cells were fixed on the slide using 4% PFA and washed with PBS. After blocking, anti-PD-L1 (1:200; Cell Signaling Technology #13684) and anti-PD-L1 (1:200; LSBio #338364) antibodies were incubated with cells overnight at 4 °C. Subsequent ligations and detections were carried out in accordance with the manufacturer’s recommendations.
Human phospho-RTK antibody array
Proteome Profiler Human Phospho-RTK Array Kit (R&D Systems, ARY001B) was used to detect the potential activation of RTK signals by cultured condition in high cell density compared to low cell density. All procedures were performed according to the manufacturer’s instruction with minor modifications. Briefly, antibodies binding to specific RTKs from cell lysate were spotted in duplicate onto nitro cellulose membranes. Cell lysates (600 μg) were incubated with the membrane overnight at 4 °C. After washing, cell lysates containing Tyr phosphorylation of the captured RTKs were mixed with an HRP-conjugated pan phospho-tyrosine antibody. Finally, the binding signal was measured using chemiluminescent detection reagents and ImageQuant LAS 4010 (GE Healthcare).
Animal studies
All mice procedures were conducted under the guidelines and the institutional animal care protocol (00001334-RN01) approved by the Institutional Animal Care and Use Committee (IACUC) at The University of Texas MD Anderson Cancer Center. BALB/c and NOD SCID mice (6-week-old females) were purchased from Jackson Laboratories. Mouse 4T1 mammary tumor cells (5 × 10⁴) in 50 μl of medium mixed with 50 μl of matrigel basement membrane matrix (BD Biosciences #CB40230C) were injected into the mammary fat pad. Three days after inoculation, tumor size was measured as indicated in the figures, and tumor volume was calculated by using the formula: π/6 × length × width2. Mice with tumors greater than 1,500 mm3 were sacrificed.
Immunohistochemical staining
Human breast tumor tissue microarrays from 224 patients were obtained from Affiliated 9th People’s Hospital of Shanghai Jiaotong University in China. The collection of patient tissues was in accordance with the principles expressed in the Declaration of Helsinki and were approved by the Institutional Review Board at Affiliated 9th People’s Hospital of Shanghai Jiaotong University. Written informed consent was obtained from all patients at the time of enrollment. Immunohistochemical staining was performed using anti-PD-L1 (1:100 overnight; Abcam #ab205921) and anti-EphA10 (1:100 overnight; LSBio #LS-B10732) antibodies. Tissue specimens were incubated with primary antibody and biotin-conjugated secondary antibody, and then mixed with an avidin-biotin-peroxidase complex. Amino-ethylcarbazole chromogen was used for visualization. Protein expression was ranked according to Histoscore (H-score) method.
Statistical analysis
The means ± standard deviation (s.d.) were used in the numerical results. A two-tailed independent Student’s t-test was used to compare the continuous variables between the two groups. A Kaplan-Meier estimation and a log-rank test were used to compare the differences in overall survival period between two groups. The correlation between EphA10 and PD-L1 was analyzed using Pearson Chi-Square test by SPSS (Ver. 20). All statistical data of biological function assays was collected from at least two independent replicates and contained at least three technical replicates. The level of statistical significance was set at 0.05 for all tests.
Results
We investigated the possibility that cell contact-dependent signaling may be involved in PD-L1 regulation. To this end, we first examined the protein expression of PD-L1 in BT-549, MDA-MB-231, SUM149, Hs578t, and HCC1937 breast cancer cells with different cell density seeded on 10-cm plates for 48 hours. Notably, lysates harvested from cells seeded at higher density exhibited higher levels of PD-L1 expression compared with those at lower density (increased 3 to 5 folds compared with the lowest density in each cell lines; Fig. 1A). Analysis of PD-L1 expression by flow cytometry further confirmed that PD-L1 expression on the cell surface of cells cultured at higher density was higher than those at lower density (Fig. 1B). Next, we asked whether cell density transcriptionally or posttranslationally regulates PD-L1. We first examined PD-L1 RNA levels in cells cultured at high and low density for comparison by qRT-PCR. The results indicated no significant changes in PD-L1 RNA levels (Fig. 1C). In contrast, stable expression of Flag-tagged PD-L1 driven by cytomegalovirus (CMV) promoter in PD-L1-knockdown MDA-MB-231, BT-549, and Hep3B cells at high density increased the exogenous PD-L1 protein expression (Fig. 1D). These results suggested that PD-L1 expression induced by high cell density is not through transcriptional regulation.
Figure 1.
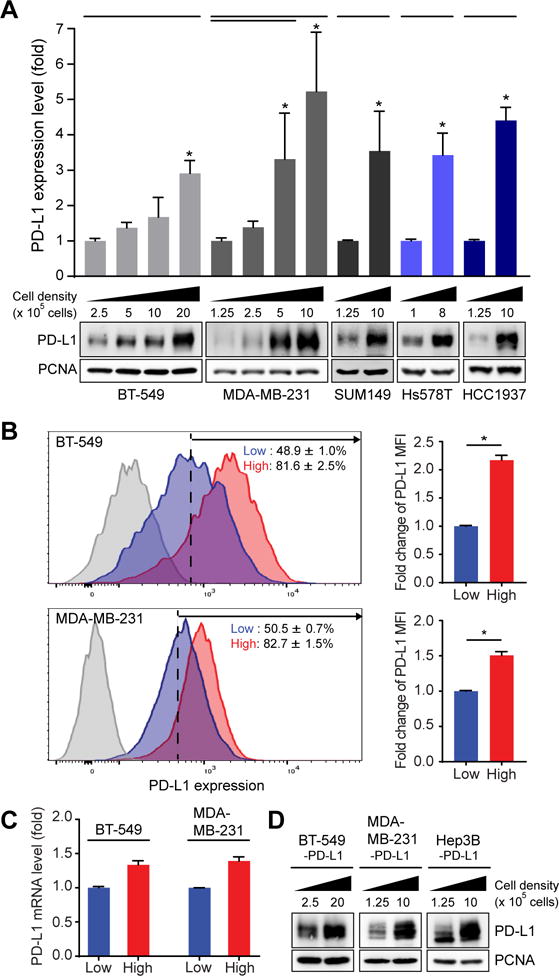
High cell density induces PD-L1 expression on the membrane of breast tumor cells through non-transcriptional regulation. (A) Top, quantitative data of Western blot of PD-L1 in BT-549, MDA-MB-231, SUM149, Hs578T and HCC1937 cell lines. Data represent mean ± S.D. n = 3. *P < 0.05 by Student’s t-test. Bottom, representative Western blots. Cells were incubated for 48 hours at low to high cell density (different cell number in 55 cm2). PCNA was used as a loading control. PD-L1 expression levels normalized to that of PCNA. (B) Top, membrane PD-L1 expression by flow cytometric analysis after BT-549 cells were incubated for 48 hours at low cell density (2.5 × 10⁵ cells in 55 cm2) compared to those at high cell density (2.0 × 10⁶ cells in 55 cm2), Bottom, MDA-MB-231 (bottom) were incubated for 48 hours at low cell density (1.25 × 10⁵ cells in 55 cm2) compared to those at high cell density (1.0 × 10⁶ cells in 55 cm2). Data represent mean ± S.D. n = 3. *P < 0.05 by Student’s t-test. (C) qRT-PCR of PD-L1 in MDA-MB-231 and BT-549 cell lines. Cells were incubated for 48 hours with high cell density (1.0 × 10⁶/55 cm2 for MDA-MB-231; 2.0 × 10⁶ cells/55 cm2 for BT-549) compared to low cell density (1.25 × 10⁵ cells/55 cm2 for MDA-MB-231; 2.5 × 10⁵ cells/55 cm2 for BT-549). (D) Western blot of PD-L1 in PD-L1-expressing MDA-MB-231, BT-549, and Hep3B stable cells. Cells were incubated for 48 hours at low to high cell density (different cell number in 55 cm2). PCNA was used as a loading control.
To demonstrate that cell-to-cell contact upregulates PD-L1 expression, we established an in vitro culturing method to observe the process of cell dissociation from sphere mass. After seeding spheres of PD-L1-expressing MDA-MB-231 cells on the coverslip under a standard culture condition for 2 days, we then performed immunofluorescence (IF) assay to detect PD-L1 level of cancer cells on the coverslip (Fig. 2A, diagram). Compared with cells in sphere mass, dissociated cancer cells without contact with the neighboring cells expressed less PD-L1 (inset a vs. b, Fig. 2A). To validate these findings quantitatively, we performed a Duo-Link Proximity Ligation Assay (PLA) using two antibodies that recognize different epitopes of PD-L1. The results also indicated higher PD-L1 expression in PD-L1-expressing MDA-MB-231 cells at high-density culturing condition compared with those at low-density (Fig. 2B). These findings further supported that tumor cell contact upregulate PD-L1 expression.
Figure 2.
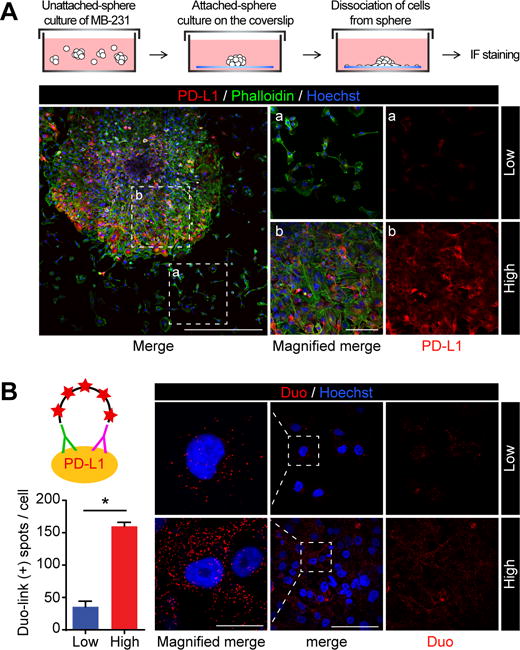
Breast tumor cell contact increases PD-L1 expression. (A) Immunofluorescence microscopy of PD-L1 expression levels in cells with or without cell contact. MDA-MB-231 expressing PD-L1 cells formed sphere under unattached culture condition. Spheres were stained with PD-L1 antibody and phalloidin solution. Red, PD-L1; Green, F-actin; blue, nuclei. Scale bars, 500 μm (left panel) and 100 μm (magnified panel a and b) (B) MDA-MB231 expressing PD-L1 cells were seeded at low (1.25 × 10⁵ cells in 55 cm2) or high density (1.0 × 10⁶ cells in 55 cm2) for 48 hours, and then incubated with two different PD-L1 antibodies following by detection using the DuoLink probe. Left, quantitation of proximity ligation assay (PLA). Three randomly selected fields were analyzed for each experiment. N = 3. Low density: 96 cells. High density: 504 cells. Data represent mean ± S.D. *P < 0.05 by Student’s t-test. Right, representative images of PLA. Scale bars, 100 μm and 20 μm (inset) The red dots indicate positive PLA signals.
Next, to identify the molecule(s) that may regulate PD-L1 expression by contact-dependent signaling, we compared the activity of receptor tyrosine kinases (RTKs) in BT-549 cells at high and low cell density by human phospho-RTK array. Activities were relatively higher for five RTKs, receptor tyrosine kinase like orphan receptor 2 (ROR2), neurotrophic receptor tyrosine kinase 3 (TrkC), Eph receptor A2 (EphA2), Eph receptor A4 (EphA4), and Eph receptor A10 (EphA10), at high cell density compared to low cell density (Fig. 3A). Interestingly, three of the RTKs, EphA2, EphA4, and EphA10, are known to mediate cell contact-dependent signaling by binding their ephrin ligands located on the membrane of nearby cells (12,14). To determine whether EphA receptors mediates PD-L1 expression, BT-549 and MDA-MB-231 cells treated with the ephrinA3 ligand, which binds to the EphA receptors (10), including EphA2, EphA4, and EphA10. BT-549 and MDA-MB-231 cells treated with ephrinA3 exhibited increased PD-L1 expression within 3 hours compared with the no treatment controls (Fig. 3B). These data implied that contact-induced PD-L1 expression in tumor cells may be mediated by EphA2, EphA4, or EphA10. To further determine which EphA receptor(s) mediates PD-L1 expression, EphA2, EphA4, or EphA10 were either knocked down by siRNA knockdown or knocked out by CRISPR-Cas9 in MDA-MB-231 cells. The reduction of PD-L1 only occurred in EphA10-knockout cells, but not in EphA2- or EphA4-knockdown cells (Fig. 3C and D, left). The results were further validated in the mouse 4T1 mammary tumor cells (Fig. 3D, right). These data suggested that EphA10 may mediate the contact-induced PD-L1 expression in tumor cells.
Figure 3.
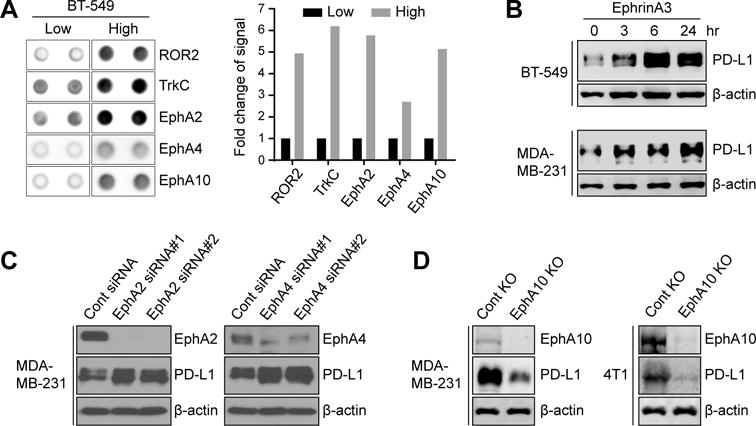
Juxtacrine signaling induces PD-L1 expression through EphA10. (A) Left, representative blot of significant changes of protein phosphorylation in RTKs array from BT-549 cells in low cell density (2.5 × 10⁵ cells in 55 cm2) compared to high cell density (2.0 × 10⁶ cells in 55 cm2). Right, quantification of protein phosphorylation changes in RTK array. (B) Western blot of PD-L1 in BT-549 and MDA-MB231 cells treated with or without 0.5 μg/ml ephrinA3 at different time points. β-actin was used as a loading control for Western blotting. (C) Left, control or EphA2 siRNA was transfected into MDA-MB-231 cells. Western blot showing PD-L1 and EphA2 in each transfectant. Right, control or EphA4 siRNA was transfected into MDA-MB-231 cells. Western blot showing PD-L1 and EphA4 in each transfectant. (D) Left, western blot of EphA10 knockout (KO-EphA10) or control (KO-ctrl) MDA-MB-231 cells with EphA10 or PD-L1 antibody. β-actin was used as a loading control for western blotting. Right, western blot of mouse PD-L1 (mPD-L1) and mouse EphA10 (mEphA10) in mouse EphA10-knocking out (4T1-KO-EphA10) and control (4T1-KO-ctrl) 4T1 stable cells. β-actin served as a loading control.
To test the possibility that EphA10 blockade may reduce PD-L1 expression and tumor growth by activating CD8+ CTL, a major effector of antitumor immunity which eliminates cancer cells by secreting granzyme B (GB) in tumor cells (15), we used EphA10-knocked out mouse 4T1 mammary tumor cells (4T1-KO-EphA10), which exhibited a reduction in PD-L1 expression compared with knockout controls (4T1-KO-ctrl; Fig. 3D, right) to establish an EphA10-knockout 4T1 mammary tumor mouse model by orthotropic injection in severe combined immune deficiency (SCID) mice and immunocompetent BALB/c mice and evaluated the tumor growth. Knocking out EphA10 significantly reduced the tumor growth (Fig. 4A, right) and increased the survival (Fig. 4B) of immunocompetent BALB/c mice but had no effects on the tumor growth in BALB/c SCID mice (Fig. 4A, left). We also analyzed the levels of PD-L1, cleaved caspase 3 (CCA3, an apoptotic marker), CD8+ CTL population and CTL activity using GB release as an indicator by staining tumor sections. The results showed that knocking out EphA10 in tumors derived from immunocompetent BALB/c mice significantly decreased PD-L1 expression levels (Fig. 4C, left) and increased the CD8+ CTL population, the amount of GB release, and the levels of CCA3 by 4.9 (± 0.8), 3.7 (± 0.6), and 4.8 (± 1.1) fold, respectively, compared with controls (Fig. 4C, right). These data suggested that EphA10 upregulates PD-L1 expression and blocking EphA10 can increase the population of CD8+ CTL with antitumor activities in tumor tissues. To recapitulate the above results in human cancer patients for future clinical application, we performed immunohistochemistry (IHC) staining of 224 human breast cancer specimens and identified a significant positive correlation with P value less than 0.0001 between EphA10 and PD-L1 expression (Fig. 4D).
Figure 4.
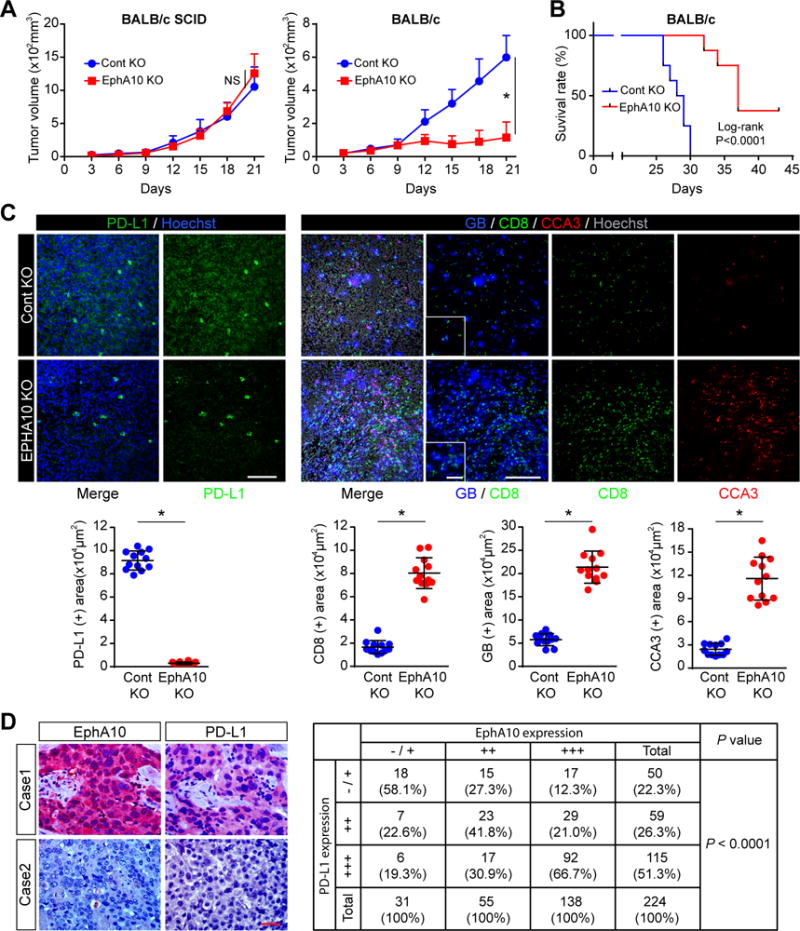
EphA10 deletion induces tumor regression through enhancing CTL-mediated antitumor immunity. (A) 4T1 EphA10-Knocking out (4T1-KO-EphA10) or control (4T1-KO-ctrl) cells (5 × 10⁴) were injected into BALB/c or BALB/c SCID mice (n = 8 mice per group). Tumor volume was measured on the indicated time points. Data represent mean ± S.D. *P < 0.05 by Student’s t-test. (B) Survival of mice bearing 4T1-KO-EphA10 or 4T1-KO-ctrl tumors. n = 8 mice per group, *P < 0.001 by log-rank test. (C) Top, representative immunostaining images of PD-L1, CD8 (CTL marker), granzyme B (GB, activity of T cell), and cleaved caspase 3 (CCA3, apoptotic marker) in 4T1-KO-EphA10 or 4T1-KO-ctrl tumor mass. Scale bar, 200 μm (inset, 50 μm). Hoechst was used for nuclear counter staining. Bottom, quantitation of PD-L1, CD8, GB, and CCA3 signals by Image J. Data represent mean ± S.D. n = 12. Three tissue slides per tumor, 4 mice per group. *P < 0.05 by Student’s t-test. (D) Left, representative IHC staining images of EphA10 and PD-L1 in breast cancer patients (n= 224). Right, statistical data showed that positive correlation between expression of EphA10 and PD-L1 in 224 surgical specimens of human breast cancer. The correlation between EphA10 and PD-L1 was analyzed using SPSS Pearson Chi-Square test (P < 0.0001). A P value of less than 0.05 was set as the criterion for statistical significance.
Discussion
Our current study uncovers a mechanism underlying PD-L1 regulation in which EphA10-mediated contact-dependent signaling increases its expression in breast cancer cells, linking the role of tumor cell contact to immune escape. It is not yet clear whether EphA10 may be multifunctional in anti-tumor immunity. However, at least the current report suggests that the reduction of PD-L1 by EphA10 KO may be one way to increase anti-tumor immunity.
Ephrin receptors signaling has been know to play important roles in both the immune system and cancer. Previous studies identified EphA 2 and 3 as a tumor-associated antigen (TAA) activating T cell (16,17) and the stimulation of EphB 1/2/3 receptors induced T cell activation (18). Furthermore, EphA2 signaling is known to promote T cell adhesion to vascular endothelial cells, thereby increasing T cell infiltration (19). In contrast to such ephrin receptors enhancing antitumor immunity, our result show that EphA10 contributes to suppress anti-tumor immunity. Because EphA10 doesn’t have its own kinase activity, it could inactivate other EphA/B-ephrin signaling through forming heterodimer or competing for ligands. Alternatively, it might suppress anti-tumor immunity though reverse signaling in receptor-bound immune cells (18). It is certainly worthy to further verify functions of Eph A10 in antitumor immunity in the future.
Specially, our analysis of tumor with IF (Fig. 4C, CD8+) show that much more CTLs infiltrated into EphA10 KO tumors than control tumors. The number of tumor infiltrating T cell (TIL) has correlation with efficacy of immunotherapy targeting PD-L1/PD-1 in the breast tumor. In the recent clinical trial for PD-L1 positive breast cancer patients, while immune check point blockage was very limited in hormone receptor (HR)+ breast cancer which has low number of TIL, triple negative breast cancer (TNBC) which has high number of TIL showed 18.5% response to pembrolizumab (anti-PD-1) and 19% response to atezolizumab (anti-PD-L1) respectively (20). These results suggested that in addition to PD-L1 expression, the levels of TIL also serve as another determinant to predict response to immunotherapy.
In this regard, the EphA10 blockade could effectively “kill two birds with one stone”. since EphA10 blockade can enhance not only CTL activity by blocking PD-L1/PD-1 inhibitory signaling but also infiltration of CTL into tumor tissue, EphA10 may have more potential as a new target for immunotherapy compared to PD-L1/PD-1 single targeting. Furthermore, EphA10 may be an ideal therapeutic target with less adverse effects in female breast cancer patients because its expression is specific in breast cancer but not in most of other normal tissues (except for male testis) (13). Therefore, it would be worthwhile to further elucidate the roles of EphA10 in cancer immunity to develop novel immunotherapies.”
Significance.
Regulation of PD-L1 expression by cell contact-mediated signaling promotes immune escape in breast cancer and may lead to the development of an immunotherapy with less adverse effects in female patients.
Acknowledgments
Grant Support
This work was funded in part by the following: National Institutes of Health grants, CCSG CA016672 (MD Anderson Cancer Center) and R01 CA211615 (to M.-C. Hung); Cancer Prevention & Research Institutes of Texas [Multi-Investigator Research Awards RP160710 and DP150052 (to M.-C. Hung)]; Breast Cancer Research Foundation (BCRF-17-069; to M.-C. Hung); National Breast Cancer Foundation, Inc. to M.-C. Hung); Patel Memorial Breast Cancer Endowment Fund to M.-C. Hung); The University of Texas MD Anderson-China Medical University and Hospital Sister Institution Fund (to M.-C. Hung); Center for Biological Pathways; Ministry of Health and Welfare, China Medical University Hospital Cancer Research Center of Excellence (MOHW107-TDU-B-212-112015; to M.-C. Hung); Ministry of Science and Technology Oversees Project for Post Graduate Research (MOST104-2917-I-564-003; to W.-H. Yang); The National Research Foundation of Korea grant for the Global Core Research Center funded by the Korean government (MSIP 2011-0030001; to J.-H. Cha); and the T32 Training Grant in Cancer Biology (5T32CA186892; to L.-C. Chan and H.-H. Lee).
Footnotes
Disclosure of Potential Conflicts of Interest
No potential conflicts of interest were disclosed.
References
- 1.Topalian SL, Drake CG, Pardoll DM. Immune checkpoint blockade: a common denominator approach to cancer therapy. Cancer Cell. 2015;27:450–61. doi: 10.1016/j.ccell.2015.03.001. [DOI] [PMC free article] [PubMed] [Google Scholar]
- 2.Chen L, Han X. Anti-PD-1/PD-L1 therapy of human cancer: past, present, and future. The Journal of clinical investigation. 2015;125:3384–91. doi: 10.1172/JCI80011. [DOI] [PMC free article] [PubMed] [Google Scholar]
- 3.Chakravarti N, Prieto VG. Predictive factors of activity of anti-programmed death-1/programmed death ligand-1 drugs: immunohistochemistry analysis. Transl Lung Cancer Res. 2015;4:743–51. doi: 10.3978/j.issn.2218-6751.2015.12.10. [DOI] [PMC free article] [PubMed] [Google Scholar]
- 4.Taube JM, Anders RA, Young GD, Xu H, Sharma R, McMiller TL, et al. Colocalization of inflammatory response with B7-h1 expression in human melanocytic lesions supports an adaptive resistance mechanism of immune escape. Sci Transl Med. 2012;4:127ra37. doi: 10.1126/scitranslmed.3003689. [DOI] [PMC free article] [PubMed] [Google Scholar]
- 5.Li CW, Lim SO, Xia W, Lee HH, Chan LC, Kuo CW, et al. Glycosylation and stabilization of programmed death ligand-1 suppresses T-cell activity. Nature communications. 2016;7:12632. doi: 10.1038/ncomms12632. [DOI] [PMC free article] [PubMed] [Google Scholar]
- 6.Lee Y, Shin JH, Longmire M, Wang H, Kohrt HE, Chang HY, et al. CD44+ Cells in Head and Neck Squamous Cell Carcinoma Suppress T-Cell-Mediated Immunity by Selective Constitutive and Inducible Expression of PD-L1. Clin Cancer Res. 2016;22:3571–81. doi: 10.1158/1078-0432.CCR-15-2665. [DOI] [PMC free article] [PubMed] [Google Scholar]
- 7.Yao Y, Tao R, Wang X, Wang Y, Mao Y, Zhou LF. B7-H1 is correlated with malignancy-grade gliomas but is not expressed exclusively on tumor stem-like cells. Neuro Oncol. 2009;11:757–66. doi: 10.1215/15228517-2009-014. [DOI] [PMC free article] [PubMed] [Google Scholar]
- 8.Lu H, Clauser KR, Tam WL, Frose J, Ye X, Eaton EN, et al. A breast cancer stem cell niche supported by juxtacrine signalling from monocytes and macrophages. Nat Cell Biol. 2014;16:1105–17. doi: 10.1038/ncb3041. [DOI] [PMC free article] [PubMed] [Google Scholar]
- 9.Moroishi T, Hayashi T, Pan WW, Fujita Y, Holt MV, Qin J, et al. The Hippo Pathway Kinases LATS1/2 Suppress Cancer Immunity. Cell. 2016;167:1525–39 e17. doi: 10.1016/j.cell.2016.11.005. [DOI] [PMC free article] [PubMed] [Google Scholar]
- 10.Barquilla A, Pasquale EB. Eph receptors and ephrins: therapeutic opportunities. Annu Rev Pharmacol Toxicol. 2015;55:465–87. doi: 10.1146/annurev-pharmtox-011112-140226. [DOI] [PMC free article] [PubMed] [Google Scholar]
- 11.Funk SD, Orr AW. Ephs and ephrins resurface in inflammation, immunity, and atherosclerosis. Pharmacol Res. 2013;67:42–52. doi: 10.1016/j.phrs.2012.10.008. [DOI] [PubMed] [Google Scholar]
- 12.Pasquale EB. Eph receptors and ephrins in cancer: bidirectional signalling and beyond. Nat Rev Cancer. 2010;10:165–80. doi: 10.1038/nrc2806. [DOI] [PMC free article] [PubMed] [Google Scholar]
- 13.Nagano K, Maeda Y, Kanasaki S, Watanabe T, Yamashita T, Inoue M, et al. Ephrin receptor A10 is a promising drug target potentially useful for breast cancers including triple negative breast cancers. Journal of controlled release: official journal of the Controlled Release Society. 2014;189:72–9. doi: 10.1016/j.jconrel.2014.06.010. [DOI] [PubMed] [Google Scholar]
- 14.Boyd AW, Bartlett PF, Lackmann M. Therapeutic targeting of EPH receptors and their ligands. Nat Rev Drug Discov. 2014;13:39–62. doi: 10.1038/nrd4175. [DOI] [PubMed] [Google Scholar]
- 15.Lim SO, Li CW, Xia W, Cha JH, Chan LC, Wu Y, et al. Deubiquitination and Stabilization of PD-L1 by CSN5. Cancer cell. 2016;30:925–39. doi: 10.1016/j.ccell.2016.10.010. [DOI] [PMC free article] [PubMed] [Google Scholar]
- 16.Chiari R, Hames G, Stroobant V, Texier C, Maillere B, Boon T, et al. Identification of a tumor-specific shared antigen derived from an Eph receptor and presented to CD4 T cells on HLA class II molecules. Cancer Res. 2000;60:4855–63. [PubMed] [Google Scholar]
- 17.Tatsumi T, Herrem CJ, Olson WC, Finke JH, Bukowski RM, Kinch MS, et al. Disease stage variation in CD4+ and CD8+ T-cell reactivity to the receptor tyrosine kinase EphA2 in patients with renal cell carcinoma. Cancer Res. 2003;63:4481–9. [PubMed] [Google Scholar]
- 18.Shiuan E, Chen J. Eph Receptor Tyrosine Kinases in Tumor Immunity. Cancer Res. 2016;76:6452–7. doi: 10.1158/0008-5472.CAN-16-1521. [DOI] [PMC free article] [PubMed] [Google Scholar]
- 19.Funk SD, Yurdagul A, Jr, Albert P, Traylor JG, Jr, Jin L, Chen J, et al. EphA2 activation promotes the endothelial cell inflammatory response: a potential role in atherosclerosis. Arteriosclerosis, thrombosis, and vascular biology. 2012;32:686–95. doi: 10.1161/ATVBAHA.111.242792. [DOI] [PMC free article] [PubMed] [Google Scholar]
- 20.Cohen IJ, Blasberg R. Impact of the Tumor Microenvironment on Tumor-Infiltrating Lymphocytes: Focus on Breast Cancer. Breast cancer: basic and clinical research. 2017;11:1178223417731565. doi: 10.1177/1178223417731565. [DOI] [PMC free article] [PubMed] [Google Scholar]