

Summary
Tuberculosis is an infectious disease caused by Mycobacterium tuberculosis. The cellular immune response to mycobacteria has been characterized extensively, but the antibody response remains underexplored. The present study aimed to examine whether host or bacterial phospholipids induce secretion of IgM, and specifically anti‐phospholipid IgM, antibodies by B cells and to identify the responsible B‐cell subset. Here we show that peritoneal B cells responded to lipid antigens by secreting IgM antibodies. Specifically, stimulation with M. tuberculosis H37Rv total lipids resulted in significant induction of total and anti‐phosphatidylcholine IgM. Similarly, IgM antibody production increased significantly with stimulation by whole Mycobacterium bovis bacillus Calmette–Guérin. The B‐1 subset was the dominant source of IgM antibodies after exposure to cardiolipin. Both CD5+ B‐1a and CD5− B‐1b cell subsets secreted total IgM antibodies after exposure to M. tuberculosis H37Rv total lipids in vitro. Overall, our results suggest that the poly‐reactive B‐1 cell repertoire contributes to non‐specific anti‐phospholipid IgM antibody secretion in response to M. tuberculosis lipids.
Keywords: activation, autoantibodies, B cells, bacterial, innate lymphoid cells
Abbreviations
- AI
acetone‐insoluble
- APC
allophycocyanin
- AS
acetone‐soluble
- ASC
antibody‐secreting cells
- BCG
Mycobacterium bovis Bacillus Calmette–Guérin
- CL
cardiolipin
- FITC
fluorescein isothiocyanate
- PE
phycoerythrin
- PerC
peritoneal cavity
- PleuC
pleural cavity
- PTC
phosphatidylcholine
- TB
tuberculosis
Introduction
According to the World Health Organization′s latest report,1 pulmonary tuberculosis (TB) is the leading cause of infection‐induced death worldwide. Mycobacterium tuberculosis most commonly infects the lungs and induces a massive cellular response leading to tissue damage and decreased respiratory function. Several challenges limit TB diagnosis, especially in resource‐constrained settings. Prompt diagnosis with simple, rapid and inexpensive tests is key to controlling and eliminating TB.2 Previous attempts to develop an antibody‐based test for TB diagnosis have failed,3, 4 and the WHO has not endorsed the use of these tests in high‐prevalence settings.5
Recently, we noted a decrease in anti‐phospholipid IgM antibody levels in M. tuberculosis‐infected mice following pyrazinamide and isoniazid therapy.6 The study revealed that anti‐phosphatidylcholine and anti‐cardiolipin IgM antibody levels decrease after anti‐TB therapy. Similarly, a previous report showed a decrease in anti‐phosphatidylcholine, anti‐cardiolipin, anti‐phosphatidylinositol and anti‐phosphatidylethanolamine IgM after 2 months of intense phase anti‐TB therapy in patients with non‐cavitary TB.7 Moreover, Elkayam et al. reported a significant decrease in anti‐cardiolipin IgM and other autoantibodies after 6 months of treatment.8 A better understanding of the B‐cell subsets contributing to this IgM pool and the regulation mechanisms involved in IgM secretion during TB infection and disease progression should be of relevance. Such an approach will support the development of novel TB diagnostics that measure the induction of IgM against phospholipids.
Anti‐phospholipid IgM antibodies are present in mice without TB infection, as part of the ‘natural’ antibody repertoire. Natural antibodies are secreted mainly by B‐1 cells, and by B‐1‐derived plasma cells. B‐1 cells also secrete antibodies in response to bacteria‐associated antigens through T‐cell‐independent mechanisms.9 B‐1 cell activation is regulated by autocrine secretion of interleukin‐10, whereas B‐1 cell proliferation was shown to be induced by interleukin‐12, interleukin‐5 and interferon‐γ, as well as pathogen‐associated molecules such as phospholipids.10 A study by Russo and Mariano also suggested that B‐1 cells migrate from the peritoneal cavity to the lungs as part of the protective response of mice chronically infected with Mycobacterium bovis bacillus Calmette–Guérin (M. bovis BCG).11
Mycobacterium sp. have a thick cell wall with a high lipid content. These lipids are released during infection and modulate the host immune response by regulating the secretion of pro‐ and anti‐inflammatory cytokines.12 Whether M. tuberculosis lipids activate B‐1 cells and provide the signals necessary for anti‐phospholipid IgM secretion remains unclear. Previous studies have shown that the B‐1 cell clonotype TEPC15 (T15) recognizes phosphatidylcholine (PTC) as a minimal motif prominently expressed on oxidized, but not native, phospholipids, such as oxidized low‐density lipoprotein.13 Such oxidized phospholipid antigens can be released during cell death, including death by apoptosis. As phospholipids contain common structural and chemical components, we hypothesized that phospholipids derived from M. tuberculosis may play a role in the activation of peritoneal B cells and the secretion of IgM.
Recent evidence suggests that B‐1 cells are also capable of influencing the typical assembly of granuloma lesions in BCG‐infected lungs and of inducing host resistance to mycobacteria.11 These findings suggest that B‐1 cells may play a protective role during chronic M. bovis infection. However, the regulation of B‐1 cell IgM antibody production by either host or M. tuberculosis lipid antigens remains largely unexplained. The aim of the present study was to assess the ability of B‐cell subsets to secrete IgM in response to M. tuberculosis and host lipids.
Materials and methods
Animals
Groups of 8‐ to 12‐week‐old C57BL/6 mice were used for the study. They were maintained at the Institute of Scientific Research and High Technology Services (INDICASAT‐AIP). Other experiments were performed with mice obtained from the Center for Comparative Medicine. Animal care and handling were conducted in accordance with Institutional Guidelines and the Animal Welfare Committee of the University of California, Davis, CA and INDICASAT‐AIP (approval letter No. CICUA‐17‐001).
Pleural and peritoneal cell extraction
A pool consisting of total pleural cavity (PleuC) and peritoneal cavity (PerC) cells was obtained according to previously described protocols14 in order to obtain maximum B‐1 cell numbers. For the PerC lavage, we flushed the peritoneal cavity with 10 ml of KDS‐BSS staining medium (KH‐BSS potassium‐HEPES buffered salt solution supplemented with 10% Newborn Calf Serum and 0·05 mm EDTA) and collected the KDS‐BSS. For the PleuC lavage, we punctured the right side of the pleural membrane, then added 0·5 ml of KDS‐BSS and aspirated the fluid that contained the cells. We flushed out the cavity twice to recover the cells. Both cell suspensions were counted using a haemocytometer; dead cells were excluded by Trypan blue staining.
B‐cell subtype identification by flow cytometry
Peritoneal and pleural cells were resuspended in KDS‐BSS staining medium and blocked with anti‐CD16/32. An antibody cocktail consisting of Pacific‐Blue‐conjugated antibodies was used to stain non‐B cells (‘Dump’). The antibodies were generated in‐house unless otherwise indicated and included the following: anti‐CD90.2, anti‐CD4 (GK1.5), anti‐CD8a (53‐6.7), anti‐Gr‐1 (RB6‐8c5), anti‐F4/80 (F4/80), anti‐NK1.1 (PK136) and CD49b (DX‐5; BioLegend, San Diego, CA). The antibody panel used to identify B‐1 and B‐2 cells included anti‐CD19‐Cy5‐phycoerythrin (PE) (1D3), anti‐IgM‐Cy7‐allophycocyanin (APC) or anti‐IgM‐APC (331), anti‐CD43‐PE (S7) and anti‐CD23‐fluorescein isothiocyanate (FITC) (B3B4.2). For a purity check following cell separation, B‐1 and B‐2 cells were stained with anti‐CD19‐BV786 anti‐IgM‐Cy7APC (331), anti‐CD5‐FITC, anti‐CD23‐APC and Streptavidin‐Qdot 605. A live–dead stain (Thermo Fischer L34955, Rockford, IL) was used to exclude non‐viable cells. Cells were analysed using a FACS Aria flow cytometer (BD Bioscience, San Jose, CA). We used different antibody cocktails based on surface expression markers to delineate the B‐cell subgroups. B‐1 cell frequencies were determined by gating on CD19high IgM+ IgDlow/neg CD23neg CD43+ cells. Data were analysed using flowjo software. The proliferation platform of flowjo was used to assess B‐cell proliferation. The Division Index is the average number of cell divisions of all cells in a culture.
Magnetic B‐cell enrichment from PleuC and PerC
B‐cell suspensions from the lavage of pleural and peritoneal body cavities were enriched by negative selection with a Mouse B isolation kit (R&D Systems, Inc., Minneapolis, MN; catalogue no.MAGM204, or Stem Cell Technologies, Vancouver, BC, Canada, catalogue no. 19860) according to the manufacturer's instructions. B‐2 cells were excluded using an anti‐CD23‐biotin antibody. Total B cells and the B‐1 population were analysed by FACS to confirm purity.
Magnetic B‐cell enrichment by automated‐cell separator
The biotinylated antibody cocktail described above was added to PerC cell suspensions to exclude the ‘dump population’. The cocktail also included anti‐CD23‐biotin to exclude conventional (B‐2) cells and enrich B‐1. To obtain B‐2 cells from spleen, we added an anti‐CD43‐biotin antibody followed by incubation with anti‐biotin MicroBeads (Miltenyi Biotech, Bergisch Gladbach, Germany) according to the manufacturer′s instructions. Washed cells were passed over the column of an autoMACS separator (Miltenyi Biotech) as described previously.15 The purity of the recovered B cells reached at least 90%, as determined by FACS.
B‐cell sorting
Cells from the pleural and peritoneal cavities were blocked using anti‐CD16/32 (2.4G2) followed by the addition of anti‐CD19–Cy5PE (1D3), CD90.2–Pacific blue, IgM–APC (331), IgD–Cy7PE,11, 12, 13, 14, 15, 16, 17, 18, 19, 20, 21, 22, 23, 24, 25 CD43–PE (S7), CD5–biotin (53–7.8) and Streptavidin–Qdot 605 (Life Technologies, Grand Island, NY). After staining, the cells were washed with KDS‐BSS staining medium followed by addition of live/dead violet staining (Invitrogen, Carlsbad, CA). B‐cell subsets were sorted and collected in sterile 10% fetal calf serum solution in KDS‐BSS by a FACS Aria (BD Bioscience).
Mycobacterium bovis BCG culture
We used M. bovis BCG vaccine strain SSI (Statens Serum Institute, Copenhagen, Denmark) to assess in vitro B‐cell exposure to bacteria. Mycobacterial growth was established according to a previously established protocol.16 For the M. bovis BCG inoculum, the Mycobacterium suspension was prepared to a final concentration of 8·0 × 103 mycobacteria/μl.
B‐cell stimulation assay
Total PerC lavage, B cells, or B‐1 cell suspensions at a concentration of 1 × 10⁶ or 2 × 10⁵ were cultured with or without 10 μg/ml of bovine heart cardiolipin (CL) or PTC, lipids extracted from M. tuberculosis H37Rv or a BCG bacteria suspension and incubated at 37° in 5% CO2.17 Supernatants were harvested after 1, 4 or 7 days of culture. Total IgM and anti‐phospholipid IgM secretion was determined by ELISA.7
Elispot
After 3 days of incubation with CL or PTC, total IgM antibody‐secreting cells (ASCs) were enumerated by ELISPOT as previously described.18 Spot counting was performed with an ELISPOT reader with two fluorescent filters, FITC and Cy3 (Autimmun Diagnostika GmbH Strassberg, Germany). The ASCs were expressed as the mean number of spots present in wells with countable spot numbers.
Anti‐phospholipid IgM and total IgM ELISA
To measure anti‐phospholipid IgM the ELISA was adapted from a previous report.7 A kit was used to quantify total mouse IgM (Mouse IgM Ready‐SET‐Go!® eBioscience, SanDiego, CA) following the protocol given by the manufacturer.
B‐1 cell proliferation assay
PerC B‐1 cells enriched via AutoMACS were used in a proliferation assay using a protocol modified from Nguyen et al.19 Briefly, B‐1 cells at a concentration of 107 cells/ml were labelled with efluor 670 dye. After the efluor incubation, the cells were cultured for 3 days with or without 10 μg/ml of M. tuberculosis lipids in a 5% CO2 environment. Viability stain was added and purity evaluation was performed with the following antibody cocktail: anti‐CD19‐BV786, anti‐IgM‐Cy7APC (331), anti‐CD5–FITC, anti‐CD23‐APC and streptavidin–Qdot 605. FACS analysis was used to determine the number of cell divisions after lipid stimulation.
B‐1 cell and B‐1 subset differentiation assay
PerC B‐1 cells were enriched using FACS Aria, and CD138 flow cytometry assessment was performed according to a previously described protocol.15 Briefly, B‐1 cells were stained as outlined above and B‐1a and B‐1b cells were sorted on a FACSAria into the following groups: Live, Dump−, CD19+, IgM+, IgDlow/negative, CD23− and CD5+ or CD5−. Cells were plated at 1 × 10⁵ cells/well with or without M. tuberculosis H37Rv total lipid extract (20 µg/ml) and cultured for 3 days. Cells were re‐stained using the following panel: Live, Dump−, CD19+, IgM+, IgDlow/negative, CD23−, CD5+ and CD138+, and analysed on an LSR Fortessa (BD), or plated for ELISPOT assay. Culture supernatants were assessed for IgM using ELISA.
Statistical analysis
graphpad prism software (version 6·0) was used to analyse the data. One‐way or two‐way analysis of variance followed by Bonferroni's test was used for multiple comparisons between experimental groups. Changes in IgM antibody levels were considered statistically significant at *P < 0·01, **P < 0·001 and ***P < 0·0001. The unpaired Student's t‐test was used for statistical analyses when comparing non‐stimulated and stimulated cells. The significant results are shown as *P < 0·05.
Results
Peritoneal cavity cells respond to cardiolipin and phosphatidylcholine
The secretion of IgM antibodies by B‐1 cells in response to antigens and pathogens other than M. tuberculosis has been detected in mice previously.20 In order to determine the role of PerC B‐1 cells in the anti‐phospholipid IgM antibody response, we stimulated total PerC cells with CL or PTC (both isolated from bovine heart) and measured the levels of anti‐CL and anti‐PTC IgM antibodies after 1, 4 and 7 days of treatment (Fig. 1). We observed significantly higher levels of anti‐CL IgM on day 7 of culture when PerC cells were stimulated with CL and PTC compared with controls (Fig. 1a and d). In contrast, although we observed significantly higher levels of specific anti‐PTC IgM after 4 and 7 days of PTC stimulation (Fig. 1b) we did not find differences in the levels of non‐specific or cross‐reactive anti‐PTC antibodies in response to CL (Fig. 1c). These results indicate that total PerC cells produced specific anti‐phospholipid IgM antibodies in response to lipid antigens and suggested that in our experimental model, PTC stimulates anti‐phospholipid IgM secretion more efficiently than CL.
Figure 1.
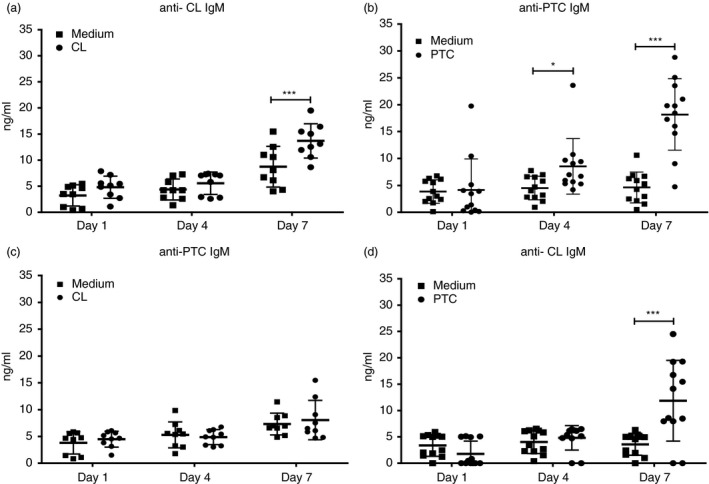
Peritoneal cavity (PerC) cells respond to bovine heart phospholipid antigens. Total PerC cells from C57BL/6 mice were plated at 1 × 10⁶ cells per well and then cultured with or without 10 µg/ml of cardiolipin (CL) or phosphatidylcholine (PTC) isolated from bovine heart. The graph shows specific anti‐CL and anti‐PTC IgM antibodies secreted after stimulation with CL and PTC, respectively (a, b); and the cross‐reactive anti‐PTC and anti‐CL IgM antibodies secreted after stimulation with CL and PTC respectively (c, d). Antibody levels were measured after 1, 4 and 7 days of stimulation by in‐house ELISA. Results are shown as means ± SD of two independent experiments (n = 9). Significance was determined at *P < 0·01 and ***P < 0·0001 compared with non‐stimulated cells.
B cells from peritoneal cavity secrete IgM antibodies in response to M. tuberculosis H37Rv lipids and M. bovis BCG
To determine the capacity of B cells to produce IgM antibodies in response to mycobacterial lipids, we measured IgM levels in cultures of purified PerC B cells stimulated with M. tuberculosis H37Rv total lipid fraction, acetone‐soluble (AS) or acetone‐insoluble (AI) lipid fractions. The M. tuberculosis H37Rv total lipids activated the secretion of total IgM antibody in cultures of B cells stimulated with this lipid fraction; total IgM antibody levels were significantly higher for stimulated B cells compared with those of non‐stimulated controls (8·0 ng/ml versus 471·6 ng/ml, P = <0·0001) (Fig. 2a). B cells stimulated with the M. tuberculosis H37Rv AS or AI lipid fractions produced significantly higher levels of anti‐CL IgM antibodies compared with non‐stimulated control cells (25·0 ng/ml and 23·9 ng/ml versus. 8·2 ng/ml, both at P < 0·05) (Fig. 2b). Finally, significantly higher levels of anti‐PTC IgM antibodies were also secreted in response to M. tuberculosis H37Rv total lipids, the AS lipid fraction, and the AI lipid fraction stimuli when compared with non‐exposed controls (25·5 ng/ml, P < 0·005; 25·0 ng/ml P < 0·0005; 23·9 ng/ml, P < 0·005; 23·4 ng/ml, P < 0·005; respectively) (Fig. 2c).
Figure 2.
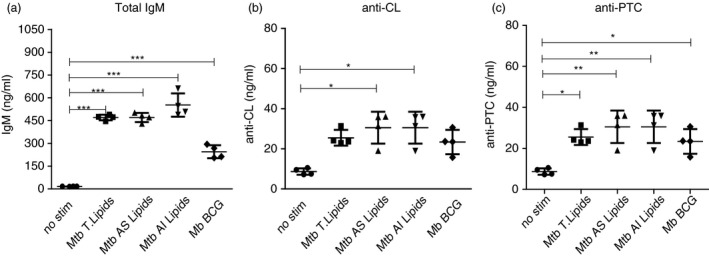
B cells from the peritoneal cavity secrete IgM antibodies against Mycobacterium lipids. B cells from the peritoneal cavity (PerC) of C57BL/6 mice were collected and cultured with or without 20 µg/ml of total cell wall lipids, acetone‐soluble (AS) and acetone‐insoluble (AI) lipid fractions from Mycobacterium tuberculosis H37Rv cell wall, as well as whole bacilli Mycobacterium bovis bacillus Calmette–Guérin (BCG) at a ratio of 25 : 1 (M. bovis BCG : B cell). The supernatants were harvested after 4 days of stimulation and total IgM (a), anti‐cardiolipin (CL) IgM (b), and anti‐ phosphatidylcholine (PTC) IgM (c) antibodies were measured by an in‐house ELISA. Results are shown as means ± SD (n = 6). *P < 0·01, **P < 0·001 and ***P < 0·0001 compared with non‐stimulated controls.
To further demonstrate the ability of PerC B cells to secrete IgM antibodies in response to whole live bacteria, we exposed the cells to M. bovis BCG at a ratio of 25 : 1 (25 bacteria to one B cell).21 We noted a significant increase in total IgM in response to M. bovis BCG stimulation (8·0 ng/ml versus 245·0 ng/ml, P = 0·003) (Fig. 2a). Moreover, we found significantly higher anti‐PTC IgM levels in cultures with bacteria compared with non‐exposed controls (30·6 ng/ml versus 8·7 ng/ml, P = 0·009) (Fig. 2c). The results demonstrate that B cells from PerC secrete IgM antibodies in response to a complex mixture of lipid antigens derived from M. tuberculosis H37Rv and to whole live M. bovis BCG.
Peritoneal cavity B‐1 cells respond more strongly to phospholipid stimulation than B‐2 cells
B‐1 cells play a role in the host immune response as natural antibody producers.22 It is well known that B‐1 cells respond to innate antigen signals, including pathogen‐associated molecules such as lipopolysaccharide.23, 24 Our previous results showed that PerC B cells are involved in IgM antibody secretion in response to phospholipid antigens. Therefore, we decided to determine which B‐cell subset contributed to IgM secretion (total, anti‐CL and anti‐PTC) after phospholipid stimulation.
To make this determination, cells were stained and live, ‘non‐dump’ CD19+ IgM+ B cells were separated into B‐1 (CD23− CD43+) and B‐2 (CD23+ CD43−) cells by FACS, as outlined in Fig. 3(a). Purified cells were cultured with or without CL or PTC, and IgM ASCs were enumerated by ELISPOT 3 days after culture onset. The results showed that a higher frequency of stimulation‐induced IgM production was present among B‐1 cells compared with B‐2 cells (Fig. 3b and c). Stimulation with PTC did not induce significant increases in IgM ASC of either subset.
Figure 3.
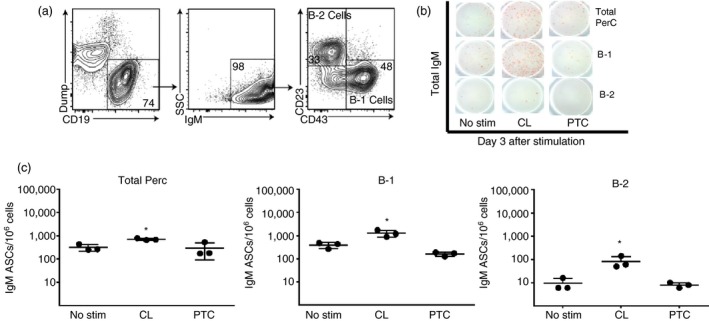
B‐1 but not B‐2 cells respond to cardiolipin (CL) and phosphatidylcholine (PTC). (a) B‐1 and B‐2 cells from the peritoneal cavity (PerC) of C57BL/6 mice were isolated by FACS. B‐1 cells were identified as CD19high Dumpneg IgM+ IgDlow/neg CD23− CD43+. (b, c) Total PerC and the separated B‐1 and B‐2 cells were stimulated with 10 µg/ml of CL or PTC. After 3 days of stimulation, total IgM antibody‐secreting cells (ASCs) were enumerated by ELISPOT. The dot graphs show the results as means ± SD from one representative experiment. Asterisks indicate that results were considered statistically significant different from non‐stimulated control at P < 0·05.
Notably, B‐2 IgM ASCs showed a non‐significant response after stimulation with CL, whereas B‐1 cells responded strongly (1·26 × 103 ± 374 spots, Fig. 3c). In addition to ASC frequency changes, stimulation with CL and PTC increased the average ELISPOT size, suggesting increased production of IgM per B‐1 cell compared with non‐stimulated cultures (data not shown). The above findings corroborate previous results indicating that B‐1 cells secrete IgM antibodies in response to various phospholipid stimuli.
Proliferation of pleural and peritoneal B‐1 cells after M. tuberculosis H37Rv lipid stimulation
Lipopolysaccharide‐activated B‐1 cells are known to proliferate strongly before differentiation into ASCs.23 Among B‐2 cells, the response is strongest from marginal zone B cells.25 To further test whether M. tuberculosis H37Rv lipids could directly stimulate B‐1 cells to proliferate and differentiate into ASC, we performed proliferation assays. B‐1 cells were purified from PerC cells by magnetic separation and stained with e‐fluor‐APC. Loss of dye indicates B‐cell proliferation. The data show that M. tuberculosis H37Rv lipid stimulation induced a small but significant increase in B‐1 cell proliferation compared with cultures without stimulation, with significant increases in the number of cells that divided and the average number of divisions that these cells underwent (Fig. 4a and b). Together, our results suggest that B‐1 cells undergo significant minimal proliferation in response to M. tuberculosis H37Rv lipid stimulation.
Figure 4.
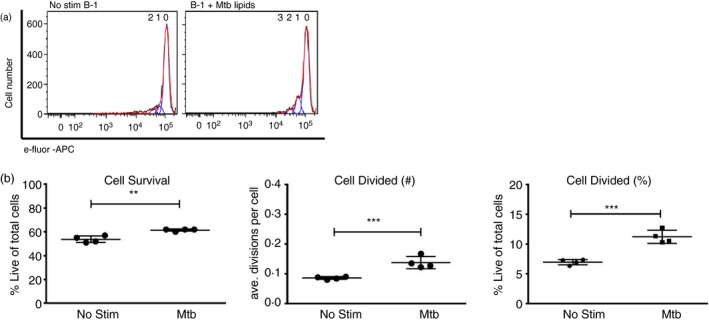
B‐1 proliferation in response to stimulation with Mycobacterium tuberculosis total lipids. Peritoneal cavity cells from C57BL/6 mice were collected and B‐1 cells enriched by magnetic cell separation and labelled with e‐Fluor dye. Cells were cultured with or without 20 µg/ml of total M. tuberculosis lipid extract for 3 days and cell proliferation rates were determined by flow cytometry. Histograms demonstrate loss of e‐fluor staining, indicative of proliferation (a). Survival rates of stimulated cells (b, left plot). Average number of divisions per cell expressed as division index (b, middle plot). Mean frequencies ± SD of B‐1 cells that did divide (b, right plot). Results are representative of two experiments with similar results. Significance was determined as **P < 0·001 and ***P < 0·0001 compared with non‐stimulated cells.
B‐1 cells and their B‐1a subset strongly respond to M. tuberculosis H37Rv total lipids
To characterize the differentiation into ASCs, we isolated B‐1 cells from PerC by negative enrichment, using autoMACS, and then evaluated the expression of the CD138 surface marker as well as IgM secretion after stimulation with M. tuberculosis H37Rv total lipids. We observed a significantly higher proportion of CD138‐positive B‐1 plasma cells after stimulation with M. tuberculosis H37Rv lipids (average of 8·7% and 11%, respectively, P = 0·001; Fig. 5a). Importantly, we also found increases in B‐1 cell IgM ASCs after stimulation with M. tuberculosis H37Rv total lipids, whereas B‐2 showed no significant increases (Fig. 5b, left panel). This was consistent with the concentrations of IgM detected in the supernatants of these cultures, with B‐1 cell cultures having significantly higher IgM concentrations than B‐2 cells (62·6 ng/ml versus 7·3 ng/ml, respectively, P = 0·0006) (Fig. 5b, right panel) in response to M. tuberculosis H37Rv total lipid stimulation. Taken together, all the above results indicate that B‐1 cells produce IgM antibodies not only in response to phospholipid stimuli but also in response to M. tuberculosis total lipids.
Figure 5.
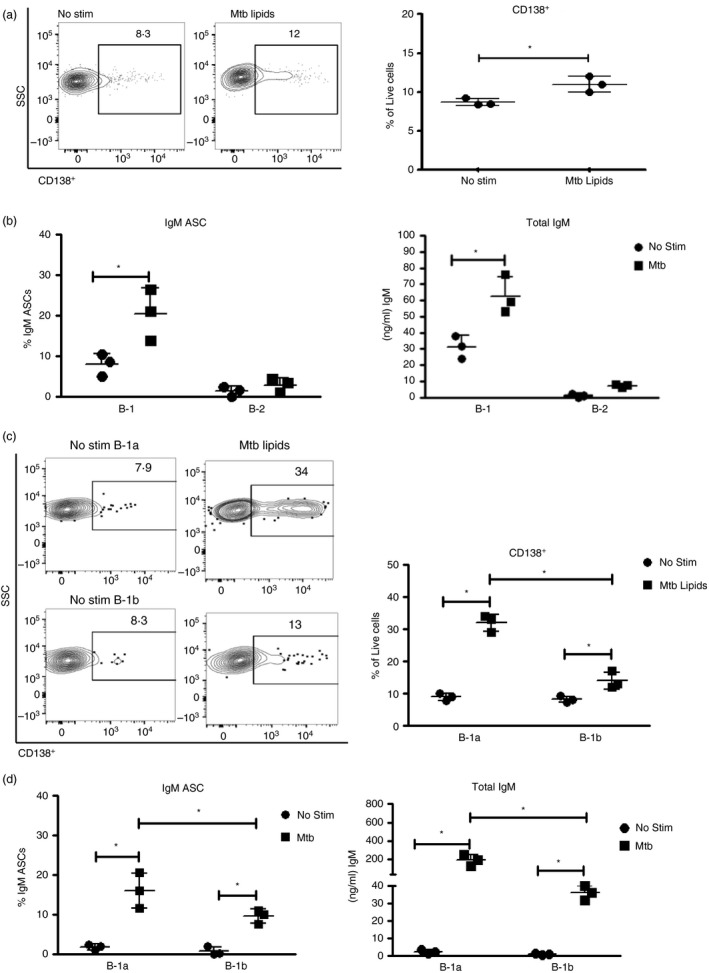
B‐1a and B‐1b cells differentiate in response to Mycobacterium tuberculosis H37Rv total lipids to IgM‐secreting plasma cells. (a–d) Magnetic bead‐enriched B‐1 cells from peritoneal cavity (PerC) and pleural cavity (PleuC) were cultured with or without 20 μg/ml of M. tuberculosis lipids. The percentage of cell division cycles was determined by flow cytometry analysis. The proportion B‐1 cell differentiation was determined by the expression of CD138 (a). Proportion of B‐1 or B‐2 IgM antibody‐secreting cells (ASCs) and total IgM secretion after stimulation with M. tuberculosis H37Rv total lipid extract (b). IgM ASCs were enumerated by ELISPOT after overnight culture. FACS contour plot with outliers showing CD138 expression among B‐1a and B‐1b cells before and after stimulation with M. tuberculosis H37Rv total lipid extract. Right plot indicates the mean ± SD of all cultures (c). Mean ± SD of B‐1a and B‐1b IgM secreters as assessed by ELISPOT (left) and mean ± SD IgM in supernatants of cultures with or without stimulation with M. tuberculosis H37Rv total lipid extract (d). Results were considered statistically significant at *P < 0·05. Results are one representative of two independent experiments that gave similar results.
To determine further which subset of B‐1 cells is responsive to M. tuberculosis H37Rv lipids, we performed FACS‐purification of B‐1a and B‐1b and then stimulated the cells with M. tuberculosis H37Rv total lipid extract for 3 days. FACS contour plots showed a higher proportion of B‐1a cells differentiated to express the plasma cell marker CD138+ compared with B‐1b cells (32·0% and 14·0%, respectively, P = 0·0005; Fig.5c). Consistent with these changes, the addition of lipid extract increased the proportion of B‐1a IgM ASCs to a larger extent than that of B‐1b (16·0% and 9·6%, respectively, P = 0·04; Fig. 5d, left panel). The concentrations of IgM in the supernatants of B‐1a cultures were about fivefold higher compared with those of the B‐1b cultures (190·8 ng/ml and 35·0 ng/ml, P = 0·007; Fig. 5d right panel). Hence, both B‐1a and B‐1b cells responded to M. tuberculosis lipids with increased IgM secretion; however, B‐1a seemed to respond more strongly. Overall, the data indicate a higher differentiation rate of B‐1a cells into total IgM‐secreting plasma cells after stimulation with M. tuberculosis H37Rv lipids.
Discussion
This study aimed to evaluate the role of B‐cell subsets in the humoral immune response to mammalian and mycobacterial phospholipids. We demonstrate that B‐1 cell subsets, mainly B‐1a, are major responders to in vitro stimulation with various phospholipids, including those from Mycobacterium. The stimulation led to only weak proliferation of purified B‐1 cells, but strong and rapid differentiation of those cells into CD138+ IgM‐secreting plasma cells.
B‐1 cell activation and the subsequent production of IgM antibody in response to foreign antigens or pathogens are essential to the innate host defence. There is increasing evidence that B‐1 cells secrete antibodies naturally and in response to infection‐induced processes.26 B‐1 cells have the capacity to recognize self‐antigens and microbial antigens; this may be due to cross‐reactivity between self and foreign antigens. Our results show both specific and cross‐reactive IgM responses to phospholipids. We observed that PerC cells produced anti‐CL and anti‐PTC IgM in response to stimulation with CL and PTC, respectively, but these cells also secreted anti‐CL IgM in response to PTC stimulation. Our findings suggest that IgM antibodies secreted by PerC B cells exhibit cross‐reactivity between PTC and CL. A study on human haemolytic anaemia has described similar cross‐reactivity between CL‐binding and PTC‐binding antibodies.27 These authors proposed that the polar head present in all lipid structures is the region recognized by IgM antibodies. We believe that the B‐1 ASCs are secreting non‐specific polyreactive antibodies rather than specific antibodies to PTC and CL. What stimulates the B‐1 cells to secrete polyreactive natural antibodies during M. tuberculosis infection in the susceptible host remains unknown.
To stimulate B cells with mycobacterial lipids, we used the total lipid mixture extract from M. tuberculosis H37Rv, as well as the AI and AS fractions provided by BEI Resources. The lipid content of these fractions has been described elsewhere.28 The AI lipid fraction was noted to be rich in glycolipids and phospholipids, which are associated with the M. tuberculosis cell envelope and interactions with the immune cell response.29 The AS lipid fraction, on the other hand, is composed of mycolic acid species with methyl esters. In addition, this fraction includes mono‐ and diglycerides, cholesterol, triglycerides and non‐polar glycopeptidolipids. We identified the secretion of IgM antibodies, including anti‐PTC and anti‐CL, in response to both AS and AI lipid fractions. We hypothesize that phospholipids present in the mycobacterial cell envelope, including both the outer and inner membrane, may induce B‐cell activation and IgM secretion during Mycobacterium infection of a vertebrate host. We noted higher total IgM secretion in response to the entire M. tuberculosis lipids mixture and whole bacteria M. bovis BCG compared with stimulation with the AI or AS fraction alone. A plausible explanation is that the total lipid fraction, as well as the whole bacteria, contain a wide array of lipids with higher immunogenic properties than AS and AI lipid fraction stimuli. However, the secretion of anti‐CL and anti‐PTC IgM antibodies after mycobacterial lipid stimulation suggest that a portion of the IgM antibodies produced by PerC B cells lacks specificity.
The secretion of anti‐phospholipid IgM antibodies facilitates tissue healing during tuberculosis treatment and clearance. These antibodies have been reported to bind apoptotic cells and facilitate the clearance of dead cells and debris. Specifically, anti‐phospholipid IgM antibodies enhance procoagulant activity and the uptake and clearance of apoptotic cells.30 These essential steps are required to eliminate cell debris resulting from inflammation and tissue damage during M. tuberculosis infection. Hence, natural antibodies might function to restore homeostasis and promote recovery in the lungs. Other studies suggested, however, that antibodies can have a deleterious effect on cell‐mediated immune responses. For example, anti‐M. tuberculosis glycolipid IgM antibodies have been associated with a diminished cell‐mediated immune response to tuberculin antigens.31 Also, high levels of IgG anti‐tuberculin antibodies decrease the T‐cell response in high‐risk individuals with latent TB infection.32 Consequently, vaccine development efforts avoid inducing a strong antibody response to mycobacterial lipid antigens.
Anti‐phospholipid IgM levels during TB are directly related to the bacterial burden within the lungs. We previously observed that TB patients without lung cavities and undergoing 2 months of anti‐TB therapy decreased their blood anti‐phospholipid IgM antibody levels.7, 8 Similar changes were observed in M. tuberculosis‐infected mice following pyrazinamide and isoniazid therapy.6 This study revealed that anti‐PTC and anti‐CL IgM antibody levels also decrease after anti‐TB therapy in mice. Recently, we analysed IgM antibodies in pleural lavage of mice after local infection with M. bovis BCG.33 In this study, we found that the levels of total and anti‐PTC IgM antibodies rise with infection and remain detectable 90 days post infection with BCG, whereas anti‐cardiolipin IgM antibody levels decreased with bacteria clearance. The present study provides in vitro evidence that the B‐1 cell population contributes to in vivo IgM production when exposed to M. tuberculosis lipids and whole BCG bacterium. Animal TB infection models and clinical studies are now warranted to explore the molecular mechanisms and kinetics of IgM antibody production following TB infection. Such an effort will contribute to the understanding of anti‐phospholipid IgM antibodies as a potential biomarker for monitoring anti‐TB therapy, predicting disease progression and vaccine development. Such in vivo studies could also describe the response and dynamics of the B‐1 cell repertoire during both TB and latent TB infection.
The detection of IgM, IgG and IgA antibody subclasses in response to M. tuberculosis antigens indicates early signs of antigenic stimulation as well as the infection and progression stages in TB patients.34 Recently, serum testing for Mycobacterium leprae infection demonstrated a significant relationship between the levels of anti‐phenolic glycolipid‐I (anti‐PGL‐1) IgM antibodies and clinical improvement after therapy.35 We previously reported a decrease in anti‐phospholipid IgM antibodies after 2 months of intense phase anti‐TB therapy in patients with non‐cavitary TB disease.7 Hence, therapeutic follow up that includes testing for anti‐CL or anti‐PTC IgM antibodies might be a suitable method for monitoring TB therapy regimens in non‐cavitary TB patients or for predicting disease progression. For now, our study provides evidence of the ex vivo secretion of IgM by B‐1 cells in response to various lipids, including those derived from M. tuberculosis and whole bacterium M. bovis BCG.
The details of B‐cell and IgM antibody dynamics during TB, anti‐TB therapy and vaccination in humans remain unclear. A recent study found distinct B‐cell subpopulations in peripheral blood during active TB disease and other lung disease conditions.36 Although Plessis et al. looked at IgM+‐activated B‐cell subpopulations, they failed to identify the B‐1 cell subpopulation among their patient cohort. Hence, the proportions of this cell subset found in healthy individuals versus patients with TB or other lung diseases are not known. On the other hand, Russo and Mariano suggested that B‐1 cells migrate from the peritoneum to mycobacterial pulmonary lesions in mice.11 Their study did not investigate the mechanisms of B‐1 cell activation. We believe that delineating the activation mechanisms of these B‐1 cells and their subsets in TB patients would greatly strengthen our understanding of this cell subset's contribution to physiopathology and disease control. Further clinical studies looking at the specific B‐cell subpopulations will help us to clarify both questions.
Disclosure
The authors declare no competing interests.
Acknowledgements
The M. tuberculosis lipids used in our experiments were obtained from BEI Resources, NIAID, and NIH; we used the following items: Total Lipids, NR‐14837; Mycobacterium tuberculosis, Strain H37Rv, Acetone‐Soluble Lipids, NR‐14842; Mycobacterium tuberculosis, Strain H37Rv, Acetone‐Insoluble Lipids, NR‐14843. We thank Jean Luo, Karen Tracy, Trang Nguyen, Kim Olsen, Jaykumar Batt and Shivneel Ram, from the Baumgarth Laboratory at the Center for Comparative Medicine in UC Davis, CA for their contributions to the B‐1 cell and flow cytometry experiments. We thank Fermín Acosta at INDICASAT‐AIP for maintaining the mycobacteria cultures and conducting the morphological analysis and DNA identification of the M. bovis BCG culture. We also thank Marla Ramos, Deborah Doens, Carolina de la Guardia and Carlos Restrepo for their guidance in using the Partec Flow Cytometer; Yisett Gonzalez for their assistance with the animal experiments; and Ricardo Lleonart and Carmenza Spadafora who provided insight and expertise that greatly assisted this research at INDICASAT‐AIP, City of Knowledge. Finally, we thank Colleen Goodridge for her critical review of the manuscript and valuable suggestions. The conception and design was the responsibility of NB, PLF and AG; laboratory and statistical analysis and interpretation were by CO, HPS, MT, RR, CWG, DS and AG; and drafting the manuscript for important intellectual content was done by CO, HPS, LWR, NB, PLF and AG. This research was supported by a Doctoral Fellowship from the Secretaria Nacional de Ciencia Tecnología e Innovación (SENACYT) and the Instituto para la Formación y Aprovechamiento de los Recursos Humanos (IFARHU). We also received funds from SENACYT grants ITE‐11‐020, IDR‐10‐067 and GC‐2015‐22, IFARHU‐270‐2012‐138, as well as from the Sistema Nacional de Investigadores de Panamá (SNI) SNI‐55‐2014 y SNI‐129‐2015. Experiments conducted at UC Davis were supported by U19AI109962.
[Correction added on 11 April 2018, after first online publication: Reference 21 (Beste et al., 2005) was removed from the Reference list. All succeeding references have been renumbered in this version.]
References
- 1. WHO . (2017) Global Tuberculosis Report 2017. Geneve; 2017 December 1st. Contract No.: WHO/HTM/TB/2017.23.
- 2. Wallis RS, Kim P, Cole S, Hanna D, Andrade BB, Maeurer M et al Tuberculosis biomarkers discovery: developments, needs, and challenges. Lancet Infect Dis 2013; 13:362–72. [DOI] [PubMed] [Google Scholar]
- 3. Sankar MM, Balooni V, Singh J, Singh S. Diagnostic performance of commercially available enzyme‐linked immunosorbent assay kit in the diagnosis of extrapulmonary tuberculosis. J Lab Physicians 2013; 5:11–6. [DOI] [PMC free article] [PubMed] [Google Scholar]
- 4. Steingart KR, Flores LL, Dendukuri N, Schiller I, Laal S, Ramsay A et al Commercial serological tests for the diagnosis of active pulmonary and extrapulmonary tuberculosis: an updated systematic review and meta‐analysis. PLoS Med 2011; 8:e1001062. [DOI] [PMC free article] [PubMed] [Google Scholar]
- 5. WHO . (2011) Commercial serodiagnostic tests for diagnosis of tuberculosis: policy statement. Geneve, Switzerland. Report No.: WHO/HTM/TB/2011.5. [PubMed]
- 6. Goodridge A, Zhang T, Miyata T, Lu S, Riley LW. Antiphospholipid IgM antibody response in acute and chronic Mycobacterium tuberculosis mouse infection model. Clin Respir J 2013; 8:137–44. [DOI] [PubMed] [Google Scholar]
- 7. Goodridge A, Cueva C, Lahiff M, Muzanye G, Johnson JL, Nahid P et al Anti‐phospholipid antibody levels as biomarker for monitoring tuberculosis treatment response. Tuberculosis 2012; 92:243–7. [DOI] [PMC free article] [PubMed] [Google Scholar]
- 8. Elkayam O, Bendayan D, Segal R, Shapira Y, Gilburd B, Reuter S et al The effect of anti‐tuberculosis treatment on levels of anti‐phospholipid and anti‐neutrophil cytoplasmatic antibodies in patients with active tuberculosis. Rheumatol Int 2013; 33:949–53. [DOI] [PubMed] [Google Scholar]
- 9. Baumgarth N. The double life of a B‐1 cell: self‐reactivity selects for protective effector functions. Nat Rev Immunol 2011; 11:34–46. [DOI] [PubMed] [Google Scholar]
- 10. Moon BG, Takaki S, Miyake K, Takatsu K. The role of IL‐5 for mature B‐1 cells in homeostatic proliferation, cell survival, and Ig production. J Immunol 2004; 172:6020–9. [DOI] [PubMed] [Google Scholar]
- 11. Russo RT, Mariano M. B‐1 cell protective role in murine primary Mycobacterium bovis bacillus Calmette–Guérin infection. Immunobiology 2010; 215:1005–14. [DOI] [PubMed] [Google Scholar]
- 12. Jackson M. The mycobacterial cell envelope‐lipids. Cold Spring Harb Perspect Med 2014; 4:a021105. [DOI] [PMC free article] [PubMed] [Google Scholar]
- 13. Binder CJ, Silverman GJ. Natural antibodies and the autoimmunity of atherosclerosis. Springer Semin Immunopathol 2005; 26:385–404. [DOI] [PubMed] [Google Scholar]
- 14. Yenson V, Baumgarth N. Purification and immune phenotyping of B‐1 cells from body cavities of mice. Methods Mol Biol 2014; 1190:17–34. [DOI] [PubMed] [Google Scholar]
- 15. Savage HP, Yenson VM, Sawhney SS, Mousseau BJ, Lund FE, Baumgarth N. Blimp‐1‐dependent and ‐independent natural antibody production by B‐1 and B‐1‐derived plasma cells. J Exp Med 2017; 214:2777–94. [DOI] [PMC free article] [PubMed] [Google Scholar]
- 16. Bouchonnet F. α/β interferon impairs the ability of human macrophages to control growth of Mycobacterium bovis BCG. Infect Immun 2002; 70:3020–5. [DOI] [PMC free article] [PubMed] [Google Scholar]
- 17. Venkataswamy MM, Goldberg MF, Baena A, Chan J, Jacobs WR Jr, Porcelli SA. In vitro culture medium influences the vaccine efficacy of Mycobacterium bovis BCG. Vaccine 2012; 30:1038–49. [DOI] [PMC free article] [PubMed] [Google Scholar]
- 18. Choi YS, Dieter JA, Rothaeusler K, Luo Z, Baumgarth N. B‐1 cells in the bone marrow are a significant source of natural IgM. Eur J Immunol 2012; 42:120–9. [DOI] [PMC free article] [PubMed] [Google Scholar]
- 19. Nguyen TT, Elsner RA, Baumgarth N. Natural IgM prevents autoimmunity by enforcing B cell central tolerance induction. J Immunol 2015; 194:1489–502. [DOI] [PMC free article] [PubMed] [Google Scholar]
- 20. Priest SO, Baumgarth N. The role of innate signals in B cell immunity to influenza virus. Front Biosci 2013; 5:105–17. [DOI] [PubMed] [Google Scholar]
- 21. Nguyen TT, Baumgarth N, Baumgarth N. Natural IgM and the development of B cell‐mediated. Autoimmune Dis 2016; 36:163–77. [DOI] [PMC free article] [PubMed] [Google Scholar]
- 22. Baumgarth N. B‐1 cell heterogeneity and the regulation of natural and antigen‐induced IgM production. Crit Rev Immunol. 2016;36:163–77. [DOI] [PMC free article] [PubMed] [Google Scholar]
- 23. Savage HP, Baumgarth N. Characteristics of natural antibody‐secreting cells. Ann N Y Acad Sci 2015; 1362:132–42. [DOI] [PMC free article] [PubMed] [Google Scholar]
- 24. Cruz‐Leal Y, Lucatelli Laurindo MF, Osugui L, Luzardo Mdel C, Lopez‐Requena A, Alonso ME et al Liposomes of phosphatidylcholine and cholesterol induce an M2‐like macrophage phenotype reprogrammable to M1 pattern with the involvement of B‐1 cells. Immunobiology 2014; 219:403–15. [DOI] [PubMed] [Google Scholar]
- 25. Li X, Martin F, Oliver AM, Kearney JF, Carter RH. Antigen receptor proximal signaling in splenic B‐2 cell subsets. J Immunol 2001; 166:3122–9. [DOI] [PubMed] [Google Scholar]
- 26. Baumgarth N. Innate‐like B cells and their rules of engagement. Adv Exp Med Biol 2013; 785:57–66. [DOI] [PubMed] [Google Scholar]
- 27. Cabiedes J, Cabral AR, Lopez‐Mendoza AT, Cordero‐Esperon HA, Huerta MT, Alarcon‐Segovia D. Characterization of anti‐phosphatidylcholine polyreactive natural autoantibodies from normal human subjects. J Autoimmun 2002; 18:181–90. [DOI] [PubMed] [Google Scholar]
- 28. Bansal‐Mutalik R, Nikaido H. Mycobacterial outer membrane is a lipid bilayer and the inner membrane is unusually rich in diacyl phosphatidylinositol dimannosides. Proc Natl Acad Sci USA 2014; 111:4958–63. [DOI] [PMC free article] [PubMed] [Google Scholar]
- 29. Rodriguez ME, Loyd CM, Ding X, Karim AF, McDonald DJ, Canaday DH et al Mycobacterial phosphatidylinositol mannoside 6 (PIM6) up‐regulates TCR‐triggered HIV‐1 replication in CD4+ T cells. PLoS ONE 2013; 8:e80938. [DOI] [PMC free article] [PubMed] [Google Scholar]
- 30. Rauch J, D'Agnillo P, Subang R, Levine JS. Anti‐phospholipid antibodies (aPL) and apoptosis: prothrombin‐dependent aPL as a paradigm for phospholipid‐dependent interactions with apoptotic cells. Thromb Res 2004; 114:371–82. [DOI] [PMC free article] [PubMed] [Google Scholar]
- 31. Sousa AO, Salem JI, Lee FK, Vercosa MC, Cruaud P, Bloom BR et al An epidemic of tuberculosis with a high rate of tuberculin anergy among a population previously unexposed to tuberculosis, the Yanomami Indians of the Brazilian Amazon. Proc Natl Acad Sci USA 1997; 94:13227–32. [DOI] [PMC free article] [PubMed] [Google Scholar]
- 32. Feris EJ, Encinales L, Awad C, Stern JN, Tabansky I, Jimenez‐Alvarez L et al High levels of anti‐tuberculin (IgG) antibodies correlate with the blocking of T‐cell proliferation in individuals with high exposure to Mycobacterium tuberculosis . Int J Infect Dis 2016; 43:21–4. [DOI] [PubMed] [Google Scholar]
- 33. Ordonez C, Tarajia M, Rivera R, Sambrano D, Batista V, Chavez M et al Total IgM and anti‐phosphatidylcholine igm antibody secretion continue after clearance of Mycobacterium bovis bacillus Calmette–Guérin pleural infection. Lung 2017; 195:517–21. [DOI] [PubMed] [Google Scholar]
- 34. Julian E, Matas L, Alcaide J, Luquin M. Comparison of antibody responses to a potential combination of specific glycolipids and proteins for test sensitivity improvement in tuberculosis serodiagnosis. Clin Vaccine Immunol 2004; 11:70–6. [DOI] [PMC free article] [PubMed] [Google Scholar]
- 35. Penna ML, Penna GO, Iglesias PC, Natal S, Rodrigues LC. Anti‐PGL‐1 positivity as a risk marker for the development of leprosy among contacts of leprosy cases: systematic review and meta‐analysis. PLoS Negl Trop Dis 2016; 10:e0004703. [DOI] [PMC free article] [PubMed] [Google Scholar]
- 36. du Plessis WJ, Keyser A, Walzl G, Loxton AG. Phenotypic analysis of peripheral B cell populations during Mycobacterium tuberculosis infection and disease. J Inflamm (Lond) 2016; 13:23. [DOI] [PMC free article] [PubMed] [Google Scholar]