

Abstract
Background
Arua district, in Uganda, hosts some of the largest refugee camps in the country. The estimated prevalence of moderate and severe acute malnutrition in children is higher than the national estimates (10.4 and 5.6% respectively, compared to 3.6 and 1.3%). This study aimed at assessing the quality of care provided to children with acute malnutrition at out-patient level in such a setting.
Methods
Six facilities with the highest number of children with malnutrition were selected. The main tool used was the National Nutrition Service Delivery Assessment Tool, assessing 10 key areas of service delivery and assigned a score as either poor, fair, good or excellent. Health outcomes, quality of case management and data quality were assessed from the health management information system and from the official nutrition registers.
Results
All facilities except two scored either poor or fair under all the 10 assessment areas. Overall, 33/60 (55%) areas scored as poor, 25/60 (41%) as fair, 2/60 (3.3%) as good, and none as excellent. Main gaps identified included: lack of trained staff; disorganised patient flow; poor case management; stock out of essential supplies including ready-to-use therapeutic foods; weak community linkage. A sample coverage of 45.4% (1020/2248) of total children admitted in the district during the 2016 financial year were included. The overall mean cure rate was 52.9% while the default rate was 38.3%. There was great heterogeneity across health facilities in health outcomes, quality of case management, and data quality.
Conclusion
This study suggests that quality of care provided to children with malnutrition at health center level is substandard with unacceptable low cure rates. It is essential to identify effective approaches to enhance adherence to national guidelines, provision of essential nutritional commodities, regular monitoring of services and better linkage with the community through village health teams.
Electronic supplementary material
The online version of this article (10.1186/s12913-018-3366-5) contains supplementary material, which is available to authorized users.
Keywords: Acute malnutrition, Children under 5 years, Quality of care, Quality assessment, Health center
Background
Under-nutrition is a major cause of morbidity in children under 5 years [1]. The most recent estimates indicate that 52 million children under 5 years are diagnosed with wasting and 17 million with severe wasting and of these, 26.9% occur in Sub-Saharan Africa [1].
In Uganda, under-nutrition is considered a condition of public health importance [2]. National estimates report that 3.6% children suffer from moderate acute malnutrition (MAM) while 1.3% have severe acute malnutrition (SAM) [3]. However, this prevalence is heterogeneous across regions. For instance, the West Nile region, currently considered as a humanitarian setting and hosting refuges from South Sudan and Congo [4, 5] has the highest reported prevalence of MAM and SAM in the country at 10.4 and 5.6% respectively [3]. This is far above the target identified by the World Health Assembly which adopted the goal of reducing and maintaining the prevalence of wasting in children to under 5% by 2025 [6, 7].
Uganda is committed to reducing malnutrition and has identified this as a key part of its strategy for becoming a middle-income country by 2040 [8]. Actions to address malnutrition were included in the National Development Plan 2015/2016–2019/20 [9] and in the Uganda Nutrition Action Plan 2011–2016 for multi-sectoral support [10]. The Ministry of Health (MoH) developed the Integrated Management of Acute Malnutrition (IMAM) guidelines in 2006 and updated them in 2011 [11] and 2016 [2], in line with the WHO recommendations. The guidelines provide details for the management of children with both MAM and SAM at health facility level and include recommendations for screening and follow up at community level. Support has been provided from both international and local stakeholders especially the procurement and distribution of therapeutic foods and basic nutritional equipment [10, 12].
However, several studies have shown that adopting guidelines, providing training and basic equipment per se do not actually ensure that care is delivered according to set standards [13–17]. Assessments of the quality of nutritional services in other settings have highlighted poor adherence to guidelines leading to substandard health outcomes [14, 15, 18]. Therefore identifying areas of substandard quality of care is an important step towards improvement of health services [18–23]. In Uganda there is limited published literature on the performance of health facilities offering nutritional services, especially in a refuge setting. The aim of this study was to carry out an assessment of the quality of care provided to children admitted with acute malnutrition at out-patient therapeutic care (OTC) level in Arua district, West Nile region.
Methods
Study design, population and setting
This was a cross sectional study and is reported according to the STROBE guidelines. It was conducted between July and August 2016 in Arua district. According to the 2014 census, the estimated population in the district is 808,745 residents, [24]. By May 2017, the district was hosting approximately 174,396 refugees mainly from South Sudan and DR Congo [4]. For this assessment, six health facilities were selected out of the 55 government owned facilities based on the following criteria; those providing nutrition services, those with the highest reported number of malnourished children according to the Health Management and Information System (HMIS) data for the financial year 2016 (July 2015 to June 2016) [25] and whose staff agreed to participate. Exclusion criteria included difficult to access facilities and those without a staff assigned to be responsible for nutrition service delivery.
Data collection tools, procedures and variables
Nutrition service delivery
The Nutrition Service Delivery Assessment (NSDA) was the main tool used for this evaluation. The tool was developed by the Uganda MoH with support from external partners as the official national instrument for assessing performance of nutritional services [26]. It assesses 10 key capacity areas of nutrition service relevant at outpatient level, including: general information on service implementation, adequate human resources, provision of nutritional services, community linkage, quality improvement activities, materials and supplies, nutrition unit requirements, store management, logistics management for commodities, monitoring and evaluation. Data sources include: direct observation, documents review, interviews with health staff, village health teams (VHTs) and mothers of children diagnosed with malnutrition. For each chapter, using strict criteria specified in the tool (similar to checklists), a final judgment on the quality of the services was made and a final score assigned as one of four pre-defined categories: poor, fair, good and excellent. The tool also guides the identification of specific gaps in service delivery in each of the capacity areas.
The study team involved in the NSDA assessment included a senior paediatrician, a nutritionist and a public health expert, all experienced in the National IMAM guidelines [2] and in the use of the NSDA tool [26].
Health outcomes
Health outcomes were extracted from the HMIS by a national HMIS focal person for the review period (financial year 2016), according to six categories based on the national definitions in the IMAM guidelines [2]: 1) Cured: attaining a weight-for-height ≥ − 2 standard deviation (SD) from the mean based on the WHO 2006 standards or mid upper circumference (MUAC) of ≥12.5 cm; 2) Non-responders: not reaching discharge criteria after three months or four months for the HIV/TB patients; 3) Defaulters: absent for 2 consecutive follow up visits; 4) Transferred to in-patient care (ITC): condition has deteriorated and requires in-patient care or not responding to treatment; 5) Transferred to to another out-patient care facility (OTC): patient transferred to other nearby OTCs or as requested by caregiver; and 6) Died: patient died while in the program.
Quality of case management and quality of data
Quality of case management and quality of data were assessed for each child enrolled in the program during the 2016 financial year using the Integrated Nutrition Register (INR) as a source of data. The INR is the official register at the health facility level where all information on malnourished children is recorded. Data extraction was conducted by a team of six data collectors, trained for this purpose, and directly supervised by a nutritionist. Data collection tools were pre-defined and pilot tested, and standard operating procedures (SOP) were developed to standardise the data extraction process. Quality of case management was assessed using the national guidelines as reference for standards [2] and using five pre-defined process outcomes:1) Correct diagnosis: correct assignment of the category of malnutrition based on weight-for-height Z-score or MUAC as follows: MAM if weight-for-height Z-score > − 3 and < − 2 standard deviation or MUAC (6 to 59 months) > 11.5 and < 12.5 cm and no bilateral pitting oedema; and SAM if weight-for-height Z-score < − 3 Standard deviation or MUAC (6 to 59 months) < 11.5 cm, bilateral pitting oedema, no medical complications and passes appetite test; 2) Correct treatment: correct treatment of cases with SAM such as: 10% glucose/sugar for hypoglycaemia at triage, Amoxicillin for bacterial infections on first day, Measles vaccination on admission (if > 9 months and not yet received), Vitamin A capsule given once at discharge, Iron and folic acid prescribed in presence of anaemia, Mebendazole/Albendazole for helminthic infections on second visit and Ready to Use Therapeutic Foods (RUFT) called Plumpy nut, as main malnutrition prescription; 3) Correct evaluation of HIV: HIV test performed on all patients following the national testing algorithm [27]; 4) Correct counselling of care givers/patients on key messages: delivery of counselling in the following area, as for the national guideline [2]: nutrition, RUFT administration, hygiene, HIV; and 5) Correct exit health outcome assigned: correct assignment of the exit criteria as for the national guideline [2] criteria, as follows: cured, non-respondent, defaulted, transfer to in-patient care or out-patient care and died.
Data quality was assessed using the following two pre-defined indicators: 1) data completeness defined for each single case as “complete” if in information on the following 15 key required fields were filled in: date, patient name, type of nutritional management, nutritional status at enrolment, HIV status at enrolment, anti-retroviral therapy services at enrolment, visit date, oedema, weight, height/length, MUAC colour, Z-score, therapeutic feeds, target exit criteria, exit outcome; and 2) internal consistency defined for each single case as “consistent” if i) the height of the child was consistent over time (ie not decreasing) and ii) the date of the visits was consistent over time (ie progressive dates in the register).
Data management
Data was collected and double entered into pre-formatted excel spreadsheets and checked for consistency and accuracy by two supervisors before analysis. The distribution of the health facility categorical parameters was presented as frequencies with respective proportions. Health outcomes were assessed against the SPHERE standards [28]. Case management and data quality indicators were assessed against a predefined target of at least 80%. Cases with missing information on health outcomes and quality of case management were counted as incorrect. A two sided p-value of < 0.05 was considered as statistically significant.
Results
Characteristics of the health facilities
The selected population sample, from the six facilities, accounted for 45.4% (1020/2248) of total caseload of malnourished children treated in Arua district during this review period (Fig. 1).
Fig. 1.
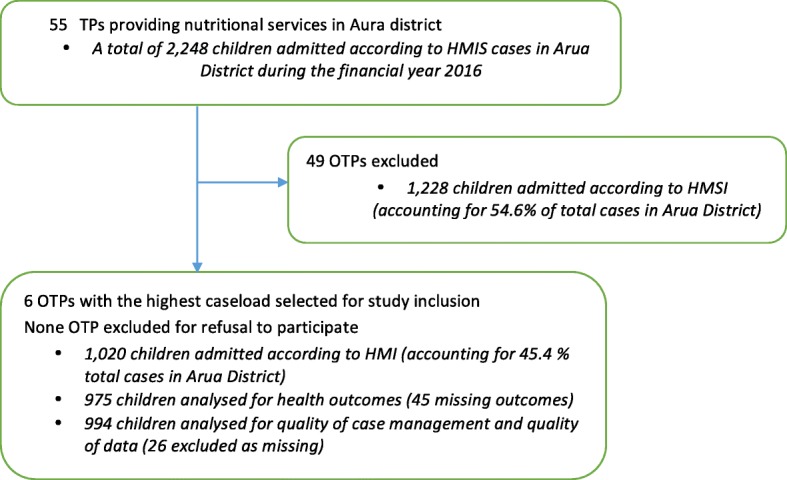
Study flow diagram
Characteristics of the health facilities are reported in Table 1. Overall, the number of children treated in each facility varied (from 318 to 61) but this was not directly proportional to the estimated population coverage (number of children diagnosed per 1000 population coverage ranging from 2.8 to 32.8).
Table 1.
Key characteristics of the health facilities
| Variable | Health facility | ||||||
|---|---|---|---|---|---|---|---|
| HC 1 | HC 2 | HC 3 | HC 4 | HC 5 | HC 6 | Totals | |
| Health Center levela | IV | III | III | III | III | III | – |
| Estimated population coverage | 32,000 | 3960 | 22,548 | 13,779 | 2500 | 21,662 | 96,449 |
| Children diagnosed with acute malnutritionb | 318 | 292 | 116 | 151 | 82 | 61 | 1020 |
| Number of staff assigned to the nutritional unit | 2 | 2 | 3 | 1 | 3 | 2 | 13 |
| Nutritional staff qualification | |||||||
| Clinical officer | 1 | 0 | 0 | 0 | 0 | 0 | 1 |
| Enrolled nurse/midwife | 1 | 1 | 1 | 0 | 3 | 2 | 8 |
| Nursing assistant | 0 | 1 | 2 | 1 | 0 | 0 | 4 |
| Staff trained in IMAM guideline | 1 | 0 | 0 | 0 | 0 | 0 | 1 |
aLevels of primary health care in Uganda is tiered into health center I,II,III and IV
bHMIS data July 2015 – June 2016 (financial year)
Four out of six facilities had two or less staff assigned to the nutrition unit, with only one facility having a clinical officer involved. Overall, only one staff (7.6%) had been trained in the IMAM guidelines.
Nutrition service delivery assessment
All facilities except two scored either poor or fair under all the 10 assessment areas of the NSAD tool (Table 2). Overall, 33/60 (55.0%) areas were scored as poor, 25/60 (41.7%) as fair, 2/60 (3.3%) as good, and none as excellent. In particular, the following two areas were scored as poor in all facilities: quality improvement activities and monitoring and evaluation (see Additional file 1). Figure 2 shows a summary the distribution of the NSDA scores.
Table 2.
Performance of health facilities in the selected capacity areas
| Capacity area | Health facility Scorea | |||||
|---|---|---|---|---|---|---|
| HC 1 | HC 2 | HC 3 | HC 4 | HC 5 | HC 6 | |
| 1. General information on service implementation | Fair | Good | Fair | Fair | Fair | Fair |
| 2. Adequate human resources | Poor | Poor | Poor | Poor | Fair | Poor |
| 3. Provision of nutritional services | Fair | Fair | Fair | Poor | Fair | Poor |
| 4. Community Linkagetable | Fair | Fair | Fair | Poor | Poor | Good |
| 5. Quality improvement activities | Poor | Poor | Poor | Poor | Poor | Poor |
| 6. Materials and Supplies | Poor | Fair | Poor | Poor | Fair | Poor |
| 7. Nutrition unit requirements | Fair | Fair | Poor | Fair | Fair | Poor |
| 8. Store management | Poor | Fair | Fair | Poor | Fair | Fair |
| 9. Logistics Management for commodities | Poor | Poor | Fair | Poor | Fair | Poor |
| 10. Monitoring and evaluation | Poor | Poor | Poor | Poor | Poor | Poor |
aScore performance categories according to the NSDA tool: poor; fair; good; excellent [26]
Fig. 2.

Distribution of NSDA scores by facility
Table 3 shows the specific gaps in quality of nutritional services identified with the NSDA. Key findings included: poor organisation of services at the nutrition service delivery point; poor case diagnosis and treatment; stock out of nutrition foods; weak community linkage mechanisms.
Table 3.
Gaps in quality of nutritional services observed by capacity area
| Capacity area | Observed issue |
|---|---|
| Organisation of services | Nutrition services delivered “under the tree” |
| Working hours unclear | |
| Frequent service delays if rain | |
| No triage | |
| Chaotic organisation, no clear roles and responsibilities | |
| No transport for children sent In-patient Therapeutic Care (ITC) | |
| Working hours unclear | |
| Case management | Triage not performed |
| Mid Upper Aram Circumference (MUAC) not routinely done at all entry points (Out patients department -OPD, Tuberculosis and Anti retroviral therapy - TB/ART) | |
| Mis-classification SAM/MAM | |
| Z-score never used (only MUAC used) | |
| No history taking | |
| Comprehensive clinical examination as per the Integrated Management of Childhood Illnesses (IMCI) not performed | |
| Treatment | Water with sugar not offered at admission |
| 10 key messages on RUTF not delivered | |
| Individual counselling never performed | |
| Amoxicillin, vitamine A, Iron and mebendazole not prescribed | |
| MAM and SAM usually treated the same | |
| Integrated Management of childhood Illnesses (IMCI) | HIV status often indicated as unknown despite availability of testing kits |
| TB rarely assessed | |
| Children at OPD not always assessed for nutritional status | |
| Children with malnutrition not assessed according to IMCI | |
| Staff working in out-patient care not trained in IMCI | |
| Old IMCI job aids in some facilities | |
| Supplies | Stock out of RUTF observed in many facilities |
| Lack of mean of transport to facilities | |
| Lack of timely request from facilities | |
| Staffing | Lack of staffing with some facilities having no nutritional focal person appointed |
| Lack of nutritional specific training | |
| Poor practices even among trained staff | |
| Village Health Teams (VHTs) usually not formally trained but doing the job at OTC in place of facility staff | |
| Community linkage | VHTs screening reports not readily available |
| Blank VHTs registers | |
| No effective means of communication between facilities and village health teams (VHTs) | |
| No incentives for the VHT | |
| Quality improvement | Several supportive supervision activities are conducted on a quarterly basis, at facilities but only few are specific to nutrition |
Abbreviations: ART Anti Retro-viral Therapy, HIV Human Immune-deficiency Virus, IMCI Integrated Management of Childhood Illness, ITC In-patient Therapeutic Care, MAM Moderate Acute Malnutrition, MUAC Mid-Upper Arm Circumference, OPD Out Patients Department, OTC Out-patient Therapeutic Care, RUTF Ready-to-Use Therapeutic Foods, SAM Severe Acute Malnutrition, TB Tuberculosis, VHT Village Health Teams
Of note, the assessment also identified some areas with good service delivery. All health facilities were using HMIS forms (INR and monthly quarterly reports), had basic nutrition equipment (weighing, length/height measuring scales and MUAC tapes), essential job aids (Z-score classification and counselling aids), VHTs were engaged and there was evidence of quarterly supervision conducted by district health team.
Health outcomes
The distribution of health outcomes is shown in Fig. 3. The cure rate and defaulter rate were the two health outcomes that were predominantly assigned (see Additional file 1). The overall cured rate in all the six health facilities was 52.9% while the overall defaulting rate was 38.2%. Significant heterogeneity was observed between these outcomes across health centers with the cure rate ranging from 31.2 to 74.4% and the defaulting rate ranging from 18.7 to 63.9%. During the entire study period, 37 children (4.0%) were transferred to ITC, 13 (1.3%) were classified as non-responders and only one participant (0.1%) was recorded to have died.
Fig. 3.

Distribution of health outcomes
Quality of case management
Overall, 994 cases of malnourished children were identified in the INR and reviewed (see Additional file 1). Health facility performance on all case management process indicators was highly heterogeneous across facilities (Table 4). The rate of correct diagnosis ranged from 4.5 to 91.2%, correct treatment from 0 to 50.0%, correct HIV status assignment from 58.1 to 91.2%, correct counselling from 11.2 to 99.3% and correct exit outcome from 0 to 75.9%. The overall average rates were as follows: correct diagnosis at 34.6%; correct treatment at 19.2%; correct counselling at 47.6%; correct evaluation of HIV at 73.5% and correct exit outcome at 16.7%. None of the overall estimates for process outcomes reached the pre-defined target of 80% with a statistically significant difference when compared to this threshold (chi p-value = 0.001).
Table 4.
Case management and data quality
| Variable | Health facility | |||||||
|---|---|---|---|---|---|---|---|---|
| HC 1 N = 194 |
HC 2 N = 137 |
HC 3a No data |
HC 4 N = 301 |
HC 5 N = 228 |
HC 6 N = 134 |
Total N = 994 |
Chi p-value# |
|
| Correct process outcomes | ||||||||
| Diagnosis | 30(15.5) | 125(91.2) | – | 88(29.2) | 95(41.7) | 6(4.5) | 344(34.6) | 0.001 |
| IMAM treatment | 0 | 0 | – | 151(50.0) | 28(12.3) | 12(9.0) | 191(19.2) | 0.001 |
| Evaluation of HIV | 158(81.4) | 90(65.7) | – | 175(58.1) | 208(91.2) | 100(74.6) | 731(73.5) | 0.001 |
| Counselling of patients | 39(20.1) | 136(99.3) | – | 172(57.1) | 111(48.7) | 15(11.2) | 473(47.6) | 0.001 |
| Exit outcome assigned | 19(9.8) | 104(75.9) | – | 31(10.3) | 12(5.3) | 0 | 166(16.7) | 0.001 |
| Data quality | ||||||||
| Data completeness | 0 | 44(32.1) | – | 0(0) | 0(0) | 0(0) | 44(4.4) | 0.001 |
| Data consistency | 0 | 120(87.6) | – | 74(25.6) | 11(4.8) | 1(0.8) | 206(20.7) | 0.001 |
Data source: Integrated Nutrition Register
aData not available in the integrated nutrition register
#p-value assessed against a pre-defined target of 80% achievement
Data quality
There was high heterogeneity across health centers in data quality. Data completeness ranged from 0 to 32.1% and data consistency ranged from 0 to 87.6% (Table 4). The overall mean completeness rate was 4.4% and consistency at 20.7% with both indicators far below the pre-defined threshold of 80% (chi p-value = 0.001).
Additional analysis
No clear correlation could be found between single indicators (NSDA scores, cured rate, process outcomes, quality of data) and the type of health center (level IV vs III), or the volume of work (number of children admitted). No clear internal correlation among different indicators could be found (performance of the different indicators did not seem to be directly linked to each other).
Discussion
This is the first study reporting on the performance of nutritional services for children in Arua district. The assessment shows that, even though some positive aspects were observed, there are substantial deficiencies in the quality of nutrition services at health center level in Arua district. Significant gaps were observed both by using the national tool for Nutrition Service Delivery Assessment (NSDA) and by reviewing key indicators of health outcomes, case management and data quality in the official records.
The observed health facility cure rate of 52.9% was far below the international SPHERE standards target set at above 75% [28], while the defaulting rate of 38.3%, was significantly higher than the standard’s target set at below 15% (28). One of the possible reasons for this low cure rate may be the lack of adherence to guidelines for case management as observed in this study. Important clinical practices such as triage, screening of all children for malnutrition, history taking, detailed examination, diagnosis of SAM and MAM, individual counselling, complementary treatment and assignment of exit outcomes were not being performed according to the IMAM guidelines [2]. Additionally, laboratory screening for HIV and TB was not routinely conducted, despite the availability of laboratory diagnostic kits. Such poor performance of quality of health service delivery has also been reported in other studies both in routine settings in Uganda [13, 15, 29, 30] and in refugee settings such as in Ethiopia [31–34].
Another key reason explaining the poor performance of case management, in addition to inadequate human resource, is the substantial lack of training of heath facility staff, both frequently observed challenges in low and middle income countries [35]. The impact of targeted training on both health workers performance and children outcomes is relatively well documented. For example, a systematic review examining the effectiveness of nutritional training of health workers showed a clear benefit in improving feeding frequency, energy intake, and dietary diversity of children [36].
Notably, almost all the assessed health facilities had basic nutritional equipment such as digital weighing scales, length/height measuring boards, MUAC tapes and essential job aids. However, the frequent stock out of RUTF, an essential nutrition management commodity, was a significant issue, a finding in line with two earlier studies conducted in other regions in Uganda [29, 30].
The observed challenges such as stock out of RUTF, poor organisation of services including irregular working hours and long waiting times and weak community linkages re-affirm some of the underlying factors explaining the very high defaulting rate observed [29]. The poor performance of VHTs especially regarding case-identification and referral of cases is an observation that deserves further scrutiny because this study was not designed to identify the causes of this occurrence. However, evidence from a systemic review on factors that influence performance of community health workers (CHWs) such as VHTs found that lack of supervision, lack of training and lack of financial incentives were the main barriers to achieving an acceptable performance from CHWs [37]. Minimizing such barriers would improve access to care and ultimately the achievement of better health outcomes. Evidence shows that barriers to access for service users may increase mortality, especially among children with SAM who actually requires urgent medical attention [38].
Poor data quality is another important but frequently reported problem in low income countries, including Uganda [39, 40]. Good quality data is the basis for evidence based decision making and two suggested approaches for improvement in such settings include better training on data quality assurance procedures and intensive supportive supervision [38–41].
As already documented, the influx of refugees into a community negatively affects the performance of health services in such settings [31, 32]. However it is also true that poor performance has been reported in settings experiencing no refugee crisis [29, 30], indicating that refugee circumstances is not the sole explanation for such a performance. This study did not aim at comparing the performance of nutritional service before and during the most recent refugee crisis In Arua, but rather at collecting baseline data for service delivery evaluation. Future studies should aim at monitoring health system performance over time while exploring the influence of different factors on key outcomes.
Limitations of this study included the relatively small sample size in terms of health facilities, however, the study sample population captured over 45% of cases of children admitted to nutritional services in Arua district. Even though most of the assessment was conducted by direct evaluation using the NSDA tool [26], health outcomes and case management were assessed using recorded data, which, by nature, are exposed to a risk of recall bias. We tried to minimised this bias in different ways such as choosing the official documents as data sources with the expectation that all information of each child with malnutrition was recorded, using trained data collectors, using pre-defined data collection variables, developing standard operating procedures and transparency during reporting of study findings.
Recommendations for policy makers derived from this study may include: hiring and training of health facility staff to fill the human resource gap; strengthening supportive supervision to improve performance at different levels (case management, timely requests of RUTF, data quality, community linkages); and conducting regular NSDA assessments to monitor progress over time. More studies are needed to identifying effective approaches to enhance adherence to national guidelines and ultimately improve health outcomes of children.
Conclusion
This assessment revealed that quality of care and health outcomes of children with malnutrition in Arua district are far below the internationally acceptable SPHERE standards. Significant deficiencies were observed under organization of service, case management, procurement, community linkage and data quality. In the future both researchers and policy makers should aim at identifying effective approaches to increase quality of care for children with malnutrition in Arua district and similar settings.
Additional file
Quantitative dataset. (XLSX 57 kb)
Acknowledgements
The authors wish to thank the Arua district health team, CUAMM Uganda team, study data collectors, Goina Monica, and the health facility staff. The views expressed herein are solely of the authors and do not reflect the views of any other stakeholder.
Funding
Research discussed in the publication is funded by the World Food Programme (Office of Evaluation), the UK aid through the Department for International Development (DFID) and the International Initiative for Impact Evaluation (3ie). The views expressed in this publication are not necessarily those of WFP, DFID or 3ie.
Availability of data and materials
The quantitative data generated or analysed during this study are included in this published article as its additional file. Notes from the qualitative data are available from the corresponding author on reasonable request.
Abbreviations
- ART
Anti Retroviral Therapy
- DHT
District Health Team
- HC
Health Center
- HIV
Human Immuno-defiency Virus
- HMIS
Health Management and Information System
- IMAM
Integrated Management of Acute Malnutrition
- IMCI
Integrated Management of Childhood Illness
- INR
Integrated Nutrition Register
- ITC
In-patient Therapeutic Care
- MAM
Moderate Acute Malnutrition
- MoH
Ministry of Health
- MUAC
Mid Upper Arm Circumference
- NSDA
Nutrition Service Delivery Assessment
- OPD
Out Patient Department
- OTC
Out-patient Therapeutic Care
- RUTF
Reay to Use Therapeutic Foods
- SAM
Sever Acute Malnutrition
- TB
Tuberculosis
- UNICEF
United Nations International Emergency Fund
- VHT
Village Health Team
- WHO
World Health Organisation
Authors’ contributions
ML and HW1 conceived the study idea, in collaboration with, RM, GP, GS, HW2 and PL. ML, HW1 and RM lead the design and acquisition of data, ML and HW1 conducted the analysis and interpreted the data. HW1 and ML lead the drafting of manuscript, all authors were involved during critical revision for important intellectual content. All authors read and approved for the final manuscript to be published and are accountable for all aspects of the work
Ethics approval and consent to participate
The study was approved by the Makerere University School of Public health ethical committee, Uganda National Council of Science and Technology (UNCST) and the ethical committee of the IRCCS Burlo Garofolo, Italy. All participants interviewed gave their informed consent to participate and for the information derived to be published. The HMIS extracted data was aggregated with no individual level data details obtained, all the analysis was therefore anonymous.
Consent for publication
Not applicable
Competing interests
The authors declare that they have no competing interests.
Publisher’s Note
Springer Nature remains neutral with regard to jurisdictional claims in published maps and institutional affiliations.
Footnotes
Electronic supplementary material
The online version of this article (10.1186/s12913-018-3366-5) contains supplementary material, which is available to authorized users.
Contributor Information
Humphrey Wanzira, Email: humphrey.wanzira@burlo.trieste.it.
Richard Muyinda, Email: rmuyinda@gmail.com.
Peter Lochoro, Email: p.lochoro@cuamm.org.
Giovanni Putoto, Email: g.putoto@cuamm.org.
Giulia Segafredo, Email: g.segafredo@cuamm.org.
Henry Wamani, Email: wamanih@gmail.com.
Marzia Lazzerini, Email: marzia.lazzerini@burlo.trieste.it.
References
- 1.Levels and Trends in Child Malnutrition. Joint Child Malnutrition estimates. UNICEF/WHO/World Bank. 2017. Edition. New York: UNICEF.
- 2.Ministry of Health, Uganda . Guidelines for integrated management of acute malnutrition in Uganda. 2016. [Google Scholar]
- 3.Uganda Demographic and Health Survey. Kampala: Uganda Bureau of Statistics; 2016.
- 4.World Vision Uganda. West Nile refugee response situation report 8. May-2017. Kampala, Uganda.
- 5.Appeal for urgent response to Uganda refugee crisis’, NRC. [Online]. Available: https://www.nrc.no/news/2016/august/appeal-for-urgent-response-to-uganda-refugee-crisis/. [Accessed: 05-Apr-2017].
- 6.World Health Organization and Nutrition for Health and Development, Ambition and action in nutrition 2016–2025. 2017.
- 7.WHO Wasting Policy Brief . Global nutrition targets 2025. Geneva: World Health Organization; 2016. [Google Scholar]
- 8.Uganda National Planning Authority. Vision 2040. Kampala, Uganda.
- 9.Uganda National Planning Authority. Second National Development Plan 2015/16–2019/20. 2015. Kampala, Uganda.
- 10.Uganda Nutrition Action plan 2011–2016: Scaling Up Multi-Sectoral Efforts to Establish a Strong Nutrition Foundation for Uganda’s Development.
- 11.Ministry of Health, Uganda. Integrated Management of Acute Malnutrition Guidelines December 2010.
- 12.Government of Uganda – UNICEF country programme action plan 2016–2020.
- 13.Ayieko P, et al. A multifaceted intervention to implement guidelines and improve admission Paediatric Care in Kenyan District Hospitals: a cluster randomised trial. PLoS Med. 2011;8(4):e1001018. doi: 10.1371/journal.pmed.1001018. [DOI] [PMC free article] [PubMed] [Google Scholar]
- 14.Dettrick Z, Firth S, Soto EJ. Do strategies to improve quality of maternal and child health Care in Lower and Middle Income Countries Lead to improved outcomes? A review of the evidence. PLoS One. 2013;8(12):e83070. doi: 10.1371/journal.pone.0083070. [DOI] [PMC free article] [PubMed] [Google Scholar]
- 15.Pariyo GW, Gouws E, Bryce J, Burnham G. Improving facility-based care for sick children in Uganda: training is not enough. Health Policy Plan. 2005;20(suppl_1):i58–i68. doi: 10.1093/heapol/czi051. [DOI] [PubMed] [Google Scholar]
- 16.Huicho L, Dávila M, Campos M, Drasbek C, Bryce J, Victora CG. Scaling up integrated Management of Childhood Illness to the national level: achievements and challenges in Peru. Health Policy Plan. 2005;20(1):14–24. doi: 10.1093/heapol/czi002. [DOI] [PubMed] [Google Scholar]
- 17.Gillespie S, Menon P, Kennedy AL. Scaling up impact on nutrition: what will it take? Adv Nutr Int Rev J. 2015;6(4):440–451. doi: 10.3945/an.115.008276. [DOI] [PMC free article] [PubMed] [Google Scholar]
- 18.Falbo AR, Alves JG, Batista Filho M, Cabral-Filho JE. Implementation of World Health Organization guidelines for management of severe malnutrition in a hospital in Northeast Brazil. Cad Saude Publica. 2006;22(3):561–570. doi: 10.1590/S0102-311X2006000300011. [DOI] [PubMed] [Google Scholar]
- 19.Ashworth A, Chopra M, McCoy D, Sanders D, Jackson D, Karaolis N, Sogaula N, Schofield C. WHO guidelines for management of severe malnutrition in rural south African hospitals: effect on case fatality and the influence of operational factors. Lancet. 2004;363(9415):1110–1115. doi: 10.1016/S0140-6736(04)15894-7. [DOI] [PubMed] [Google Scholar]
- 20.Gathara D, Opiyo N, Wagai J, Ntoburi S, Ayieko P, Opondo C, Wamae A, Migiro S, Mogoa W, Wasunna A, Were F, Irimu G, English M. Quality of hospital care for sick newborns and severely malnourished children in Kenya: a two-year descriptive study in 8 hospitals. BMC Health Serv Res. 2011;11:307. doi: 10.1186/1472-6963-11-307. [DOI] [PMC free article] [PubMed] [Google Scholar]
- 21.Ojikutu B, Higgins-Biddle M, Greeson D, Phelps BR, Amzel A, Okechukwu E, Kolapo U, Cabral H, Cooper E, Hirschhorn LR. The association between quality of HIV care, loss to follow-up and mortality in pediatric and adolescent patients receiving antiretroviral therapy in Nigeria. PLoS One. 2014;9(7):e100039. doi: 10.1371/journal.pone.0100039. [DOI] [PMC free article] [PubMed] [Google Scholar]
- 22.Taylor MJ, McNicholas C, Nicolay C, Darzi A, Bell D, Reed JE. Systematic review of the application of the plan-do-study-act method to improve quality in healthcare. BMJ Qual Saf. 2014;23(4):290–298. doi: 10.1136/bmjqs-2013-001862. [DOI] [PMC free article] [PubMed] [Google Scholar]
- 23.Testa J, Sinnaeve O, Ibrahim Y, Ayivi B. Evaluation of the quality of screening and management of infant malnutrition in Cotonou, Benin. Med Trop (Mars) 2008;68(1):45–50. [PubMed] [Google Scholar]
- 24.Uganda Bureau of Statistics . National population and housing census 2014. 2016. [Google Scholar]
- 25.Ministry of Health. Uganda Health Management and Information System. Kampala, Uganda.
- 26.Ministry of Health, Uganda. Nutrition service delivery assessment tool for health Centre IV, Health Centre III, and Health Centre II, 2015.
- 27.Consolidated Guidelines for Prevention and Treatment of HIV in Uganda, 2016. Ministry of Health, Uganda, Kampala.
- 28.SPHERE . Sphere project: humanitarian charter and minimum standardsin disaster response. 2011. [DOI] [PubMed] [Google Scholar]
- 29.Kiwanukaa SN, Ekirapaa EK, Petersona S, Okuia O, Hafizur Rahmanc M, Petersc D, Pariyoa GW, Kiwanukaa SN, Ekirapaa EK, Petersona S, Okuia O. Access to and utilisation of health services for the poor in Uganda: a systematic review of available evidence. Trans R Soc Trop Med Hyg. 2008;102:1067–1074. doi: 10.1016/j.trstmh.2008.04.023. [DOI] [PubMed] [Google Scholar]
- 30.Wilunda C, et al. Availability, utilisation and quality of maternal and neonatal health care services in Karamoja region, Uganda: a health facility-based survey. Reprod Health. 2015;12:30. doi: 10.1186/s12978-015-0018-7. [DOI] [PMC free article] [PubMed] [Google Scholar]
- 31.Corbett M, Oman A. Acute Malnutrition in Protracted Refugee Situation:A Global Strategy UNHCR/WFP. 2016. [Google Scholar]
- 32.Doocy S, Tappis H, Haskew C, Wilkinson C, Spiegel P. Performance of UNHCR nutrition programs in post-emergency refugee camps. Confl Health. 2011;5:23. doi: 10.1186/1752-1505-5-23. [DOI] [PMC free article] [PubMed] [Google Scholar]
- 33.Shanka NA, Lemma S, Abyu DM. Recovery rate and determinants in treatment of children with severe acute malnutrition using outpatient therapeutic feeding program in Kamba District, south West Ethiopia. J Nutr Disord Ther. 2015;5(2)
- 34.Yebyo HG, Kendall C, Nigusse D, Lemma W. Outpatient therapeutic feeding program outcomes and determinants in treatment of severe acute malnutrition in Tigray, northern Ethiopia: a retrospective cohort study. PLoS One. 2013;8(6):e65840. doi: 10.1371/journal.pone.0065840. [DOI] [PMC free article] [PubMed] [Google Scholar]
- 35.World Health Organization, editor. The world health report 2006 - working together for health. Geneva: World Health Organisation; 2006. [Google Scholar]
- 36.Sunguya BF, et al. ‘Effectiveness of nutrition training of health workers toward improving caregivers’ feeding practices for children aged six months to two years: a systematic review’. Nutr J. 2013;12:66. doi: 10.1186/1475-2891-12-66. [DOI] [PMC free article] [PubMed] [Google Scholar]
- 37.Kok MC, et al. Which intervention design factors influence performance of community health workers in low- and middle-income countries? A systematic review. Health Policy Plan. 2015;30(9):1207–1227. doi: 10.1093/heapol/czu126. [DOI] [PMC free article] [PubMed] [Google Scholar]
- 38.Black RE, et al. Maternal and child undernutrition: global and regional exposures and health consequences. Lancet. 2008;371(9608):243–260. doi: 10.1016/S0140-6736(07)61690-0. [DOI] [PubMed] [Google Scholar]
- 39.Kiberu VM, Matovu JKB, Makumbi F, Kyozira C, Mukooyo E, Wanyenze RK. Strengthening district-based health reporting through the district health management information software system: the Ugandan experience. BMC Med Inform Decis Mak. 2014;14:40. doi: 10.1186/1472-6947-14-40. [DOI] [PMC free article] [PubMed] [Google Scholar]
- 40.Kintu P, Nanyunja M, Nzabanita A, Magoola R. Development of HMIS in poor countries: Uganda as a case study. Health POLICY Dev. 2005;3:46–53. [Google Scholar]
- 41.Thangasamy P, Gebremichael M, Kebede M, Sileshi M, Elias N, Tesfaye B. A pilot study on district health information software 2: challenges and lessons learned in a developing country: an experience from Ethiopia. Int Res J Eng Technol. 2016;3(5):1646–1651. [Google Scholar]
Associated Data
This section collects any data citations, data availability statements, or supplementary materials included in this article.
Supplementary Materials
Quantitative dataset. (XLSX 57 kb)
Data Availability Statement
The quantitative data generated or analysed during this study are included in this published article as its additional file. Notes from the qualitative data are available from the corresponding author on reasonable request.