

Abstract
Little is known about the global gene expression profile of macrophages in response to changes in size and porosity of silica nanoparticles (SNPs). Spherical nonporous SNPs of two different diameters, and mesoporous spherical SNPs with comparable size were characterized. Reactive oxygen species, mitochondrial membrane potential, lysosome degradation capacity, and lysosome pH were measured to evaluate the influence of nonporous and mesoporous SNPs on mitochondrial and lysosomal function. RNA-sequencing was utilized to generate transcriptional profiles of RAW264.7 macrophages exposed to non-toxic SNP doses. DESeq2, limma, and BinReg2 software were used to analyze the data based on both unsupervised and supervised strategies to identify genes with greatest differences among NP treatments. Utilizing GATHER and DAVID software, possible induced pathways were studied. We found that mesoporous silica nanoparticles are capable of altering gene expression in macrophages at doses that do not elicit acute cytotoxicity, while gene transcription was minimally affected by nonporous SNPs.
Keywords: silica nanoparticles, nanotoxicity, gene expression, gene ontology, lysosome pathway, reactive oxygen species
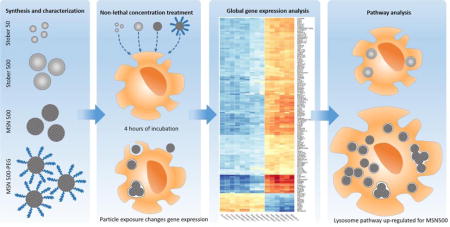
Graphical abstract
Background
Silica nanoparticles (SNPs) have shown potential for use in nanomedicine as imaging agents, drug carriers, and biosensors1–5. To fully exploit this potential, detailed understanding of their toxicity as a function of nanoparticle physicochemical properties is needed. Previous reports have focused on the extent of cellular toxicity, uptake, localization, biodegradation, and in vivo biodistribution of SNPs as a function of size, porosity, geometry, charge, and surface and core chemistry.6–12 We observed cell type and size dependent toxicity of SNPs, with smaller particles showing higher toxicity towards macrophages.13 SNPs mainly accumulate in liver and spleen, with greater accumulations of larger size and higher aspect ratio particles in the lung.14 Surface charge density influences thrombotic and hemolytic events, with positively charged amine-modified SNPs exhibiting higher level of hemolysis compared to negatively charged particles.15 Conventional screening approaches alone do not clearly pinpoint cellular function responses to nanomaterials. Deep sequencing technologies such as RNA-sequencing (RNA-seq) can be utilized to acquire detailed gene expression profiles. Combining RNA-seq with bioinformatics, computational approaches, gene ontology classifications, and database resource for pathway analyses provides a powerful tool to shed light on the mechanisms of toxicity of SNPs.16–18
It is generally accepted that surface area is a predominant factor determining cytotoxicity, where an increase in surface area can correlate with increased cytotoxicity.19 However, we have consistently observed that mesoporous silica nanoparticles with higher surface areas show less cytotoxic effects in RAW 264.7 macrophages compared to nonporous SNPs with less surface areas.15, 20–21 On the other hand, similar size (120±25 nm) mesoporous SNPs compared to nonporous SNPs showed higher toxicity in female CD-1 mice.22 To investigate the reason for this observation, here we have evaluated whole genome expression changes upon RAW 264.7 macrophage exposure to nonporous Stöber SNPs with two different diameters (namely 46 ±4.9 nm and 432 ± 18.7 nm), mesoporous spherical (MSN) (diameter of 466 ±86 nm comparable to 432 ± 18.7 nm for the nonporous Stöber), and surface modified mesoporous SNPs with poly(ethylene glycol) (PEG) attachment using RNA-seq. Li et al, studied HeLa cell death mechanisms induced by free drug doxorubicin (DOX), MSNs, and DOX-loaded, 40–50 nm MSNs using DNA microarray global gene expression analyses. DOX-loaded MSNs showed synergetic necrotic effects with increased reactive oxygen species (ROS) production and induction of the mitochondria-related autophagic lysosomal pathway.23 In a similar study, induced ROS production, inflammatory gene upregulation, and autophagy-mediated necrosis were confirmed in vivo and in vitro for positively charged MSNs with ≥100 nm size in a dose-dependent manner.24 We have studied the influence of size, porosity, specific surface area, and PEGylation of SNPs on RAW 264.7 macrophage gene expression responses at sub-cytotoxic doses. Investigations conducted at sub-cytotoxic doses to evaluate genomic responses to nanoparticles are limited.16, 25 To the best of our knowledge there is no systematic study on the influence of physicochemical properties on global genomic responses in macrophages exposed to silica nanoparticles at the sub-cytotoxic doses. Herein, sub-cytotoxic concentrations of silica nanoparticles were dosed to macrophages to produce transcriptional profiles. The rationale to choose sub-toxic concentrations is to study gene expression responses of cellular defense mechanisms without triggering acute toxicity. There is a lack of a clear understanding of how physicochemical properties of SNPs, their accumulation in lysosomes, change in lysosome activity, subsequent associated ROS production, and mitochondrial membrane potential disruption are interlinked together at sub-cytotoxic level. Evaluating physicochemical properties of SNPs’ influence on gene expression early responses at sub-toxic concentrations would reveal underlying genomic toxicological effects of SNPs before triggering acute toxicity.
Methods
Synthesis, characterization, and cell culture assays
Details of the synthesis and characterization of SNPs, Limulus Amebocyte Lysate test, dosimetry, cell uptake, proliferation, intracellular ROS measurement, mitochondrial membrane potential, lysosomal acidity and lysosome degradation capacity, and adenosine triphosphate (ATP) concentration measurement are described in Supplementary data.
RNA extraction protocol
We chose a sub-cytotoxic dose of half the LC50 of each SNP for gene expression profiling where total RNA was extracted and purified following 4 h of incubation with SNPs using Qiagen RNeasy minikit protocol. The samples were kept at −80 °C until further use. RNA was quantified by Nanodrop spectrophotometer ND-1000 and the RNA samples were assessed for quality using an Agilent 2200 TapeStation prior to expression analysis. All RNA samples had RNA Integrity Numbers (RIN) ranging from 8 to 10. The RNA was stored at −80°C until further use.
mRNA sequencing data acquisition and processing
RNA-seq was performed in the Genomics Core of the University of Utah. The Core generated libraries using Illumina TruSeq RNA Library Prep Kits. HiSeq2000 50 Cycle Single Read Sequencing was performed with a maximum of 8 multiplexed samples per lane to ensure sufficient depth of sequencing. The reads were mapped to the Mus musculus genome using the Ensembl build mm10EnsGene at UCSC. The average number of mapped reads per sample was ~22,473,000 with uniform coverage across the different samples. The data is deposited in the Gene Expression Omnibus under the accession number GSE 101992.
Bioinformatics analysis
The R statistical programming language was used to further process the data. The Biostatistics Core removed genes with <10 counts from the dataset, and used DESeq226 to generate the rlog and normalized FPKM (counts/exonic Bases Per KB/million Total Mapped Reads To Gene Table) values. Rlog values were used to evaluate Euclidean distances among the samples (untreated control, Stöber, Mesoporous and PEGylated-Mesoporous). Pair-wise comparisons among the different treatments were performed with DESeqs log2 ratio to identify genes with a two-fold cutoff difference among the treatment groups with the largest difference being between the mesoporous samples and the control, and clear differences observed between the mesoporous and the other samples. FPKM normalized data was used as input for limma27 (ver. 3.28.21). The BinReg228 algorithm was used to evaluate the probability of segregating the geneset using 1 metagene. The overlap of the genes identified using these various methods for differential expression were compared and all of the genes from the DESeq2 analysis were contained within the limma and BinReg2 gene sets. Insights into pathways involved were performed using DAVID29–30 and GATHER31 for gene ontology analysis. DAVID was used with the default settings. We considered gene ontology categories if they contained >2 genes and had enrichment score over 4.
Results
Synthesis and characterization of SNPs
Nonporous spherical silica nanoparticles (Stöber) of the two different diameters, namely 46 ±4.9 nm and 432 ± 18.7 nm, mesoporous spherical (MSN) with a diameter of 466 ±86 nm comparable to 432 ± 18.7 nm for the nonporous Stöber particles were previously synthesized and stored in ethanol.32 The pristine MSN were further modified with “graft to” attachment method of functionalized poly(ethylene glycol) (PEG) chains of number average molecular weight (Mn) of approximately 10,000 Dalton (reported by manufacturer) to assess the impact of PEGylation on changing gene expression. The physicochemical properties of the SNPs (SEM and TEM shown in Figure 1) are summarized in Table 1.
Figure 1.

Scanning electron microscopy images of (A) Stöber SNPs with average diameter of 46±4.9 nm(Stöber50), (B) Stöber SNPs with average diameter of 432±18.7 nm (Stöber500), (C) mesoporous SNPs with average diameter of 466±86 nm (MSN500), and (D) PEGylated mesoporous SNPs with average diameter of 466±86 nm (MSN500-PEG). Transmission electron microscopy images of (E) Stöber50, (F) Stöber500, (G) MSN500, and (H) MSN500-PEG.
Table 1.
Hydrodynamic diameter, zeta potential, LC50, and nitrogen adsorption–desorption values of SNPs
| Hydrodynamic diameter (nm) | Zeta potential (mV) | TEM | LC50 (μg/ml) | Nitrogen adsorptiondesorption | ||||||||
|---|---|---|---|---|---|---|---|---|---|---|---|---|
| water | RPMI | RPMI and 10% serum | water | RPMI | RPMI and 10% serum | Surface area (m2/g) | External Surface area (m2/g) | Pore size (nm) | Pore volume (cm3/g) | |||
| Stöber 50 * | 108.1±6.3 | 95.52±2.5 | 190.5±4.8 | −40.3±1.9 | −22.7±1.4 | −9.57±0.4 | 46±4.9 | 26.2±2.7 | 186.03 | 178.84 | 13.1 6 | 0.0024 |
| Stöber 500 * | 520.3±4.8 | 497.7±5.3 | 539.7±6.2 | −53.1±1.5 | −32.1±1.1 | −9.48±0.5 | 432±18.7 | 33.7±0.6 | 6.83 | 6.83 | N/A | N/A |
| MSN500 * | 799.8±22.9 | 999±23 | 915±72 | −44±0.8 | −20.4±0.7 | −8.03±0.5 | 466±86 | 223.6±15.6 | 950.09 | 121.86 | 3.05 | 0.5729 |
| MSN500-PEG | 706.5±22.2 | 940±154 | 757±62 | −34.3±0.7 | −15.2±0.7 | −8.56±0.8 | 466±86 | 168.0±16.1 | 526.29 | 55.45 | 2.79 | 0.2837 |
The physicochemical properties of these particles were reported previously.32
Gene expression analysis
Based on LC50 values reported previously,32 we chose a sub-cytotoxic dose of half the LC50 for gene expression profiling. Corresponding halves of the LC50 values for Stöber50, Stöber500, MSN500, and MSN500-PEG are 13.1, 16.85, 111.8, and 84 μg ml−1, respectively. RNA-seq was utilized to measure changes in the levels of transcripts expression. The RNA sequencing created ∼19 Gb of raw sequence data. DESeq2, limma, and BinReg2 statistical methods were used to analyze a large amount of created RNA-seq data and assess quantitative differences and differentially expressed genes between different particles. DESeq2 analysis of the gene expression for samples demonstrated that the untreated control, nonporous Stöber50, and Stöber500 displayed similar transcriptional profiles. In contrast, mesoporous MSN500 and PEGylated particles elicited explicit transcriptional effects (Figure 2A). In the heat maps shown in Figure 2, the heat map colors are indicative of the Euclidean distance between the expression profiles. Based on the clear separation of mesoporous particles, compared with untreated control and Stöber particles, limma was used to determine differential gene expression, and 618 genes were identified as differentially expressed with an adjusted p <10−6. To determine if the 618 gene set could represent a gene signature that differentiated the mesoporous particles from the untreated control and Stöber particles, BinReg228 was used to evaluate the probability of segregating the geneset using 1 metagene and demonstrated that there was high probability that the metagene could distinguish these data (Figure 2B). DESeq2 analysis of differential expression using a 2-fold cut-off overlapped entirely with the limma and BinReg2 analysis. We focused on these DESeq2 gene sets for gene ontology analysis. Mesoporous MSN500 and PEGylated MSN500 established 192 and 136 gene expression changes compared to control, respectively. The heat map (Figure 2C and Figure S2) illustrates the gene symbol up-regulated or down-regulated for each SNPs relative to control in terms of the fold-change values. Mesoporous MSN500 SNPs compared with control samples triggered 192 gene expression changes, for which a total of 153 genes were up-regulated and 39 genes down-regulated (Tables 2 and 3, complete list in Tables S2 and S3).
Figure 2.

Raw264.7 macrophages exposed to sub-cytotoxic doses of SNPs with diverse physicochemical properties showed different gene expression responses. (A) Heat map of the gene expression response generated based on RNA sequencing revealed no genomic alteration for nonporous SNPs, independent from their size, however, mesoporous SNPs and PEGylated mesoporous SNPs elicited 192 and 136 gene expression changes compared to control, respectively. The heat map provides the Euclidean distances in gene-space with red rectangles representing minimal expression differences in gene-space, while blue rectangles indicate more extensive expression differences in gene-space. (B) BinReg2 analysis evaluating the probability of segregating the geneset. The scatter plot shows the predictions from the signature for each sample. On the Y-axis, high probabilities indicate that the gene expression profile of the sample better resembles the mesoporous group, while low probabilities indicate a closer resemblance to control and Stöber group. The blue and red circles are the predictions (from leave-one-out cross-validation) on the control and mesoporous samples, respectively. The error bars show the 95% credible interval. The X-axis, the Metagene Score, is the magnitude of the sample on the first principal component. This is used to help separate the samples across the plot. (C) The top 20 differentially expressed genes between SNPs and control groups in RAW264.7 macrophages. Darker red indicates increased gene expression (fold change) for each gene, white colors indicates no expression alteration, and darker blue color indicates lower gene expression (fold change) for each gene corresponding to each specimen.
Table 2.
The top 20 differentially expressed up-regulated genes between control groups and MSN500 in RAW264.7 macrophages
| The top 20 differentially expressed up-regulated genes between MSN500 and control groups in RAW264.7 macrophages | |||
|---|---|---|---|
| Sequence name | Associated Gene Name | Annotation | Lg2Rto Control_MSN500 |
| ENSMUSG00000089945 | Pakap | paralemmin A kinase anchor protein [Source:MGI Symbol;Acc:MGI:5141924] | −3.16 |
| ENSMUSG00000038729 | Akap2 | A kinase (PRKA) anchor protein 2 [Source:MGI Symbol;Acc:MGI:1306795] | −3.16 |
| ENSMUSG00000062515 | Fabp4 | fatty acid binding protein 4, adipocyte [Source:MGI Symbol;Acc:MGI:88038] | −3.14 |
| ENSMUSG00000028238 | Atp6v0d2 | ATPase, H+ transporting, lysosomal V0 subunit D2 [Source:MGI Symbol;Acc:MGI:1924415] | −3.05 |
| ENSMUSG00000020017 | Hal | histidine ammonia lyase [Source:MGI Symbol;Acc:MGI:96010] | −2.78 |
| ENSMUSG00000050390 | C77080 | expressed sequence C77080 [Source:MGI Symbol;Acc:MGI:2140651] | −2.76 |
| ENSMUSG00000044468 | Fam46c | family with sequence similarity 46, member C [Source:MGI Symbol;Acc:MGI:1921895] | −2.71 |
| ENSMUSG00000058046 | 4933430I17Rik | RIKEN cDNA 4933430I17 gene [Source:MGI Symbol;Acc:MGI:3045314] | −2.63 |
| ENSMUSG00000003882 | Il7r | interleukin 7 receptor [Source:MGI Symbol;Acc:MGI:96562] | −2.56 |
| ENSMUSG00000064267 | Hvcn1 | hydrogen voltage-gated channel 1 [Source:MGI Symbol;Acc:MGI:1921346] | −2.25 |
| ENSMUSG00000028121 | Bcar3 | breast cancer anti-estrogen resistance 3 [Source:MGI Symbol;Acc:MGI:1352501] | −2.15 |
| ENSMUSG00000062082 | Cd200r4 | CD200 receptor 4 [Source:MGI Symbol;Acc:MGI:3036289] | −2.14 |
| ENSMUSG00000079625 | Tm4sf19 | transmembrane 4 L six family member 19 [Source:MGI Symbol;Acc:MGI:3645933] | −2.09 |
| ENSMUSG00000028278 | Rragd | Ras-related GTP binding D [Source:MGI Symbol;Acc:MGI:1098604] | −1.96 |
| ENSMUSG00000007682 | Dio2 | deiodinase, iodothyronine, type II [Source:MGI Symbol;Acc:MGI:1338833] | −1.94 |
| ENSMUSG00000026981 | Il1rn | interleukin 1 receptor antagonist [Source:MGI Symbol;Acc:MGI:96547] | −1.93 |
| ENSMUSG00000097328 | Tnfsf12 | tumor necrosis factor (ligand) superfamily, member 12 [Source:MGI Symbol;Acc:MGI:1196259] | −1.89 |
| ENSMUSG00000079049 | Serpinb1c | serine (or cysteine) peptidase inhibitor, clade B, member 1c [Source:MGI Symbol;Acc:MGI:2445363] | −1.89 |
| ENSMUSG00000011008 | Mcoln2 | mucolipin 2 [Source:MGI Symbol;Acc:MGI:1915529] | −1.86 |
| ENSMUSG00000018752 | Tnfsfm13 | tumor necrosis factor (ligand) superfamily, membrane-bound member 13 [Source:MGI Symbol;Acc:MGI:3845075] | −1.80 |
Table 3.
The top 20 differentially expressed down-regulated genes between control groups and MSN500 in RAW264.7 macrophages
| The top 20 differentially expressed down-regulated genes between MSN500 and control groups in RAW264.7 macrophages | |||
|---|---|---|---|
| Sequence name | Associated Gene Name | Annotation | Lg2Rto Control_MSN500 |
| ENSMUSG00000035493 | Tgfbi | transforming growth factor, beta induced [Source:MGI Symbol;Acc:MGI:99959] | 2.48 |
| ENSMUSG00000040093 | Bmf | BCL2 modifying factor [Source:MGI Symbol;Acc:MGI:2176433] | 2.21 |
| ENSMUSG00000048424 | Ranbp3l | RAN binding protein 3-like [Source:MGI Symbol;Acc:MGI:2444654] | 1.99 |
| ENSMUSG00000032420 | Nt5e | 5′ nucleotidase, ecto [Source:MGI Symbol;Acc:MGI:99782] | 1.91 |
| ENSMUSG00000007655 | Cav1 | caveolin 1, caveolae protein [Source:MGI Symbol;Acc:MGI:102709] | 1.56 |
| ENSMUSG00000027848 | Olfml3 | olfactomedin-like 3 [Source:MGI Symbol;Acc:MGI:1914877] | 1.47 |
| ENSMUSG00000024975 | Pdcd4 | programmed cell death 4 [Source:MGI Symbol;Acc:MGI:107490] | 1.42 |
| ENSMUSG00000079243 | Xirp1 | xin actin-binding repeat containing 1 [Source:MGI Symbol;Acc:MGI:1333878] | 1.40 |
| ENSMUSG00000026826 | Nr4a2 | nuclear receptor subfamily 4, group A, member 2 [Source:MGI Symbol;Acc:MGI:1352456] | 1.40 |
| ENSMUSG00000021575 | Ahrr | aryl-hydrocarbon receptor repressor [Source:MGI Symbol;Acc:MGI:1333776] | 1.39 |
| ENSMUSG00000034783 | Cd207 | CD207 antigen [Source:MGI Symbol;Acc:MGI:2180021] | 1.36 |
| ENSMUSG00000030737 | Slco2b1 | solute carrier organic anion transporter family, member 2b1 [Source:MGI Symbol;Acc:MGI:1351872] | 1.34 |
| ENSMUSG00000020092 | Pald1 | phosphatase domain containing, paladin 1 [Source:MGI Symbol;Acc:MGI:1351623] | 1.28 |
| ENSMUSG00000030162 | Olr1 | oxidized low density lipoprotein (lectin-like) receptor 1 [Source:MGI Symbol;Acc:MGI:1261434] | 1.27 |
| ENSMUSG00000047180 | Neurl3 | neuralized E3 ubiquitin protein ligase 3 [Source:MGI Symbol;Acc:MGI:2429944] | 1.27 |
| ENSMUSG00000050777 | Tmem37 | transmembrane protein 37 [Source:MGI Symbol;Acc:MGI:2157899] | 1.26 |
| ENSMUSG00000022123 | Scel | sciellin [Source:MGI Symbol;Acc:MGI:1891228] | 1.26 |
| ENSMUSG00000022656 | Nectin3 | nectin cell adhesion molecule 3 [Source:MGI Symbol;Acc:MGI:1930171] | 1.24 |
| ENSMUSG00000074361 | C5ar2 | complement component 5a receptor 2 [Source:MGI Symbol;Acc:MGI:2442013] | 1.22 |
| ENSMUSG00000006445 | Epha2 | Eph receptor A2 [Source:MGI Symbol;Acc:MGI:95278] | 1.21 |
Gene Ontology enrichment analysis
Online resources, DAVID and GATHER, were used to classify up-regulated and down-regulated genes into GO functional categories. Considering genes with greater than 2-fold change, presence of at least 2 genes in each category, p<0.01, and Bayes factor over 4, we identified the following statistically significant categories: mesoporous silica nanoparticles upregulated genes that affect “proteolysis and peptidolysis”, “nucleobase, nucleoside, nucleotide, and nucleic acid metabolic processes”, “alcohol metabolism”, “hydrogen transport”, and “transition metal ion transport”, and downregulated genes that affect “xenobiotic metabolism”, and “negative regulation of physiological process” (Figure 3A,B).
Figure 3.

Raw264.7 macrophages were exposed to half LC50 dose of MSN500 for 4h, and RNA sequencing was used to determine gene expression profile compared with control samples. Genes with at least 2 fold changes were deposited in the DAVID and GATHER on-line database to generate gene ontology classification based on up-regulation or down-regulation. Statistically significant categories were determined considering genes with presence of at least 2 genes in each category, p<0.01, and Bayes factor over 4. (A) Functional categories for up-regulated genes. (B) Functional categories for down-regulated genes. Correlating genes of each category is shown in parentheses. (C) KEGG pathway analysis demonstrated central part of lysosome pathways up-regulation by the MSN500 SNPs in RAW264.7 cells. Genes with expression changes are highlighted with the asterisks.
Kyoto encyclopedia of genes and genomes (KEGG) pathway analysis
KEGG pathway analysis was used to study cellular processes correlating to the differentially expressed genes obtained from RNA sequencing. Plugging in our data to GATHER on-line data base provided the lysosome pathway up-regulation by the MSN500 SNPs. Central part of lysosome pathway is depicted in Figure 3C. No significant gene expression changes resulting from Stöber500 SNPs on cellular processes were detected. Asterisks on name of genes related to lysosome pathway in Figure 3 recognize genes were altered by treating macrophages with mesoporous MSN500 SNPs.
Validation of gene expression by real-time quantitative PCR
To validate alterations in gene expression levels revealed by RNA sequencing, real-time quantitative PCR (qPCR) was used from independent RNA extractions for selected genes. Since commonly used genes like Gapdh and Psmb6 appeared to be variable based on the RNA sequencing, Ugt1a6b gene, which did not display alterations in the RNA sequencing expression data, was used as a control gene to normalize the relative expression levels of our genes of interest. qPCR analysis confirmed that the treatment of macrophages with mesoporous MSN500 SNPs, gene expression of Atp6v0d2, Slc39a2, Tnfsf13, and Hvcn1 were significantly increased (Figure 4).
Figure 4.

qPCR analysis confirmed that by treatment of macrophages with mesoporous MSN500 SNPs, gene expressions of Atp6v0d2, Slc39a2, Tnfsf13, and Hvcn1 were significantly increased. Data are expressed as mean ± S.D. from (n = 3), ** P <0.01 and *** P <0.001.
Effect of nonporous and mesoporous SNPs on proliferation index and ATP synthesis
The rate of cellular proliferation following macrophage treatment was quantified with EdU incorporation as indicators of particle toxicity measuring the DNA synthesis. No statistically significant difference in rate of cell proliferation was detected compared with control for MSN500 up to highest concentration of 112 μg/ml (Figure 5). Although cells treated with mesoporous SNPs retained their ability to proliferate to the highest concentration, nonporous Stöber500 SNPs showed significantly decreased cell proliferation at 112 μg/ml. All treatments up to 4h of different chosen concentrations of 17, 33, 52, and 112 μg/ml could be considered sub-cytotoxic, with the exception of nonporous Stöber500 at 112 μg/ml concentrations which induced acute cytotoxicity.32
Figure 5.
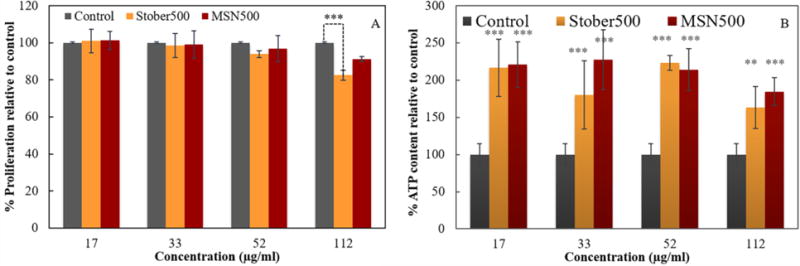
(A) A Click-iT EdU assay was utilized to incorporate EdU to DNA during synthesis by Click chemistry. Fluorescent detection correlated with rate of cell proliferation. While all concentrations could be considered sub-cytotoxic for MSN500, nonporous Stöber500 at 112 μg/ml concentrations induced acute cytotoxicity in RAW264.7 macrophages. (B) A luminescence-based ATP concentration determination assay showed increased ATP synthesis for treated cells compared against non-treated control samples. Data are expressed as mean ± S.D. from (n = 3), ** P <0.01 and *** P <0.001.
Since the gene expression profile results provide evidence that ATP synthesis is up-regulated by treatment of macrophages with SNPs, ATP synthesis was assessed with a luminescence-based ATP concentration assay. Cells exposed to different concentrations of SNPs compared to non-treated control samples, showed significant increased levels of ATP (Figure 5B). These results indicate that treated cells did not experience acute cytotoxicity and they could produce ATP required for membrane deformation, particle uptake, protein synthesis, and required metabolic activities. However, the ATP synthesis of nonporous Stöber500 at the highest concentration showed the lowest level of increase, which directly correlates with attenuated proliferation rate. These results suggest that high concentration treatment with nonporous Stöber500 disturbs ATP synthesis of mitochondrial function. Previously it was reported that SNPs induce mitochondrial damage through ROS production.33–34 Mitochondria inherently produce ROS, and utilize intrinsic antioxidant system for ROS metabolism. Oxidative stress induced by SNPs could facilitate lipid peroxidation in highly metabolically active organelles such as mitochondria.35–37
ROS production measurement and mitochondrial membrane potential (MMP) disruption determination
To investigate the intracellular ROS production induced by SNPs, DCFH-DA was used to determine intracellular H2O2 levels. Figure 6A shows DCF fluorescence intensity measured by flow cytometry in RAW264.7 treated with porous and nonporous SNPs. No significant alteration in intracellular ROS production in different concentrations either with porous or nonporous SNPs was detected. MitoSOX™ fluorescence intensity measured by flow cytometry for mitochondrial ROS production determination detected statistically significant mitochondrial ROS production difference only for nonporous Stöber500 at 112μg/ml. Similarly, the disruption of the MMP, as measured by JC-1, also manifested with the same trend. This could be detected by overall intracellular and mitochondrial ROS enhanced production which consequently leads to increased green-fluorescent JC-1 monomer potentials and decreased red-fluorescent JC-1 aggregate, indicating mitochondria depolarized membrane. Mesoporous MSN500 SNPs did not cause an increase in green monomer fluorescence, or decrease of aggregated red fluorescence, suggesting MSN500 had no effect on MMP. Similar observations were made for nonporous Stöber SNPs up to 112μg/ml concentration. Results suggest that there was no significant increase in intracellular and mitochondrial ROS (Figure 6). Subsequently, no influence and disruption were observed for MMP.
Figure 6.

ROS production and disruption of MMP induced by SNPs. (A) FCM quantification of the fluorescence emitted from DCFH-DA probe upon oxidation for the detection of intracellular H2O2. Treatment of macrophages did not induce any significant intracellular ROS. (B) Mitochondrial ROS measurement using MitoSOX™ via FCM. Statistically significant Mitochondrial ROS production were detected only for nonporous Stöber500 at 112μg/ml. (C) The MMP quantification using the JC-1fluorescent probe. Nonporous Stöber500 at 112μg/ml concentration results in disruption of MMP, but other concentrations for both nonporous and mesoporous particles do not disrupt the MMP. JC-1 fluoresces red when the mitochondrion is normally polarized, while green means mitochondrial potential has been depolarized. Positive control carbonyl cyanide 3-chlorophenylhydrazone (CCCP) at 25μM disrupts the MMP. CCCP, and Nonporous Stöber500 at 112μg/ml showed significantly different MMP loss compared to the control samples. (D) The representative FCM scatter plots of JC-1. Green fluorescence of depolarized mitochondrial potential is distributed in the bottom right-hand area, while red fluorescence of normally polarized mitochondrion is distributed in the upper right-hand area. Data are expressed as mean ± S.D. from (n = 3), ** P <0.01 and *** P <0.001.
Lysosome degradation capacity and lysosome pH measurement
The influence of SNPs exposure on diminishing lysosome degradation capacity of macrophages was explored using DQ-BSA, a self-quenched bovine serum albumin lysosome degradation indicator. Upon DQ-BSA hydrolysis in active lysosomes, the BSA quenching is alleviated and bright fluorescent is emitted from the fluorescent probe within lysosomes.38 Significant attenuation of lysosome degradation capacity at high doses of both nonporous Stöber500 and mesoporous MSN500 SNPs was observed (Figure 7). To further investigate the influence of SNPs on lysosomes, we measured the lysosome pH upon SNP treatment. Acidotropic LysoSensor Green DND-189 shows a pH-dependent fluorescence intensity decrease upon alkalinization of lysosomes.38–39 Flow cytometric analysis demonstrated a correlation between the concentration of MSN500 SNPs and lysosome alkalization (Figure 7C,D). Increased MSN500 SNP concentration treatment caused increase of lysosomal pH, however, Stober500 SNPs did not significantly affect lysosome pH up to 52 μg/ml.
Figure 7.

Lysosome degradation capacity and lysosome pH induction by porous and nonporous SNPs. Stober17, Stober33, Stober52, Stober112, MSN17, MSN33, MSN52, and MSN112 correlates to Stober500 and MSN500 SNPs treatment with increased concentration from 17 to 112 μg/ml. (A) DQ-BSA analysis of lysosomal activity by confocal microscope imaging. RAW264.7 macrophages were incubated for 4 h with medium as control or with different concentrations of SNPs. Control sample presented bright fluorescent fragments, demonstrating active lysosomal degradation capacity of DQ-BSA. Fluorescent signal diminished by increased concentrations in both types of SNPs indicating decreased lysosomal proteolysis activity. (B) Fluorescence intensity quantified by densitometry (IOD) from at least 45 cells in each replicate (n=3). (C) Impact of SNPs treatment on lysosome pH measured by flow cytometry using LysoSensor Green DND-189 revealed dose dependent lysosome alkalinization only by mesoporous particles. (D) Lysosensor fluorescence intensity overlap in which Control is grey, MSN112 is the dashed line, and Stober112 is the solid line. Shift to lower intensities, indicates decrease of lysosome pH. Statistically significant differences were observed in toxic concentrations of Stöber500 and sub-cytotoxic concentrations of MSN500. Data are expressed as mean ± S.D. from (n = 3). *** P <0.001.
Cell uptake and association of nanoparticles
Cellular association of SNPs were measured by ICP-MS (Figure S3A). We assessed cellular internalization of SNPs by TEM (Figure 8). To further confirm cellular internalization, S/TEM and elemental maps were examined (Figure S4). TEM images demonstrate SNPs were trapped in vesicles in the cytosol of macrophages. From these results, we conclude that the observed genomic alteration for MSN500 with sub-cytotoxic dosing is a result of indirect mechanisms. We did not observe any free particles outside of the vesicles located in the cytosol. It is known that SNPs are directed to the lysosome and due to limited biodegradability remain through late stage lysosomal digestion, and finally a portion could be released into the cytoplasm.40–41 Dose-dependent increases of cellular association of SNPs in both types of nanoparticles have been observed. ICP-MS data could not differentiate cellular association of internalized particles, from particles adhered to cell membrane. However, TEM imaging reveals higher number of Stöber500 particles were attached to the outer section of cell membrane compared to MSN500 particles. It is noteworthy that internalization of a higher number of MSN500 SNPs was sub-cytotoxic compared to Stöber500, and resulted in enlargement of macrophages. Stöber500 particles were attached to the cell membrane, while lower density and a higher number of MSN500 particles in the same mass concentration were observed in enlarged cells.41
Figure 8.

TEM images of RAW264.7 cells treated with media (control) or treated with different concentrations of porous and nonporous SNPs for 4 h. The SNPs were taken up by cells and localized inside vesicles. Dose-dependent increase of cellular association of SNPs in both types of nanoparticles is visualized. Red arrows point particles inside cells. Particles were not observed inside the nucleus.
Discussion
The cellular uptake of SNPs, prolonged accumulation in cells due to inability to digest them, and intracellular ROS generation have been described as main reasons of cytotoxicity and genotoxicity.42–46 However, the basis of genomic toxicity in relation to physicochemical properties at sub-cytotoxic doses has not been examined. The rationale for choosing nonporous Stöber 50 and 500 nm, mesoporous 500 nm, and mesoporous 500 nm PEGylated particles was to study the effect of size, porosity, and PEGylation on gene expression early response at sub-cytotoxic concentrations. The sub-cytotoxic dose in this study is defined as a dose that does not induce acute cytotoxicity in RAW264.7 macrophages (half of the LC50) (Figure S5). Gene expression analysis showed mesoporous MSN500 and PEGylated MSN500 established 192 and 136 gene expression changes compared to control. Minimal genomic alteration for nonporous SNPs, independent from their size was detected. Once we identified genes subjected to change by exposure to SNPs, to attain better understanding of functional changes, gene ontology analysis was used to classify transcriptional changes into functional categories. Gene Ontology enrichment and KEGG pathway analyses demonstrate lysosome pathway up-regulation by the MSN500 particles. The lysosomal upregulation determined by KEGG pathway analysis for the MSN500 SNPs can occur through three main approaches of phagocytosis, endocytosis, and autophagic lysosome processes.47 Any possible damage to organelles in cytosol of cells due to presence of SNPs could up-regulate lysosome pathway by activation of autophagosome formation which subsequently merge with lysosomes to form autophagolysosomes. Validation of gene expression by real-time quantitative PCR showed a direct correlation between increases in MSN500 concentration and expression amplification of related genes. Expression levels of Atp6v0d2 and Slc39a2 genes by Stöber500 SNP treatment were not significantly changed compared to control, while we observed a decrease in expression levels of Tnfsf13 and Hvcn1 genes by an increase in Stöber500 concentration. ROS production measurement and MMP disruption determination demonstrated that no significant alteration in intracellular ROS production or mitochondria depolarized membrane was detected for either porous or nonporous SNPs. This indicates mesoporous MSN500 SNPs at doses as high as 112μg/ml, did not exhibit any acute toxicity, incremented ROS production, or MMP disruption, and modified gene expression independent of the well-known ROS induction mechanism. Mitochondrial damage signs such as mitochondria inner structure disintegration, mitochondrial swelling, and cristae rupturing were not detected in TEM images. Mitochondrial structure of cells treated with MSN500 SNPs were intact, similar to non-treated control cells (data not shown). Generally, increased ROS and subsequent MMP loss is described as signs for mitochondria-dependent apoptosis. However, the loss of MMP and mitochondria structural disintegration could not guarantee induction of mitochondria-dependent apoptosis or apoptosis-related gene over expression.17
Previously we conducted detailed studies on the extent and type of protein adsorption on the same SNPs as a function of physicochemical properties (size, porosity), and the role this might play on mechanisms of cellular uptake and toxicity in the same cell line and under the same incubation conditions as the current study. We analyzed the effect of different physiochemical properties of SNPs on protein adsorption, toxicity and uptake by RAW macrophages. In addition, the influence of the presence and absence of serum on toxicity, cell membrane integrity, cell uptake, and mechanism of uptake was studied.32 These studies revealed that protein corona composition recovered from each nanoparticle is almost the same with very slight differences. In addition, the mechanism of uptake was highly dependent on size rather than porosity or the adsorbed proteins. The difference of gene expression between Stober500 and MSN500 elucidated in the current study hence is unlikely to be related to protein corona composition or mechanism of uptake. Generally, lower density of porous particles and increased volume to mass ratio compared to solid nonporous particles induced the higher lysosomal activity affecting gene expression.
Although mesoporous MSN500 SNPs at the sub-cytotoxic dose of 112μg/ml exhibited significant impairment of lysosome degradation capacity, nonporous Stöber SNPs at sub-cytotoxic doses of 17μg/ml did not induce any impairment. These results are consistent with the RNA sequencing results that showed primarily MSN500 gene expression profile was changed. From these data, we conclude that MSN500 SNPs at sub-cytotoxic dose treatment causes impairment of lysosome degradation capacity, while Stöber SNPs at sub-cytotoxic dose did not affect lysosome degradation capacity. In addition, lysosome pH changes by SNP treatment indicates that increased MSN500 SNP concentration treatment causes increase of lysosomal pH, however, Stober500 SNPs did not significantly affect lysosome pH. As shown in KEGG pathway analysis (Figure 3C), the ATPeV gene expression in the case of MSN500 treatment was induced. In addition, GO classification (Figure 3A,B) categorized significantly increased expression of 4 genes involved in proton transport (Atp6v0a1 Atp6v0d2 Atp6v1c1 Atp6v1d) in Raw264.7 macrophages exposed to sub-cytotoxic half LC50 dose of MSN500 for 4h. These vacuolar H+(V)-ATPase genes regulate lysosome acidification utilizing membrane-associated and a peripherally associated protein complex of Vo and V1, respectively. Alteration in levels of Vo or V1 protein complex expression could potentially disrupt association of the V1 protein from the Vo protein which leads to down-regulation of the V-ATPase activity.38, 48–49 From these data, we conclude that MSN500 SNPs in sub-cytotoxic doses induce early lysosome alkalization by influencing Vo and V1 protein complexes of vacuolar H+(V)-ATPase expression levels.
We have shown that MSN induces lysosome pathway activation and lysosome impairment in sub-cytotoxic doses. This is an important finding in that most research considers sub-cytotoxic doses of nanoparticles to be non-toxic and inert, however, herein we observed genomic and phenotypic alteration by sub-cytotoxic dosing of MSN. Differences in density of particles and surface silanol density of SNPs changed the gene expression profile with the cells taking-up more MSN500 particles leading to activation of the lysosomal pathway. These results demonstrate that it is also possible to tune the physicochemical properties of nanoparticles to intentionally prevent or induce a gene expression response, in diverse applications requiring absence or presence of cytotoxicity or genomic responses. For example, lysosomal dysfunction normally leads to lysosomal storage diseases, categorized by progressive neurodegenerative and mental deterioration, caused by mutations in the genes encoding lysosomal enzymes responsible for breaking down the contents of the lysosome.50 As a result of failure to digest the internalized materials, accumulation of non-degraded substances within the lysosomes can cause lysosomal storage disorders with limited or no approved treatment. Knowing MSN particles induce lysosome pathway activation and lysosome impairment in macrophages without associated ROS production, or MMP disruption at sub-cytotoxic doses could be useful to facilitate intentional modulation of lysosomal activity. IN summary we investigated the influence of size, porosity, and surface functionality of SNPs on toxicity and genomic response, utilizing RNA-seq and computational approaches. We found that nonporous particles, independent of their size, did not change gene expression levels, despite displaying higher cytotoxicity at comparable doses. However, comparable size mesoporous silica nanoparticles with nonporous Stöber particles showed gene expression alterations at sub-cytotoxic doses that do not elicit acute cytotoxicity. These results provide additional guidelines for safe and effective use of silica nanoparticles in biomedical applications.
Supplementary Material
Highlights.
-
-
Mesoporous particles altered gene expression, while nonporous particles did not induce gene expression within 4 hrs.
-
-
Lysosomal pathway activated by mesoporous particles.
-
-
No significant alteration in intracellular ROS production, mitochondrial membrane potential disruption, and mitochondrial damage, either with porous or nonporous SNPs were detected.
-
-
Gene expression modulation by physicochemical properties modification without induction of acute toxicity were observed.
Acknowledgments
Support from the National Institute of Environmental Health Sciences of the NIH (R01ES024681) and the University of Utah College of Pharmacy Skaggs Graduate Research Fellowship (Mostafa Yazdimamaghani) is acknowledged. This work made use of the University of Utah shared facilities of the Micron Microscopy Suite and the University of Utah USTAR shared facilities supported in part by the MRSEC Program of the NSF under Award No. DMR-1121252. We also acknowledge the use of core facilities (genomics and bioinformatics) supported by a National Cancer Institute Cancer Center Support Grant (grant number P30 CA042014) awarded to Huntsman Cancer Institute.
Footnotes
Publisher's Disclaimer: This is a PDF file of an unedited manuscript that has been accepted for publication. As a service to our customers we are providing this early version of the manuscript. The manuscript will undergo copyediting, typesetting, and review of the resulting proof before it is published in its final citable form. Please note that during the production process errors may be discovered which could affect the content, and all legal disclaimers that apply to the journal pertain.
References
- 1.Lu J, Liong M, Li Z, Zink JI, Tamanoi F. Biocompatibility, biodistribution, and drug‐ delivery efficiency of mesoporous silica nanoparticles for cancer therapy in animals. Small. 2010;6(16):1794–1805. doi: 10.1002/smll.201000538. [DOI] [PMC free article] [PubMed] [Google Scholar]
- 2.Kim J, Kim HS, Lee N, Kim T, Kim H, Yu T, Song IC, Moon WK, Hyeon T. Multifunctional uniform nanoparticles composed of a magnetite nanocrystal core and a mesoporous silica shell for magnetic resonance and fluorescence imaging and for drug delivery. Angewandte Chemie International Edition. 2008;47(44):8438–8441. doi: 10.1002/anie.200802469. [DOI] [PubMed] [Google Scholar]
- 3.Rieter WJ, Kim JS, Taylor KM, An H, Lin W, Tarrant T, Lin W. Hybrid silica nanoparticles for multimodal imaging. Angewandte Chemie International Edition. 2007;46(20):3680–3682. doi: 10.1002/anie.200604738. [DOI] [PubMed] [Google Scholar]
- 4.Tapec R, Zhao XJ, Tan W. Development of organic dye-doped silica nanoparticles for bioanalysis and biosensors. Journal of Nanoscience and Nanotechnology. 2002;2(3–4):405–409. doi: 10.1166/jnn.2002.114. [DOI] [PubMed] [Google Scholar]
- 5.Tu HL, Lin YS, Lin HY, Hung Y, Lo LW, Chen YF, Mou CY. In vitro studies of functionalized mesoporous silica nanoparticles for photodynamic therapy. Advanced Materials. 2009;21(2):172–177. [Google Scholar]
- 6.Tang F, Li L, Chen D. Mesoporous silica nanoparticles: synthesis, biocompatibility and drug delivery. Advanced Materials. 2012;24(12):1504–1534. doi: 10.1002/adma.201104763. [DOI] [PubMed] [Google Scholar]
- 7.Herd H, Daum N, Jones AT, Huwer H, Ghandehari H, Lehr CM. Nanoparticle geometry and surface orientation influences mode of cellular uptake. ACS nano. 2013;7(3) doi: 10.1021/nn304439f. [DOI] [PMC free article] [PubMed] [Google Scholar]
- 8.Tarn D, Ashley CE, Xue M, Carnes EC, Zink JI, Brinker CJ. Mesoporous silica nanoparticle nanocarriers–biofunctionality and biocompatibility. Accounts of chemical research. 2013;46(3):792. doi: 10.1021/ar3000986. [DOI] [PMC free article] [PubMed] [Google Scholar]
- 9.Meng H, Mai WX, Zhang H, Xue M, Xia T, Lin S, Wang X, Zhao Y, Ji Z, Zink JI. Co-delivery of an optimal drug/siRNA combination using mesoporous silica nanoparticle to overcome drug resistance in breast cancer in vitro and in vivo. ACS nano. 2013;7(2):994. doi: 10.1021/nn3044066. [DOI] [PMC free article] [PubMed] [Google Scholar]
- 10.Malvindi MA, De Matteis V, Galeone A, Brunetti V, Anyfantis GC, Athanassiou A, Cingolani R, Pompa PP. Toxicity assessment of silica coated iron oxide nanoparticles and biocompatibility improvement by surface engineering. PLoS One. 2014;9(1):e85835. doi: 10.1371/journal.pone.0085835. [DOI] [PMC free article] [PubMed] [Google Scholar]
- 11.Yildirim A, Ozgur E, Bayindir M. Impact of mesoporous silica nanoparticle surface functionality on hemolytic activity, thrombogenicity and non-specific protein adsorption. Journal of Materials Chemistry B. 2013;1(14):1909–1920. doi: 10.1039/c3tb20139b. [DOI] [PubMed] [Google Scholar]
- 12.Hadipour Moghaddam SP, Saikia J, Yazdimamaghani M, Ghandehari H. Redox-Responsive Polysulfide-Based Biodegradable Organosilica Nanoparticles for Delivery of Bioactive Agents. ACS Applied Materials & Interfaces. 2017 doi: 10.1021/acsami.7b04351. [DOI] [PMC free article] [PubMed] [Google Scholar]
- 13.Malugin A, Herd H, Ghandehari H. Differential toxicity of amorphous silica nanoparticles toward phagocytic and epithelial cells. Journal of Nanoparticle Research. 2011;13(10):5381. [Google Scholar]
- 14.Yu T, Hubbard D, Ray A, Ghandehari H. In vivo biodistribution and pharmacokinetics of silica nanoparticles as a function of geometry, porosity and surface characteristics. Journal of controlled release. 2012;163(1):46–54. doi: 10.1016/j.jconrel.2012.05.046. [DOI] [PMC free article] [PubMed] [Google Scholar]
- 15.Yu T, Malugin A, Ghandehari H. Impact of silica nanoparticle design on cellular toxicity and hemolytic activity. ACS nano. 2011;5(7):5717–5728. doi: 10.1021/nn2013904. [DOI] [PMC free article] [PubMed] [Google Scholar]
- 16.Feliu N, Kohonen P, Ji J, Zhang Y, Karlsson HL, Palmberg L, Nyström A, Fadeel B. Next-generation sequencing reveals low-dose effects of cationic dendrimers in primary human bronchial epithelial cells. ACS nano. 2014;9(1):146–63. doi: 10.1021/nn5061783. [DOI] [PubMed] [Google Scholar]
- 17.Shim W, Paik MJ, Nguyen D-T, Lee J-K, Lee Y, Kim J-H, Shin E-H, Kang JS, Jung H-S, Choi S. Analysis of changes in gene expression and metabolic profiles induced by silica-coated magnetic nanoparticles. ACS nano. 2012;6(9):7665–7680. doi: 10.1021/nn301113f. [DOI] [PubMed] [Google Scholar]
- 18.Klaper R, Arndt D, Bozich J, Dominguez G. Molecular interactions of nanomaterials and organisms: defining biomarkers for toxicity and high-throughput screening using traditional and next-generation sequencing approaches. Analyst. 2014;139(5):882–895. doi: 10.1039/c3an01644g. [DOI] [PubMed] [Google Scholar]
- 19.Kim I-Y, Joachim E, Choi H, Kim K. Toxicity of silica nanoparticles depends on size, dose, and cell type. Nanomedicine: Nanotechnology, Biology and Medicine. 2015;11(6):1407–1416. doi: 10.1016/j.nano.2015.03.004. [DOI] [PubMed] [Google Scholar]
- 20.Lehman SE, Morris AS, Mueller PS, Salem AK, Grassian VH, Larsen SC. Silica nanoparticle-generated ROS as a predictor of cellular toxicity: mechanistic insights and safety by design. Environmental Science: Nano. 2016;3(1):56–66. doi: 10.1039/C5EN00179J. [DOI] [PMC free article] [PubMed] [Google Scholar]
- 21.Lee S, Yun H-S, Kim S-H. The comparative effects of mesoporous silica nanoparticles and colloidal silica on inflammation and apoptosis. Biomaterials. 2011;32(35):9434–9443. doi: 10.1016/j.biomaterials.2011.08.042. [DOI] [PubMed] [Google Scholar]
- 22.Yu T, Greish K, McGill LD, Ray A, Ghandehari H. Influence of geometry, porosity, and surface characteristics of silica nanoparticles on acute toxicity: their vasculature effect and tolerance threshold. ACS nano. 2012;6(3):2289–2301. doi: 10.1021/nn2043803. [DOI] [PMC free article] [PubMed] [Google Scholar]
- 23.Li X, He Q, Shi J. Global gene expression analysis of cellular death mechanisms induced by mesoporous silica nanoparticle-based drug delivery system. ACS nano. 2014;8(2):1309–1320. doi: 10.1021/nn4046985. [DOI] [PubMed] [Google Scholar]
- 24.Chou CC, Chen W, Hung Y, Mou CY. Molecular Elucidation of Biological Response to Mesoporous Silica Nanoparticles in vitro and in vivo. ACS Applied Materials & Interfaces. 2017 doi: 10.1021/acsami.7b05359. [DOI] [PubMed] [Google Scholar]
- 25.Saptarshi SR, Feltis BN, Wright PF, Lopata AL. Investigating the immunomodulatory nature of zinc oxide nanoparticles at sub-cytotoxic levels in vitro and after intranasal instillation in vivo. Journal of nanobiotechnology. 2015;13(1):6. doi: 10.1186/s12951-015-0067-7. [DOI] [PMC free article] [PubMed] [Google Scholar]
- 26.Love MI, Huber W, Anders S. Moderated estimation of fold change and dispersion for RNA-seq data with DESeq2. Genome biology. 2014;15(12):550. doi: 10.1186/s13059-014-0550-8. [DOI] [PMC free article] [PubMed] [Google Scholar]
- 27.Ritchie ME, Phipson B, Wu D, Hu Y, Law CW, Shi W, Smyth GK. limma powers differential expression analyses for RNA-sequencing and microarray studies. Nucleic acids research. 2015:gkv007. doi: 10.1093/nar/gkv007. [DOI] [PMC free article] [PubMed] [Google Scholar]
- 28.West M, Blanchette C, Dressman H, Huang E, Ishida S, Spang R, Zuzan H, Olson JA, Marks JR, Nevins JR. Predicting the clinical status of human breast cancer by using gene expression profiles. Proceedings of the National Academy of Sciences. 2001;98(20):11462–11467. doi: 10.1073/pnas.201162998. [DOI] [PMC free article] [PubMed] [Google Scholar]
- 29.Huang DW, Sherman BT, Lempicki RA. Systematic and integrative analysis of large gene lists using DAVID bioinformatics resources. Nature protocols. 2009;4(1):44–57. doi: 10.1038/nprot.2008.211. [DOI] [PubMed] [Google Scholar]
- 30.Huang DW, Sherman BT, Lempicki RA. Bioinformatics enrichment tools: paths toward the comprehensive functional analysis of large gene lists. Nucleic acids research. 2009;37(1):1–13. doi: 10.1093/nar/gkn923. [DOI] [PMC free article] [PubMed] [Google Scholar]
- 31.Chang JT, Nevins JR. GATHER: a systems approach to interpreting genomic signatures. Bioinformatics. 2006;22(23):2926–2933. doi: 10.1093/bioinformatics/btl483. [DOI] [PubMed] [Google Scholar]
- 32.Saikia J, Yazdimamaghani M, Hadipour Moghaddam SP, Ghandehari H. Differential Protein Adsorption and Cellular Uptake of Silica Nanoparticles Based on Size and Porosity. ACS Applied Materials & Interfaces. 2016;8(50):34820–34832. doi: 10.1021/acsami.6b09950. [DOI] [PMC free article] [PubMed] [Google Scholar]
- 33.Sun L, Li Y, Liu X, Jin M, Zhang L, Du Z, Guo C, Huang P, Sun Z. Cytotoxicity and mitochondrial damage caused by silica nanoparticles. Toxicology in vitro. 2011;25(8):1619–1629. doi: 10.1016/j.tiv.2011.06.012. [DOI] [PubMed] [Google Scholar]
- 34.Duan J, Yu Y, Li Y, Yu Y, Li Y, Zhou X, Huang P, Sun Z. Toxic effect of silica nanoparticles on endothelial cells through DNA damage response via Chk1-dependent G2/M checkpoint. PloS one. 2013;8(4):e62087. doi: 10.1371/journal.pone.0062087. [DOI] [PMC free article] [PubMed] [Google Scholar]
- 35.Andreyev A, Kushnareva Y, Murphy A, Starkov A. Mitochondrial ROS metabolism: 10 years later. Biochemistry (Moscow) 2015;80(5):517–531. doi: 10.1134/S0006297915050028. [DOI] [PMC free article] [PubMed] [Google Scholar]
- 36.Kowaltowski AJ, de Souza-Pinto NC, Castilho RF, Vercesi AE. Mitochondria and reactive oxygen species. Free Radical Biology and Medicine. 2009;47(4):333–343. doi: 10.1016/j.freeradbiomed.2009.05.004. [DOI] [PubMed] [Google Scholar]
- 37.Kroemer G, Galluzzi L, Brenner C. Mitochondrial membrane permeabilization in cell death. Physiological reviews. 2007;87(1):99–163. doi: 10.1152/physrev.00013.2006. [DOI] [PubMed] [Google Scholar]
- 38.Ma X, Wu Y, Jin S, Tian Y, Zhang X, Zhao Y, Yu L, Liang X-J. Gold nanoparticles induce autophagosome accumulation through size-dependent nanoparticle uptake and lysosome impairment. ACS nano. 2011;5(11):8629–8639. doi: 10.1021/nn202155y. [DOI] [PubMed] [Google Scholar]
- 39.Eto K, Yamashita T, Hirose K, Tsubamoto Y, Ainscow EK, Rutter GA, Kimura S, Noda M, Iino M, Kadowaki T. Glucose metabolism and glutamate analog acutely alkalinize pH of insulin secretory vesicles of pancreatic β-cells. American Journal of Physiology-Endocrinology and Metabolism. 2003;285(2):E262–E271. doi: 10.1152/ajpendo.00542.2002. [DOI] [PubMed] [Google Scholar]
- 40.Huang D-M, Hung Y, Ko B-S, Hsu S-C, Chen W-H, Chien C-L, Tsai C-P, Kuo C-T, Kang J-C, Yang C-S. Highly efficient cellular labeling of mesoporous nanoparticles in human mesenchymal stem cells: implication for stem cell tracking. The FASEB journal. 2005;19(14):2014–2016. doi: 10.1096/fj.05-4288fje. [DOI] [PubMed] [Google Scholar]
- 41.Herd HL, Malugin A, Ghandehari H. Silica nanoconstruct cellular toleration threshold in vitro. Journal of controlled release. 2011;153(1):40–48. doi: 10.1016/j.jconrel.2011.02.017. [DOI] [PMC free article] [PubMed] [Google Scholar]
- 42.Mirshafiee V, Jiang W, Sun B, Wang X, Xia T. Facilitating Translational Nanomedicine via Predictive Safety Assessment. Molecular Therapy. 2017 doi: 10.1016/j.ymthe.2017.03.011. [DOI] [PMC free article] [PubMed] [Google Scholar]
- 43.Lin W, Huang Y-W, Zhou X-D, Ma Y. In vitro toxicity of silica nanoparticles in human lung cancer cells. Toxicology and applied pharmacology. 2006;217(3):252–259. doi: 10.1016/j.taap.2006.10.004. [DOI] [PubMed] [Google Scholar]
- 44.Mu Q, Hondow NS, Krzemiński Ł, Brown AP, Jeuken LJ, Routledge MN. Mechanism of cellular uptake of genotoxic silica nanoparticles. Particle and fibre toxicology. 2012;9(1):29. doi: 10.1186/1743-8977-9-29. [DOI] [PMC free article] [PubMed] [Google Scholar]
- 45.Nabeshi H, Yoshikawa T, Matsuyama K, Nakazato Y, Tochigi S, Kondoh S, Hirai T, Akase T, Nagano K, Abe Y. Amorphous nanosilica induce endocytosis-dependent ROS generation and DNA damage in human keratinocytes. Particle and fibre toxicology. 2011;8(1):1. doi: 10.1186/1743-8977-8-1. [DOI] [PMC free article] [PubMed] [Google Scholar]
- 46.Park MV, Verharen HW, Zwart E, Hernandez LG, van Benthem J, Elsaesser A, Barnes C, McKerr G, Howard CV, Salvati A. Genotoxicity evaluation of amorphous silica nanoparticles of different sizes using the micronucleus and the plasmid lacZ gene mutation assay. Nanotoxicology. 2011;5(2):168–181. doi: 10.3109/17435390.2010.506016. [DOI] [PubMed] [Google Scholar]
- 47.Cooper GM, Hausman RE. The cell. Vol. 85 Sinauer Associates Sunderland; 2000. [Google Scholar]
- 48.Forgac M. Vacuolar ATPases: rotary proton pumps in physiology and pathophysiology. Nature reviews Molecular cell biology. 2007;8(11):917–929. doi: 10.1038/nrm2272. [DOI] [PubMed] [Google Scholar]
- 49.Sumner J-P, Dow JA, Earley FG, Klein U, Jäger D, Wieczorek H. Regulation of plasma membrane V-ATPase activity by dissociation of peripheral subunits. Journal of Biological Chemistry. 1995;270(10):5649–5653. doi: 10.1074/jbc.270.10.5649. [DOI] [PubMed] [Google Scholar]
- 50.Walkley SU, Vanier MT. Secondary lipid accumulation in lysosomal disease. Biochimica et Biophysica Acta (BBA)-Molecular Cell Research. 2009;1793(4):726–736. doi: 10.1016/j.bbamcr.2008.11.014. [DOI] [PMC free article] [PubMed] [Google Scholar]
Associated Data
This section collects any data citations, data availability statements, or supplementary materials included in this article.