

Abstract
Enhanced skin permeability is known to be achieved during sonophoresis due to ultrasound-induced cavitation. However, the mechanistic role of cavitation during sonophoresis has only been extensively investigated for low-frequency (LFS, <100 kHz) applications. Here, mechanisms of permeability-enhancing stable and inertial cavitation were investigated by passively monitoring subharmonic and broadband emissions arising from cavitation isolated within or external to porcine skin in vitro during intermediate- (IFS, 100–700 kHz) and high-frequency sonophoresis (HFS, >1 MHz). The electrical resistance of skin, a surrogate measure of the permeability of skin to a variety of compounds, was measured to quantify the reduction and subsequent recovery of the skin barrier during and after exposure to pulsed (1 second pulse, 20% duty cycle) 0.41 and 2.0 MHz ultrasound over a range of acoustic powers (0–21.7 W) for 30 minutes. During IFS, significant skin resistance reductions and acoustic emissions from cavitation were measured exclusively when cavitation was isolated outside of the skin. Time-dependent skin resistance reductions measured during IFS correlated significantly with subharmonic and broadband emission levels. During HFS, significant skin resistance reductions were accompanied by significant acoustic emissions from cavitation measured during trials that isolated cavitation activity either outside of skin or within skin. Time-dependent skin resistance reductions measured during HFS correlated significantly greater with subharmonic than with broadband emission levels. The reduction of the skin barrier due to sonophoresis was reversible in all trials; however, effects incurred during IFS recovered more slowly and persisted over a longer period of time than HFS. These results quantitatively demonstrate the significance of cavitation during sonophoresis and suggest that the mechanisms and post-treatment longevity of permeability enhancement due to IFS and HFS treatments are different.
Keywords: Sonophoresis, IFS, HFS, Cavitation, Acoustic emissions, Skin permeability
1. Introduction
The skin offers a convenient and easily accessible route of drug administration for local and systemic treatment with advantages of avoiding pre-systemic absorption and systemic toxicity while also providing sustained, rate-controlled delivery [1]. However, the prevalent use of the transcutaneous route is severely limited due to the robust permeability barrier presented by the highly ordered lipid bilayer structure of the outermost skin layer, the stratum corneum (SC). A variety of non-invasive technologies have therefore been investigated with the aim of increasing skin permeability by transiently perturbing the SC architecture. Among these technologies, the application of therapeutic ultrasound to skin, a treatment termed sonophoresis, has proven to be particularly promising.
The primary enhancement mechanism of sonophoresis is believed to be acoustic cavitation, a phenomenon that has been widely researched in a number of other ultrasound-enhanced drug delivery applications [2,3]. Specifically, enhanced drug delivery has been shown to be achieved when cavitation interacts with and modifies the permeability of biological interfaces such as the blood brain barrier [4], fibrin matrix of blood clots [5, 6], and plasma membrane of cells [7]. The mechanisms of permeability enhancement among these applications are typically dependent on physical effects produced by distinct dynamic responses of a bubble to ultrasound, which are broadly categorized as either stable or inertial. Stable cavitation is characterized by repetitive, low-amplitude bubble oscillations which produce subharmonic emissions [8, 9] and high-velocity microstreams around the oscillatory boundary layer of the bubble [10]. Inertial cavitation refers to the rapid expansion of a microbubble followed by a violent collapse, leading to microjet [11] and shock wave [12] formations as well as generating broadband noise due to the supersonic acceleration of the bubble wall during collapse [9].
In the context of sonophoresis, increased skin permeability can be achieved when cavitation bubbles interact with and modify the skin barrier by inducing, dilating, and connecting defects [13–15] to form regions of increased permeability within the SC [16, 17]. However, the precise mechanisms, specifically the location(s) and type(s) of cavitation, responsible for skin permeabilization may be dictated by the frequency of ultrasound used for sonophoresis. In a study designed to identify the location of permeability-enhancing cavitation during low-frequency sonophoresis (LFS, <100 kHz), skin electrical resistance, used as a surrogate measure of skin permeability, was shown to be significantly reduced only when cavitation was present within the donor medium outside of skin [18]. Moreover, this study demonstrated that cavitation within the skin was unlikely to occur or provide a significant effect on skin permeability during LFS. Investigations aimed at identifying the critical types of permeability-enhancing cavitation during LFS have demonstrated a strong correlation between enhancement and measured broadband acoustic emissions, indicating that inertial cavitation occurring outside of the skin is the primary permeabilization mechanism of LFS [18–20]. Furthermore, theoretical [21] and experimental [22] investigations have indicated that the permeabilization effect from inertial cavitation during LFS is primarily due to microjet formations, manifested during the asymmetric collapse of bubbles near the skin surface, that impact and locally perturb the SC. Exploitation of this well characterized mechanism has led LFS treatments to provide a greater, although reversible, permeabilization effect while also significantly reducing treatment times [23, 24].
Since higher ultrasound frequencies result in cavitation bubbles with smaller dimensions and different dynamics than those produced by lower frequencies [25], the role of cavitation during intermediate- (IFS, 100–1000 kHz) and high-frequency sonophoresis (HFS, > 1 MHz) is likely different than during LFS. Among studies investigating IFS, Wu et al. identified the existence of randomly-arranged, air-filled voids approximately 20 μm in diameter within the SC of human skin, apparently due to cavitation, after in vitro exposure to 168-kHz ultrasound [13]. In another study, increased enhancement of skin permeability was shown by Ueda et al. to scale directly with rising broadband emissions, emanating from inertial cavitation presumed to be occurring within the donor medium outside the skin, during sonophoresis using frequencies as high as 445 kHz [19].
Unlike LFS and possibly IFS, cavitation within the skin may play a greater role during HFS because at higher frequencies resonant bubble diameters are smaller, comparable to dimensions of the lacunar voids within the skin where cavitation can occur [26–28]. This assertion was investigated experimentally in a study by Mitragotri et al., showing significant changes in skin electrical resistance occurred when the potential for cavitation was isolated to within the skin [15]. Microscopy-based analysis of skin after HFS in this study identified a disarrangement of the SC lipid bilayer, further indicating that skin permeabilization was due to cavitation occurring within voids near the corneocytes of the SC. In a study by Park et al., penetration of fluorescein isothiocyanate (FITC)-dextrans across skin during HFS was significantly enhanced when cavitation nuclei, in the form of ultrasound contrast agents (UCA), were introduced to the surrounding medium [29]. Due to the relatively low pressures used for HFS in this study, the observed enhancement was suggested by these authors to be caused by microstreaming associated with stable cavitation occurring outside the skin.
Although cavitation has been widely accepted as the primary enhancement mechanism of sonophoresis, the effects on skin permeability due to the various location(s) and type(s) of cavitation that occur during IFS and HFS, which are likely different from those of LFS, have not been fully elucidated. The conclusions of previous IFS and HFS investigations have been based on theoretically-derived results or indirect observations and have yet to be investigated systematically and quantitatively. This lack of mechanistic understanding has therefore inhibited optimization efforts to exploit and control specific permeability-enhancing mechanisms of cavitation necessary to improve treatment efficacy of IFS and HFS. Moreover, although sonophoresis using higher frequency ultrasound has a long track record of safety [30], the reversibility and longevity of enhanced permeability due to IFS and HFS is not well characterized.
Here, mechanisms of cavitation were quantitatively investigated by passively measuring acoustic emissions associated with specific cavitation activity isolated within or outside porcine skin during in vitro IFS and HFS experiments. Since the correlation between the electrical impedance and permeability of skin has been quantitatively defined for a variety of compounds, including hydrophilic and hydrophobic solutes [31–33], skin resistance can be used to instantaneously monitor alterations made to the skin barrier during sonophoresis as a surrogate measure of permeability [15,18,20] and to monitor the barrier recovery [34–36]. Resistance measurements of porcine skin were made here as an indicator of time-dependent changes in skin permeability during and after sonophoresis. Measured emission levels and skin resistance values were compared to clarify the potential roles of cavitation during IFS and HFS treatments, including (1) permeabilization associated with cavitation activity inside or outside the skin, (2) the relationship of emissions from distinct cavitation type(s) with treatment efficacy metrics, such as faster and greater overall permeabilization of skin, and (3) the reversibility and longevity of perturbations made to the skin due to ultrasound treatments in these frequency regimes.
2. Materials and Methods
2.1. Skin Tissue Preparation
Fresh skin was harvested from the front lateral flank of female Yorkshire X swine immediately post mortem under the approval of the Institutional Animal Care and Use Committee (IACUC) of the University of Cincinnati. Full thickness skin (FTS) samples were prepared by removing subcutaneous tissue and excess hair, sectioned into 6×6 cm square pieces, and stored at –80 °C until use within a period of less than 3 months, to avoid altering the barrier due to storage [37, 38]. Experiments were conducted using in vitro porcine skin since previous studies have shown, utilizing skin electrical resistance as an indicator of skin permeabilization, that porcine skin may provide similar drug transport pathways as human skin in vitro [33] and that in vivo permeability may be accurately predicted from in vitro measurements of porcine skin [16]. Additionally, porcine skin was used due to its comparable histological, biochemical, and in vitro permeability characteristics to human skin [39, 40].
Prior to use, FTS samples were thawed and hydrated in 0.01 M phosphate buffered saline (PBS; Sigma-Aldrich, St. Louis, MO USA) at 4 °C for 20–24 hours to eliminate temporal changes of skin permeability due to a hydration gradient during experiments. The gas content of PBS used for FTS hydration and experiments was monitored using a meter (WD-35641, Oakton Instruments, Vernon Hills, IL USA) to measure dissolved oxygen (DO) as a surrogate measure of air saturation. The DO content of skin was controlled by hydrating skin using PBS that was either: (1) degassed by placing under vacuum while in a sonication bath for approximately one hour to lower the DO below 20%, or (2) allowed to saturate in open air, permitting the gas content to reach a DO of at least 80%. After hydration and immediately prior to use, skin was acclimated to room temperature for 30 minutes in fresh PBS that was approximately the same DO as used during hydration.
2.2. Ultrasound Apparatus and In Vitro Experiments
Hydrated FTS samples were trimmed into circular sections 4.5 cm in diameter and placed in a custom made vertical diffusion cell, separating PBS filled donor and receiver compartments of 3.1 cm diameter, with the SC facing the donor compartment. The following combinations of gas-content controlled donor PBS and skin were employed to isolate the location of cavitation during IFS and HFS. First, a series of experiments were conducted in the absence of ultrasound exposure to serve as sham trials. Second, to suppress all cavitation activity, degassed FTS was used in combination with degassed PBS in the donor compartment, experiments referred to hereafter as ‘controls.’ Third, to isolate cavitation activity to the donor PBS only, outside the skin, degassed FTS was used in combination with air saturated donor PBS, experiments referred to hereafter as ‘skin degassed.’ Fourth, to isolate cavitation activity within the skin only, FTS hydrated in air-saturated PBS was used in combination with degassed donor PBS, experiments referred to hereafter as ‘PBS degassed.’ For all trials, degassed PBS was used to fill the receiver compartment to eliminate cavitation activity posterior to FTS.
All experimental equipment and data acquisitions used during sonophoresis, illustrated in Figure 1, were controlled by a custom MATLAB (R2012a, The Mathworks, Inc., Natick, MA USA) script used to connect and sync a PC to a digital multimeter (34401A, Agilent, Santa Clara, CA USA), an arbitrary waveform generator (33220A, Agilent, Santa Clara, CA USA), and a custom microcontroller circuit used to power a 50 Ohm electro-mechanical, radio-frequency switch (50S-1313+12-SMA, JFW Industries, Inc., Indianapolis, IN USA). Ultrasound was produced by sending a sinusoidal signal from the generator through the switch to a radio-frequency amplifier (3100L, ENI, Mountain View, CA USA) to power one of two source transducers operated at center frequencies of 0.41 and 2.0 MHz (IX-887 and IX-887, UTX, Ithaca, NY USA) as representative frequencies of IFS and HFS, respectively. The transducer was placed 1.1 and 3.1 cm from the skin surface during IFS and HFS, respectively. Skin was treated for 30 minutes with ultrasound that was generated in a pulsed continuous-wave mode with a 20% duty cycle (1 second on, 4 seconds off) for either insonation frequency.
Figure 1:
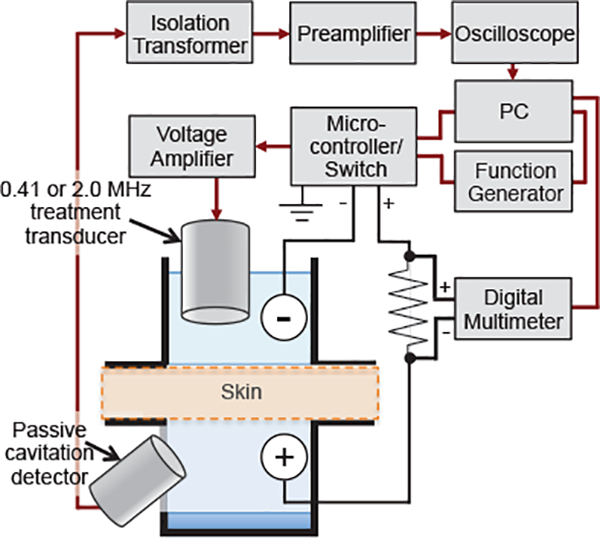
Schematic of experimental apparatus. Shown is the electronic instrument configuration used for sonophoresis, measurement of skin resistance, and passive acquisition of acoustic emissions from cavitation activity throughout treatment. In vitro porcine skin was used to separate the donor and receiver compartments of a custom made diffusion cell that was designed to accommodate the treatment transducer and a passive cavitation detector in the donor and receiver compartments, respectively, and two electrodes placed on either side of the skin in-series with a known resistor.
Each transducer was calibrated by measuring the acoustic power output (APO) using a radiation force balance (UPM-DT-10E, Ohmic Instruments, Easton, MD USA) and the peak rarefactional pressure at the skin surface using calibrated hydrophones. The APO generated by the 0.41 MHz transducer for IFS trials was 0.79 and 1.68 W. Corresponding peak negative pressures measured by a calibrated hydrophone (TC 4038, Teledyne Reson, Goleta, CA USA) at the skin surface for IFS trials were 282 and 404 kPa. The APO generated by the 2.0 MHz transducer for HFS trials was 8.44 and 21.7 W. Corresponding peak rarefactional pressures measured by a calibrated hydrophone (1239, Precision Acoustics, Dorchester, Dorset, UK) at the skin surface for HFS trials was 0.53 and 0.77 MPa.
The insonation parameters used for IFS and HFS were chosen based on the following criteria: (1) the lower APO used for each frequency was sufficient to elicit consistent subharmonic emissions from cavitation occurring in air saturated water, (2) the higher APO applied for each frequency was sufficient to elicit occasional broadband emissions from inertial cavitation occurring within air saturated water, and (3) the pulse length and duty cycle used in combination with the chosen APOs for each frequency limited tissue heating at the skin surface to no greater than a 5 °C increase above room temperature for any trial. To reduce effects from reflections or standing waves, sound absorbing rubber (Aptflex F28, Precision Acoustics LTD, Dorchester, Dorset, UK), with an acoustic impedance similar to water and a measured reflection coefficient less than –20 dB throughout the frequency range of interest, was placed at the bottom of the receiver compartment perpendicular to the propagating acoustic wave from the source transducer.
2.3. Passive Cavitation Detection and Analysis
Acoustic emissions arising from cavitation within the skin and surrounding medium during sonophoresis were detected by a 1-MHz, 25 mm circular diameter, unfocused, broadband transducer (V302, Panametrics, Waltham, MA USA) employed as a receive-only, passive cavitation detector (PCD), similar to methods used by others [41]. The PCD was mounted on the sidewall of the receiver compartment facing the skin sample, approximately 45 mm from the center of the FTS sample. This off-center configuration was used to reduce direct signals from the insonation transducer, therefore increasing the dynamic range available for cavitation detection.
Raw time-domain signals received by the PCD were passed through a 1:1 50 Ohm isolation transformer (M0203, TTE Inc., Los Angeles, CA USA), used to remove the PCD as a ground source during resistance measurements, and sent to a preamplifier (SRS560, Stanford Research Systems, Sunnyvale, CA USA). Audible, fundamental, and higher harmonic contributions to the received signals were reduced by the preamplifier using a band-pass filter with a passband of 10–300 kHz during IFS and 10–1000 kHz during HFS experiments. Filtered signals were then amplified by a factor of 100 during IFS and by 500 during HFS by the preamplifier. For each 1-second insonation pulse during sonophoresis, an oscilloscope (Waverunner 6050A, LeCroy, Chestnut Ridge, NY USA) was triggered to synchronously digitize and record three successive filtered and amplified PCD-received signals of 200 ms duration, with a 100 ms delay between acquisitions, at 10 MHz sampling frequency. Additionally, ten consecutive PCD signals were acquired immediately prior to each experiment to serve as a reference signal.
A custom MATLAB algorithm was used to estimate power spectra of each acquired time-domain signal by using the method of averaged periodograms [42]. Briefly, each 200 ms PCD signal was segmented by non-overlapping 1 ms rectangular windows, the discrete Fourier transform of each segment was computed, and the squared magnitude of the individual segments were averaged to acquire power spectra with a frequency resolution of 1 kHz. Spectral energy in the frequency band at half of the center insonation frequency was extracted from each power spectrum as an indicator of subharmonic emissions from stable cavitation, while spectral energy in the band 0.25–0.35 MHz was extracted to characterize broadband emissions arising from inertial cavitation. Using the same analysis to determine the frequency content of the spectra acquired prior to treatment, the reference noise level was computed to account for background electronic noise and interference artifacts residing within each investigated frequency band. Time-averaged signal-to-noise ratios (SNR) of the subharmonic and broadband frequency bands were calculated as dB-scaled ratios of integrated spectral energy of each investigated frequency band signal, measured during the initial 3 and 30 minutes of treatment, over the noise level of the corresponding frequency band and time duration.
2.4. Skin Electrical Resistance
Skin electrical resistance was measured during sonophoresis for all trials to serve as an instantaneous and surrogate measure of skin permeability, where increased permeability is indicated by decreased resistance [31–33]. Throughout each experiment the function generator was triggered to supply a short-duration (<2 seconds), 100 mVRMS, 10 Hz AC voltage through the electro-mechanical switch to a circuit consisting of a pair of 4 mm Ag/AgCl electrodes (E242, In Vivo Metric, Healdsburg, CA USA), placed in the donor and receiver compartments 1.5 cm from the skin sample, and an in-series 1 kΩ resistor (measured prior to each trial as 1001.5 ± 11.8 Ω). A multimeter was synchronously triggered to measure the potential across the known in-series resistor. The electrical resistance of skin was then calculated as a function of time using Ohm’s Law by
| (1) |
where Rskin(t) is the time-dependent measure of skin resistance, Vr the potential across the known resistor measured as a function of time, Vout the supplied voltage by the function generator (100 mVRMS), Rk the measured resistance value of the known resistor, Rfgen the coupling impedance of the function generator (50 Ω), and RpBs the resistance of the 3.0 cm column of PBS separating the electrodes, measured prior to experiments in the absence of skin. Time-dependent skin resistance measurements were made immediately prior to ultrasound exposure and at 10 seconds intervals thereafter, during every second quiescent period of pulsed ultrasound. Post-treatment skin resistance measurements were made at 30 second intervals for 30 minutes after treatment had ceased. All time-dependent resistance measurements were then normalized by the initial skin resistance measured prior to treatment. Additionally, prior to each experiment the resistivity of skin was calculated by multiplying the initially measured resistance value by the skin surface area exposed to PBS. To ensure that the skin barrier was fully intact after harvesting and freezing, skin samples with a resistivity under 35 kΩ · cm2 were discarded [38].
The exponential decrease of normalized skin resistance as a function of time during each individual treatment was approximated by a least-squares fit to the model
| (2) |
where R(t) is the skin resistance as a function of time (ohms), R0 the initial skin resistance value (ohms), A the normalized skin resistance coefficient (dimensionless), κ the exponential decay rate constant (min−1), and t the elapsed time (min). The exponential regression was applied to the time-dependent normalized skin resistance data of each individual trial and a coefficient of determination was calculated to identity the goodness of fit. From Equation 2, the initial rate (IR) of normalized skin resistance decrease was then linearly approximates as
| (3) |
Using the measured resistance value of skin at the end of treatment (t = 30), the total relative decrease in skin resistance due to sonophoresis (DR) was characterized by
| (4) |
Post-treatment skin resistance data was first analyzed by applying a linear regression to the normalized skin resistance and and a coefficient of determination was calculated to identify the goodness of fit to each individual trial. Second, the slope of the least-squares fit was determined to characterize the post-treatment rate of normalized skin resistance recovery (dR/dt). Finally, using the calculated rate of skin resistance recovery (dR/dt) and the calculated DR value from Equation 4, the post-treatment normalized skin resistance was extrapolated to estimate the number of hours required for skin to fully recover to its initial value (τ) as
| (5) |
2.5. Statistical Analysis
Group means were compared for measured acoustic emission levels, initial rate of resistance decrease (IR), relative resistance decrease after treatment (DR), and post-treatment resistance recovery rate. Grouped data was analyzed first using the Shapiro-Wilk test to check normality (p ≥ 0.05) of each variable set. Significant (p < 0.05) differences among group means of normally distributed variables were identified by one-way analysis of variance (ANOVA) and non-normally distributed variables by Kruskal-Wallis ANOVA (KWANOVA). Third, post-hoc pairwise comparisons were made to identify significant (p < 0.05) differences between group means using Tukey’s method for variables analyzed by ANOVA and the Holm-Bonferroni method for variables analyzed by KWANOVA.
Correlation analyses were conducted among corresponding time-dependent emission levels and characteristic skin resistance reduction values obtained during IFS and HFS. A Hotelling-Williams t-test was used to delineate significant differences among correlation coefficients of dependent variables. Significance of correlation coefficients and corresponding t-test were considered at a significance level of 𝛼 = 0.05 (two-tailed). All statistical analyses were conducted using R software (version 3.0.2) [43].
3. Results
3.1. Acoustic emissions during IFS and HFS
Shown in Figure 2(a) are two representative PCD spectra measured during HFS. Frequency content within each spectrum consists of a strong signal in the fundamental frequency band (f0, 2.0 MHz) and a rise in frequency content indicative of cavitation activity such as subharmonics (f0/2) and the manifestation of an increased broadband noise level. Spectra such as these, measured throughout each trial, were used to quantify stable and inertial cavitation activity by calculating time-dependent SNR of the subharmonic and broadband frequency bands as shown, respectively, in Figures 2(b) and (c).
Figure 2:
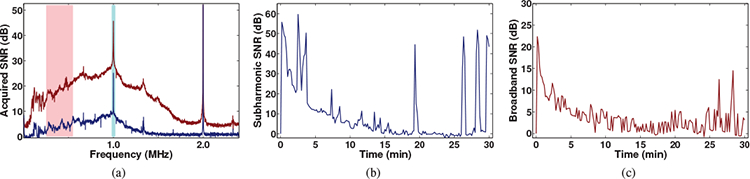
Representative analysis of passively detected acoustic emissions from cavitation. (a) Two representative frequency spectra of acoustic emissions obtained during sonophoresis (f0=2.0 MHz). Frequency content consistent with cavitation is highlighted at the subharmonic (f0/2) band in both spectra and by a rise in broadband noise in the red spectrum. Representative time histories of (b) subharmonic and (c) broadband frequency band signal-to-noise ratios (SNR).
Mean values of time-averaged subharmc and broadband emission levels measured for each group treated with IFS (0.41 MHz), shown in Figures 3(a) and (b), respectively, were found to be significantly different by ANOVA (p = 6.62 × 10⁻⁸ and p = 2.25 × 10⁻³, respective Multiple comparisons among the means of the various treatment groups revealed that the near zero-dB emission levels measured during IFS trials that suppressed all cavitation activity (control) were not significantly different than those measured during any of the trials that isolated cavitation activity to within the skin only (PBS degassed) for subharmon and broadband emission levels (p > 0.88 and p > 0.95, respectively). In comparison to the PBS-degassed and control groups, IFS trials that isolated cavitation activity to the donor PBS outside the skin (skin degassed) produced significantly greater subharmonic emission levels for all employed APOs (p < 10−5). Among each individual treatment group pair, no significant increase of the subharmonic or broadband SNR was measured when the APO was increased from 0.79 to 1.68 W. However, in comparison to the PBS-degassed and control trials, the broadband emission level was only significantly greater (p < 0.01) for the higher 1.68 W APO.
Figure 3:
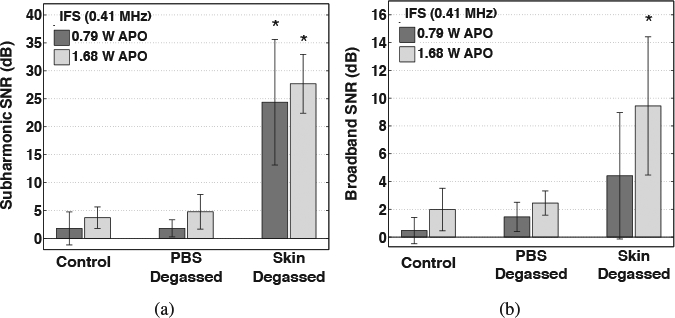
Time-averaged signal-to-noise ratios (SNR) of (a) subharmonic and (b) broadband emissions acquired during 30-minute intermediate-frequency sonophoresis (IFS) experiments. Results are mean SNR values measured during trials that suppressed all cavitation (control), isolated cavitation activity to within the skin only (PBS degassed), and isolated cavitation activity outside of skin only (skin degassed) during IFS employing acoustic powers of 0.79 and 1.68 W. Error bars indicate one standard deviation and groups that produced a significantly greater SNR than control groups are indicated (⋆).
Mean values of time-averaged subharmonic and broadband emission levels measured for each group treated with HFS (2.0 MHz), shown in Figures 4(a) and (b), respectively, were found to be significantly different by ANOVA (p = 1.23 × 10⁻⁸ and p = 7.44 × 10⁻⁴, respectively). Multiple comparisons among the means of the various treatment groups revealed that in comparison to the near zero-dB emission levels of the control trials, all of the PBS-degassed and skin-degassed trials produced significantly greater subharmonic emission levels (p < 10−4). Among the skin-degassed and PBS-degassed trials, when either APO was employed, the subharmonic emission levels were not significantly different (p > 0.35). Additionally, among each treatment group pair, no significant increase of the subharmonic SNR was measured when the APO was increased from 8.44 to 21.7 W (p > 0.34). However, broadband emission levels measured during skin-degassed and PBS-degassed trials were significantly greater than the control trials only when the higher 21.7 W APO was employed (p < 0.025).
Figure 4:
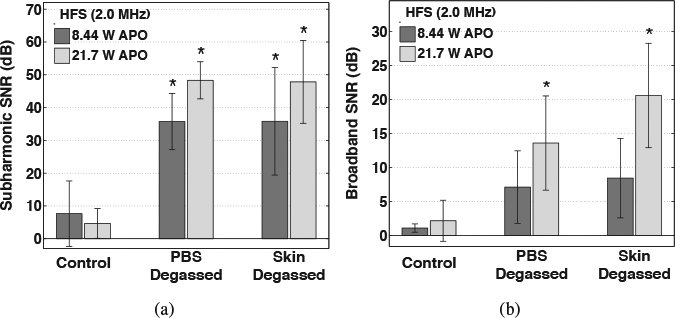
Time-averaged signal-to-noise ratios (SNR) of (a) subharmonic and (b) broadband emissions acquired during 30-minute high-frequency sonophoresis (HFS) experiments. Results are mean SNR values for trials that suppressed all cavitation (control), isolated cavitation activity to within the skin only (PBS degassed), and isolated cavitation activity outside of skin only (skin degassed) during HFS employing acoustic powers of 8.44 and 21.7 W. Error bars indicate one standard deviation and groups that produced a significantly greater SNR than the control groups are indicated (⋆).
3.2. Reduction of skin resistance during IFS and HFS
Normalized skin resistance, averaged for each treatment group, is shown as a function of time in Figures 5(a) and (b) during (‘ultrasound on’) 30-minute IFS and HFS treatments, respectively. The time-dependent reduction of skin resistance during sonophoresis, indicating an increase in skin permeability, is shown in these plots to be approximately exponential during the 30-minute treatments, which is reflected by the high values calculated for the coefficients of determination for the fit to Equation 2 (r2 = 0.908±0.097 mean and standard deviation of all trials). In Figures 6(a) and (b) the mean and standard deviation of the initial rate (IR) and total relative reduction (DR) of skin resistance, respectively, are shown for all trials; both were found to be significantly different among treatment groups by KWANOVA (p = 1.62 × 10⁻⁷ and p = 4.57 × 10⁻⁸, respectively). Multiple comparisons among the mean IR or DR for groups treated with IFS revealed no significant differences among any of the PBS-degassed, control, and trials that received no ultrasound exposure (sham) (p > 0.75). However, in comparison to these trials, significantly greater IR and DR values were measured during IFS skin-degassed trials when either APO was employed (p < 10−3 and p < 10−4, respectively). Normalized skin resistance during the skin-degassed trials initially decreased at rates of 8.71 ±6.50 and 11.9±5.10 min−1 and decreased overall by 44.3%±18.8% and 46.3%±6.24% at the end of treatment, respectively with increasing APO. No significant difference in either IR or DR was observed when the APO was increased among any individual group pair treated with IFS.
Figure 5:
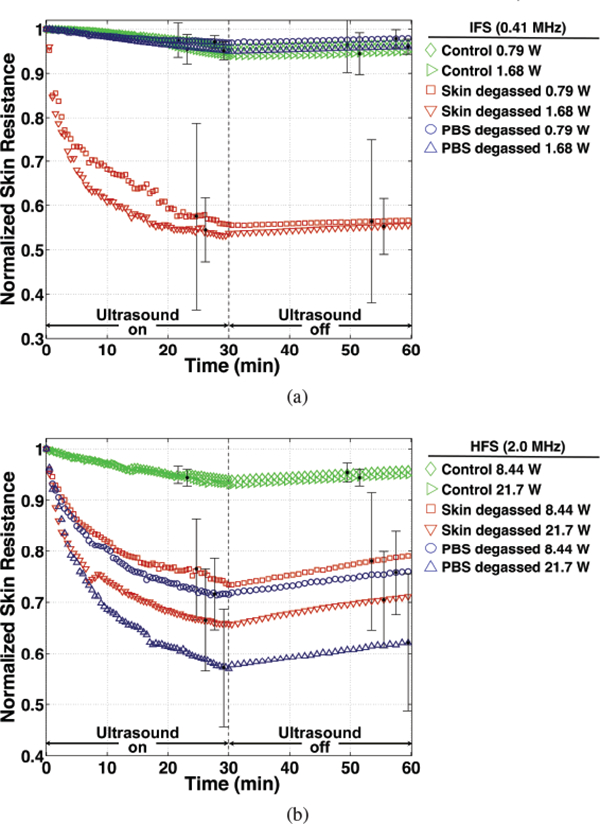
Normalized skin resistance as a function of time during (‘ultrasound on’) and after (‘ultrasound off’) for (a) intermediate- (IFS) and (b) high-frequency sonophoresis (HFS) trials. Time-dependent values are averaged for groups that suppressed all cavitation (control), isolated cavitation activity to within the skin only (PBS degassed), and isolated cavitation activity outside of skin (skin degassed) for each respective acoustic power employed during IFS and HFS. Error bars indicate the value of one standard deviation at representative time points during and after treatment.
Figure 6:
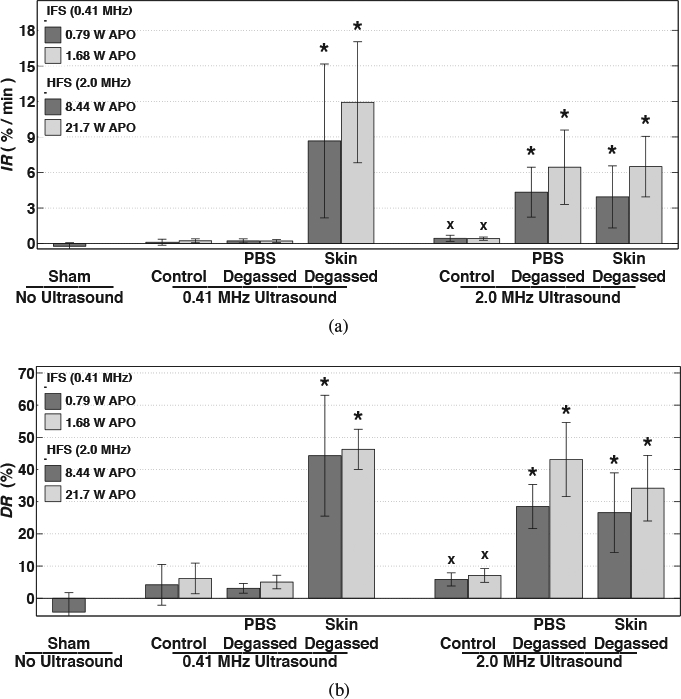
Mean values of (a) initial decay rate (IR) and (b) end of treatment reduction (DR) of normalized skin resistance among trials treated with no ultrasound (sham) and intermediate- (IFS) or high-frequency sonophoresis (HFS) that suppressed all cavitation (control), isolated cavitation activity to within the skin only (PBS degassed), or isolated cavitation activity outside of skin (skin degassed). Error bars indicate one standard deviation. Groups that produced significantly greater values than the sham group (×) and groups that produced significantly greater values than both the sham and respective control trials (⋆) are indicated.
Additionally shown in Figures 6(a) and (b) are the mean and standard deviation of IR and DR values, respectively, measured for each HFS trial. Unlike the results of the IFS trials, the HFS control group employing either APO produced significantly greater IR and DR values than the sham trials (p < 0.05). However, the IR and DR values measured for the sham and HFS control groups were both significantly lower than for the HFS skin-degassed and PBS-degassed groups treated with either APO (p < 0.05). Skin resistance during the skin-degassed trials reduced initially at rates of 3.90±2.60 and 6.50±2.61 min−1 and decreased overall by 26.58%±12.36% and 34.20%±10.21% at the end of treatment, respectively with increasing APO. During the PBS-degassed trials, skin resistance initially reduced at rates of 4.35±2.11 and 6.52±3.11 min−1 and decreased overall by 28.49%±6.85% and 43.10%±11.52% at the end of treatment, respectively with increasing APO. No significant difference in either IR or DR was observed when the APO was increased among any individual group pair treated with HFS and no significant difference was found when comparing the IR or DR values between the HFS skin-degassed and PBS-degassed groups.
All treatment groups that produced significant acoustic emissions (Figures 3 and 4), in comparison to the control trials, also produced significantly greater IR and DR values (Figure 6) than trials that did not produce significant acoustic emissions. The IR and DR values obtained during IFS skin-degassed, HFS skin-degassed, and HFS PBS-degassed trials were significantly greater than those obtained during the IFS control, IFS PBS-degassed, and HFS control trials (p < 0.05). The IR and DR values were not significantly different among the IFS skin-degassed, HFS skin-degassed and PBS-degassed groups (p > 0.99), all trials that produced significant acoustic emissions. Likewise, IR and DR values were not significantly different among the IFS PBS-degassed, IFS control, and HFS control groups (p > 0.99), all trials that did not produce significant acoustic emissions from cavitation.
3.3. Correlation among acoustic emissions and changes in skin resistance
Calculated correlation coefficients between time-dependent skin resistance reductions, characterized by IR and DR, and corresponding time-averaged subharmonic and broadband emission levels of all 30 IFS trials are summarized in Table 1. The significant correlations of IR with subharmonic (r = 0.899, p = 1.38 × 10⁻¹¹) and broadband (r = 0.816, p = 3.84 × 10⁻⁸) emission levels, measured during the initial 3 minutes of treatment, are illustrated in Figures 7(a) and (b), respectively. A significant correlation was found between subharmonic and broadband emission levels (r = 0.777, p = 1.67 × 10⁻⁷) and no significant difference was found between correlation coefficients of IR with either the subharmonic or broadband SNR (t = 1.62, p = 0.12).
Table 1:
Correlation matrix for initial rate of skin resistance decrease (IR) and the total relative skin resistance decrease at the end of treatment (DR) with the time-averaged signal-to-noise ratio (SNR) of each investigated frequency band measured over the initial 3 and 30 minutes, respectively, during IFS (0.41 MHz) treatment.
| IFS 0–3 minutes |
IFS 0–30 minutes |
||||
|---|---|---|---|---|---|
| Subharmonic | Broadband | Subharmonic | Broadband | ||
| IR | 0.899 | 0.816 | DR | 0.928 | 0.633 |
| Broadband | 0.777 | Broadband | 0.778 | ||
| t-statistic | 1.62 | t-statistic | 6.42 | ||
Boldfaced correlation coefficients and t-statistics indicate statistical significance (p < 0.05).
Figure 7:
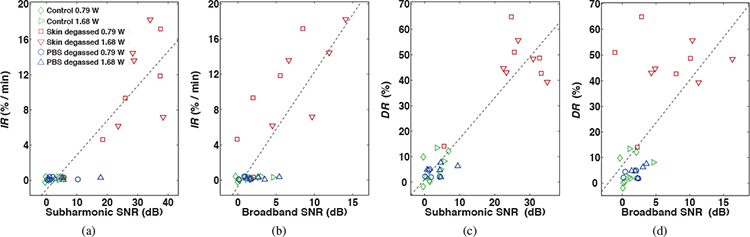
Initial decay rate (IR) and end of treatment reduction (DR) of normalized skin resistance vs. time-averaged subharmonic (a, c) and broadband (b, d) signal-to-noise ratios (SNR) measured over 3 and 30 minutes, respectively, during intermediate-frequency sonophoresis (IFS). Points are shown for all IFS trials (N = 30). The dashed line indicates the linear regression line for all points.
Scatter plots shown in Figures 7(c) and (d) illustrate the significant correlations between DR with subharmonic (r = 0.928, p = 1.67 × 10⁻¹³) and broadband (r = 0.633, p = 1.74 × 10⁻⁴) emission levels, respectively, measured over the duration of each 30-minute IFS treatment. Despite a significant correlation between the two measured emission levels (r = 0.777, p = 4.32 × 10⁻⁷), DR correlated significantly greater with the subharmonic than with the broadband SNR (t = 6.42, p = 5.9 × 10⁻⁷).
Calculated correlation coefficients between the time-dependent skin resistance characteristics IR and DR with corresponding time-averaged subharmonic and broadband emission levels of all 34 HFS trials are summarized in Table 2. The significant correlation of IR with subharmonic (r = 0.896, p = 8.01 × 10⁻¹³) and broadband (r = 0.528, p = 1.30 × 10⁻³) emission levels, measured during the initial 3 minutes of treatment, are illustrated in Figures 8(a) and (b), respectively. Despite the significant correlation between the two measured emission types (r = 0.731, p = 9.01 × 10⁻⁷), IR correlated significantly greater with the subharmonic than with the broadband SNR (t = 6.74, p = 1.30 × 10⁻⁷). Scatter plots shown in Figures 8(c) and (d) illustrate the significant correlations of DR with subharmonic (r = 0.888, p = 2.42 × 10⁻¹²) and broadband (r = 0.613, p = 1.16 × 10⁻⁴) emission levels, respectively, measured over the duration of each 30-minute HFS treatment. DR correlated significantly greater with the subharmonic than with the broadband SNR (t = 4.25, p = 1.70 × 10⁻⁷), despite a strong correlation between the measured SNR of the two emission types (r = 0.709, p = 2.67 × 10⁻⁶).
Table 2:
Correlation matrix for initial rate of skin resistance decrease (IR) and the total relative skin resistance decrease at the end of treatment (DR) with the time-averaged signal-to-noise ratio (SNR) of each investigated frequency band measured over the initial 3 and 30 minutes, respectively, during HFS (2.0 MHz) treatment.
| HFS 0–3 minutes |
HFS 0–30 minutes |
||||
|---|---|---|---|---|---|
| Subharmonic | Broadband | Subharmonic | Broadband | ||
| IR | 0.896 | 0.528 | DR | 0.888 | 0.613 |
| Broadband | 0.731 | Broadband | 0.709 | ||
| t-statistic | 6.74 | t-statistic | 4.25 | ||
Boldfaced correlation coefficients and t-statistics indicate statistical significance (p < 0.05).
Figure 8:
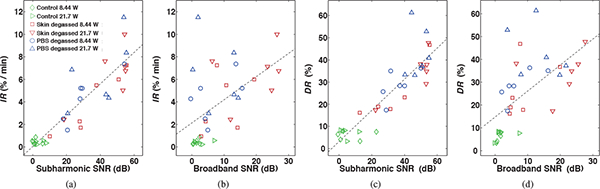
Initial decay rate (IR) and end of treatment reduction (DR) of normalized skin resistance vs. time-averaged subharmonic (a, c) and broadband (b, d) signal-to-noise ratios (SNR) measured over 3 and 30 minutes, respectively, during high-frequency sonophoresis (HFS). Points are shown for all HFS trials (N = 34). The dashed line indicates the linear regression line for all points.
3.4. Skin resistance recovery after IFS and HFS
Normalized skin resistance measurements made over 30 minutes immediately after IFS and HFS treatment (‘ultrasound off’) is shown as a function of time for the mean of each treatment group in Figures 5(a) and (b), respectively. Considering the approximate linear increase of skin resistance with time after treatment, a linear regression, characterized by high coefficients of determination (r2 = 0.960 ± 0.064 mean and standard deviation of all trials), was applied to each trial and the slope of the fit was used to quantify the rate of skin resistance recovery. The mean rate of recovery of the IFS skin-degassed, HFS skin-degassed and PBS-degassed groups, trials that incurred significant resistance reductions during treatment and shown in Figure 9(a), were found to be significantly different by ANOVA (p = 2.6 × 10⁻³). Multiple group comparisons of means revealed that the recovery rates were not significantly different among the PBS-degassed and skin-degassed groups treated with FIFS employing either APO. Additionally, the recovery rates among the pair of IFS skin-degassed groups employing either APO were not significantly different. However, in comparison to the HFS trials, the rate of recovery of the IFS groups was significantly slower (p = 3.75 × 10⁻⁵).
Figure 9:
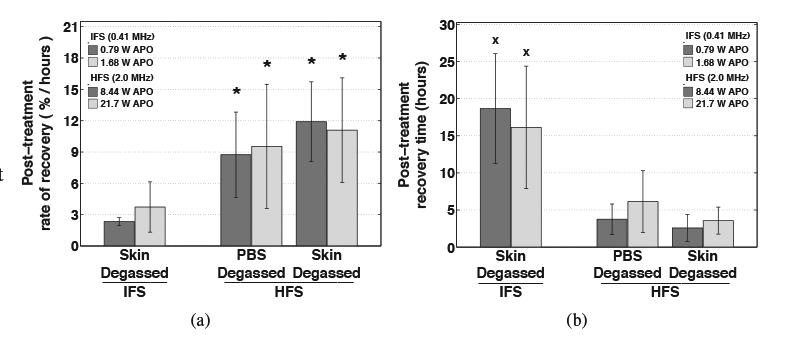
Post-treatment (a) rate of recovery and (b) estimated time for complete recovery of normalized skin resistance. Average values are shown for trials that isolated cavitation outside of the skin only (skin degassed) during intermediate-frequency sonophoresis (IFS, 0.41 MHz ultrasound) and trials that isolated cavitation inside of the skin only (PBS degassed) or outside of the skin only (skin degassed) during high-frequency sonophoresis (HFS, 2.0 MHz ultrasound). Error bars indicate one standard deviation. Skin resistance recovered significantly faster after HFS than IFS treatment (indicated by ⋆), and the time for skin resistance to fully recover was significantly greater after IFS than HFS treatment (indicated by ×).
Considering the approximately linear increase of normalized skin resistance after treatment, the recovery of skin resistance was assumed to continue its linear trajectory beyond the 30-minute measurement period and, using Equation 5, the approximate time required for skin resistance to fully recover was estimated. The group means of recovery time for the IFS skin-degassed, HFS skin-degassed and PBS-degassed trials shown in Figure 9(b), groups that all incurred significant resistance reductions during treatment, were found to be significantly different by ANOVA (p = 3.54 × 10⁻⁶).
No significant difference was found among the recovery times calculated for any of the HFS skin-degassed and PBS-degassed trials (p > 0.75). The recovery times among the IFS skin-degassed group were not significantly different among trials that employed either APO for treatment (p > 0.95). However, in comparison to the IFS skin-degassed groups, the trials treated with HFS required significantly greater time to fully recover (p = 1.87 × 10⁻²).
Scatter plots shown in Figures 10(a) and (b) show the estimated time to recover as a function of DR for all IFS and HFS trials, respectively. The approximately linear relationship between the time to recover and DR is represented in the plot by a trend line (dashed lines) for IFS (r2 = 0.829, p = 2.88 × 10⁻¹²) and HFS (r2 = 0.625, p = 2.17 × 10⁻⁹) trials. The slopes of the linear least-squares fits to this data indicate that for every 10% decrease in skin resistance incurred during IFS, approximately 3.6 hours would be required for skin to recover that amount. For every 10% reduction incurred during HFS treatment would require approximately 1.2 hours for skin resistance to fully recover that amount.
Figure 10:
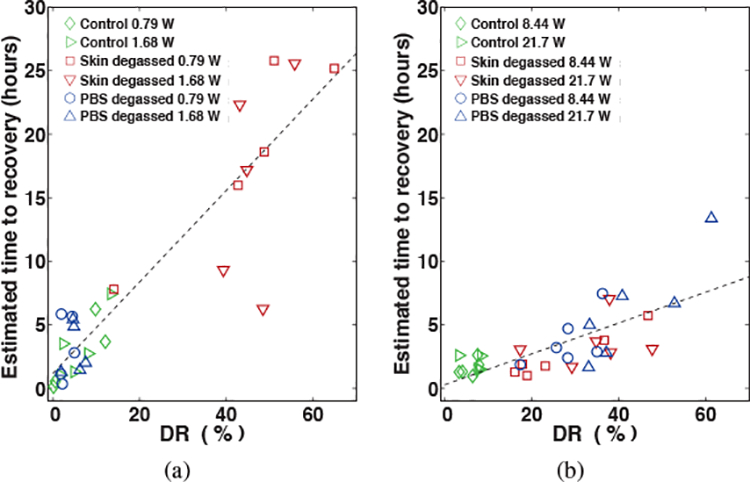
Scatter plots of the estimated time for complete recovery vs. the end of treatment reduction of normalized skin resistance (DR) for all trials treated with (a) intermediate- (IFS) and (b) high-frequency sonophoresis (HFS). The dashed line indicates the linear regression line for all points.
4. Discussion
4.1. The role of cavitation during IFS
Significant time-dependent skin resistance decreases (Figure 6) were measured during IFS only when significant cavitation activity was also present (Figure 3). Specifically, in comparison to the near-zero dB emission levels measured during trials that suppressed all cavitation (control) during IFS, significant emission levels were only measured when cavitation was isolated outside the skin (skin-degassed). Correspondingly, in comparison to trials that suppressed all cavitation or isolated potential cavitation activity to within the skin only during IFS, skin resistance decreased at a significantly faster initial rate (IR) and achieved a significantly greater overall decrease (DR) only when cavitation was isolated outside the skin. These results indicate that the permeabilization effect on skin achieved in this study during IFS was primarily due to cavitation activity outside the skin and, using the insonation parameters explored here, cavitation did not occur within the skin during IFS.
Similar to the results shown in the present study for IFS, Tang et al. demonstrated, by isolating the location of cavitation activity, that cavitation does not occur within the skin during LFS and that the permeabilization effect these authors measured, quantified by changes in skin impedance, was solely due to cavitation activity outside of the skin [18]. The observed absence of permeability-enhancing cavitation within skin in this and previous studies during IFS and LFS is likely due to the physical dimensions of the lacunar regions within the SC, where cavitation could occur, being smaller than the diameter of bubbles that are resonant to the applied frequencies [26]. In water, for example, the theoretical diameter of free bubbles resonant to 0.41 MHz ultrasound is approximately 7.5 μm, larger than the nominal lumen diameter of sweat ducts (5 μm) [44] and equivalent to the thickness of the SC (10 μm) [45]. Considering also that the threshold to initiate cavitation shifts towards larger bubbles in tissue than in aqueous phase [46], the physical limitations of the skin dimensions to accommodate bubbles resonant to LFS likely also inhibits the presence of bubbles large enough to be excited by IFS.
Although the location of cavitation responsible for the permeabilization effect on skin during IFS is shown to be similar to that of LFS, the type of cavitation responsible for enhancement among the two treatment-frequency regimes is shown here to be different. In separate studies, Tang et al. and Tezel et al. demonstrated that enhancement of skin electrical conductivity achieved during LFS correlated more strongly with broadband emissions, from inertial cavitation, than with subharmonic emissions, from stable cavitation [18, 20]. In the present study, significantly greater IR and DR values were found for the IFS skin-degassed trials in comparison to the sham and control when employing either APO for treatment. However, among these trials, only the subharmonic, not broadband, emission levels measured when either APO was employed were found to be significantly greater than the near-zero emission levels of the control trials, suggesting that stable cavitation may play a greater role during IFS than during LFS. This indication is further supported by the significant and greater correlations of both the IR and the DR values with the subharmonic than with the broadband emission levels (Figure 7, Table 1).
4.2. The role of cavitation during HFS
Similar to the IFS results, skin resistance during HFS was significantly reduced only when significant emissions from cavitation were present, confirming that, similar to LFS and IFS, the permeabilization effect observed during HFS is primarily due to cavitation. However, unlike the IFS trials explored here and the findings of previous LFS studies, significant acoustic emission levels (Figure 4) and corresponding time-dependent skin resistance decreases (Figure 6) were measured when cavitation was isolated outside of the skin (skin-degassed) as well as when cavitation was isolated within the skin (PBS-degassed). Additionally, comparing corresponding IR and DR values between the skin-degassed and PBS-degassed trials provided no significant differences, indicating that a comparable permeabilization effect on skin can be achieved during HFS by cavitation activity outside the skin as cavitation inside the skin.
Cavitation as a primary mechanism of enhancement during HFS was initially recognized by Bommannan et al. [27] and later investigated mechanistically by others, identifying in separate studies that the permeabilization effect incurred during HFS may be induced by cavitation occurring within the skin only [15] and, more recently, that cavitation activity induced outside the skin may play a contributory role [29]. Although the mechanistic conclusions made by these previous authors were based on indirect observations, the results shown in the presentstudy quantitatively confirm both conclusions, that significant skin permeabilization during HFS can be achieved in the presence of cavitation activity within as well as outside the skin.
In a recent study by Park et al., transdermal penetration of FITC-dextrans was shown to be significantly increased by HFS when UCAs were used as cavitation nuclei outside of the skin [29]. These authors concluded that since the acoustic pressures employed were relatively low, the most likely mechanism of enhancement was microstreaming associated with stable cavitation. Although the conclusions made by these authors were based on a theoretical prediction of cavitation activity onset rather than direct observations, skin resistance decreases during HFS were quantitatively shown in the present study to be more strongly related to subharmonic emissions, associated with stable cavitation, than with broadband emissions, associated with inertial cavitation. In comparison to the control and sham trials conducted here, significantly greater IR and DR values were produced during HFS skin-degassed and PBS-degassed trials employing either APO for treatment. Correspondingly, these same trials produced significantly greater subharmonic emission levels than controls when either APO was employed, but did not produce significant broadband emission levels for all trials, indicating that similar to the IFS trials, stable cavitation may play a greater role than inertial cavitation. Furthermore, this indication is supported by the significantly greater correlations of both IR and DR with subharmonic emissions than with broadband emissions.
4.3. Contribution of non-cavitation ultrasound mechanisms
In addition to cavitation, other mechanisms during sonophoresis capable of enhancing penetration across the skin include convection transport, thermal effects, and acoustic streaming [30, 47]. Among these mechanisms, thermal effects from tissue heating are a prevalent and near unavoidable mechanism that alone can result in increased skin permeability [47]. However, tissue heating can be accompanied by adverse bioeffects within the SC, ranging from lipid-associated conformational alterations to irreversible structural perturbations [48], even when skin temperatures are kept below 65 °C. To avoid these adverse effects during sonophoresis, ultrasound is commonly applied in a pulsed mode to minimize tissue heating [16, 18, 22, 23, 49, 50].
Although a pulsing regime was employed in the present study to minimize thermal effects, tissue heating was not fully eliminated. In order to distinguish the effects of tissue heating and other non-cavitation mechanisms on skin resistance from the effects of cavitation, control trials were conducted by suppressing all cavitation activity. The skin resistance reductions incurred during IFS (5.2%±5.4%) and HFS (7.2%±1.9%) control trials can therefore be attributed directly to non-cavitation mechanisms including tissue heating. The skin resistance reductions measured in the control trials, when cavitation was suppressed, were significantly less than when cavitation was present during sonophoresis using either investigated frequency regime, further indicating the significant role of cavitation during IFS and HFS. These results are consistent with other studies which have shown that low-grade skin temperature increases, comparable to the 5 °C increases measured here, have a negligible effect on skin permeability during LFS [18, 20] and HFS [27, 51]. Furthermore, post-treatment normalized skin resistance measured for all control trials began to increase immediately after treatment, indicating that the resistance reductions observed here due solely to low-grade tissue heating and other non-cavitation mechanisms were reversible.
4.4. Assessment of post-treatment skin resistance recovery
Skin resistance measurements made over 30 minutes immediately following sonophoresis in this study were used to characterize the reversibility, longevity, and time-dependent recovery of the skin barrier properties in order to satisfy safety concerns and to identify potential modes of application. The approximately linear increase of skin resistance measured immediately after ultrasound was turned off (Figures 5 and 9a) indicates that the perturbations made to skin during IFS and HFS were reversible and non-permanent for all exposure conditions. These results are not dissimilar from the findings of other investigations which have shown that the barrier reductions incurred during LFS are also reversible and non-permanent [35, 36, 50].
The time required for the skin barrier to repair after sonophoresis was shown in the present study to increase in duration as the reduction of resistance achieved during IFS and HFS increased (Figure 10), a phenomenon that has likewise been observed in other studies after LFS treatments. Skin resistance has shown to fully recover or exceed the initial pre-treated value within minutes of treatment being terminated when relatively small resistance reductions (< 10%) due to LFS have been observed [35], while relatively large skin resistance reductions (> 95%) have been shown to recover more slowly, requiring 42 hours for the reduced value to recover by a factor of 10 [36]. In other cases, relatively large (> 95%) and moderate (60%) skin resistance reductions incurred during LFS have shown to recover by a factor of 2 and 1.2 times the reduced value after 2 hours [50], corresponding to approximate rates of recovery of 2 and 5% per hour, respectively. In comparison, over the range of skin resistance reductions observed in the present study (< 70%), skin resistance recovered at rates of approximately 3 and 8% per hour after IFS and HFS, respectively.
4.5. Sonophoresis treatment implications
Considering the similar locations where permeability-enhancing cavitation occurs among IFS and LFS treatments, future IFS studies may benefit from employing techniques that have previously been used to increase the efficacy of LFS by increasing the occurrence of cavitation activity outside the skin. These techniques include the addition of cavitation nuclei, such as insoluble porous resins [23], to the coupling medium outside the skin or simultaneous application of high-frequency ultrasound to nucleate small bubbles near the skin surface, which then cavitate in response to the lower-frequency ultrasound used for sonophoresis [24]. For HFS treatments, although cavitation activity within skin contributes to the overall permeabilization, optimizing and controlling cavitation within skin tissue may be challenging due to the sparse preexistence of gas bodies and the spatially variable threshold to initiate cavitation activity in living tissue [52]. Instead, since cavitation outside of the skin also plays a role during HFS, promoting cavitation in the coupling medium outside the skin, similar to LFS and IFS applications, may be more suitable due to easier control of cavitation in solution rather than in tissue. This may be accomplished by use of ultrasound contrast agents (UCA) as cavitation nuclei in the medium outside the skin [29, 53], since UCA encapsulated microbubbles are manufactured within a size distribution resonant to high-frequency ultrasound (approximately 2–8 MHz) [54]. Additionally, considering the significant dependence of skin resistance reduction on the presence of subharmonic-producing cavitation during IFS and HFS, treatment efficacy of both frequency regimes may be further improved by optimizing pulsed-ultrasound exposure parameters, such as modifying the duration of the pulse and quiescent periods, to sustain and maximize stable cavitation activity similar to methods developed to improve the efficacy of ultrasound-enhanced thrombolysis [6].
One potential benefit to treatment safety offered by IFS and HFS, in comparison to LFS, is that significant perturbations to the skin barrier for enhanced drug delivery can be achieved using acoustic pressures that are sufficiently high to elicit subharmonic bubble oscillations in solution, but low enough to avoid significant inertial cavitation activity. This is significant since unintended bioeffects associated with stable cavitation are often less harmful that those of inertial cavitation. For example, stable cavitation is capable of transiently increasing permeability of cell membranes in living tissue, but these perturbations are relatively short-lived and reversible (reversible sonoporation) [7]. On the other hand, the more violent fluid dynamics associated with inertial cavitation can lead to more damaging and long-lasting bioeffects in adjacent tissue and vasculature, such as permanent deformation of cellular membranes (non-repairable sonoporation) [7] or rupture of red blood cells (hemolysis) [55]. In addition to safety concerns during IFS and HFS, inertial cavitation may also be undesirable during treatment since the transient destruction of cavitation nuclei may diminish the potential for sustained stable cavitation, therefore reducing its beneficial, permeabilizing effects on the skin barrier.
The long-lasting, though reversible, effect on skin permeability after ultrasound exposure has been utilized among several recent studies to offer sonophoresis as a pretreatment to drug administration [16, 23, 24]. Clinically, the pretreatment mode is advantageous over the simultaneous mode, applying ultrasound with the therapeutic agent simultaneously, since the requirement of the patient to wear a device throughout delivery is eliminated. However, the pretreatment mode is largely reliant on large magnitude barrier perturbation during and after ultrasound exposure, which in comparison to IFS and HFS, has previously only been achieved for LFS applications [19, 49]. Utilizing the cavitation mechanisms shown here to achieve a greater permeabilization effect on skin during sonophoresis in future treatments may enable pre-treatment as a viable application mode for IFS and HFS. Future sonophoresis treatments may then be specifically designed to utilize a particular ultrasound frequency regime for treatment based on the time required for skin to remain in a state of high permeability. For example, for treatments that require a state of enhanced skin permeability over a short duration with a more rapid recovery of the skin barrier, such as glucose extraction and insulin delivery [56], the use of HFS may be more appropriate and for applications that require delivery to be maintained over a long time period, therefore requiring a slow barrier recovery, for applications such as hormone delivery [32], the use of IFS or LFS may be more applicable.
In separate comparative in vitro studies, LFS has been shown to decrease skin permeability to a greater degree than both IFS [19] and HFS [50]. Nonetheless, the clinical relevance of sonophoresis using higher-frequency ultrasound is evident as HFS has been used in far more in vivo human trials than LFS, proving to be a safe and effective method of enhancing the transdermal delivery of over 30 molecules of varying lipophilicities (log Ko/w −4.75 to 5.25), and relatively low-molecular weight (< 1000 Da) in most cases [30]. Considering that the limitations of IFS and HFS identified in previous studies have all been observed in experiments with ultrasound exposure and other treatment conditions not specifically optimized to elicit cavitation activity, greater permeabilization may be achieved by specifically designing treatment conditions to exploit cavitation. For example, Park et al. demonstrated in a recent set of in vivo rat experiments that in comparison to traditional exposure conditions, not optimized to elicit cavitation, the transdermal penetration of relatively high-molecular weight (up to 150 kDa) FITC-dextrans can be significantly increased by HFS when the medium outside of the skin is seeded with cavitation nuclei in the form of UCAs [29]. Additionally, considering that skin impedance quantitatively relates to the permeability of skin for a variety of permeants, ranging in molecular weight (180–70,000 kDa) and lipophilicity (log Ko/w —3 to 4.13), and the distinct relationship between skin resistance reductions and specific cavitation activity elucidated here for IFS and HFS, suggests that future treatments designed to maximize and sustain these permeability-enhancing mechanisms may broaden the range of compounds that can be delivered across the skin.
5.Conclusions
In this study, we demonstrate the dependence of skin resistance reduction, a surrogate measure for permeability enhancement, on acoustic cavitation during IFS and HFS. The specific location(s) and type(s) of cavitation that lead to significant skin resistance reductions were shown to be different between the two frequency regimes. When skin was treated with HFS, significant acoustic emissions from cavitation were accompanied with significant reductions of skin resistance when cavitation was isolated either outside of the skin only or within the skin only. The initial rapid decrease and the end-of-treatment reduction of skin resistance during HFS was shown to correlate significantly greater with subharmonic than with broadband emissions, emanating from stable and inertial cavitation, respectively. When skin was treated with IFS, significant acoustic emissions from cavitation and significant reductions of skin resistance were observed exclusively when cavitation was isolated outside of the skin only. The initial rapid decrease of skin resistance during IFS correlated equally with subharmonic and broadband emissions, while the total relative reduction was shown to correlate significantly greater with subharmonic emissions. The reduction of skin resistance incurred during treatment using either investigated frequency regime was shown to be reversible after all treatments. However, skin resistance recovered more slowly and required a greater time duration to fully recover after HFS than after IFS treatment. The results of this study may be used in future investigations to improve IFS and HFS efficacy by designing treatments to exploit the specific cavitation mechanisms associated with each frequency regime identified here in order to reduce required treatment times while also maximizing skin permeabilization. Furthermore, the frequency regime used for treatment can be chosen considering the time required for the skin barrier to recover.
Acknowledgments
This research was supported by the National Science Foundation (NSF) Integrative Graduate Education and Research Traineeship (IGERT) Program in BioApplications of Membrane Science and Technology (0333377), NSF Minimally Invasive Technologies Center (MIMTeC) I/UCRC (IIP-0652208), and National Institutes of Health grant R21 EB008483.
Footnotes
Publisher's Disclaimer: This is a PDF file of an unedited manuscript that has been accepted for publication. As a service to our customers we are providing this early version of the manuscript. The manuscript will undergo copyediting, typesetting, and review of the resulting proof before it is published in its final citable form. Please note that during the production process errors may be discovered which could affect the content, and all legal disclaimers that apply to the journal pertain.
References
- [1].Mitragotri S, Breaking the skin barrier, Adv. Drug Deliv. Rev 56 (5) (2004) 555–556. [DOI] [PubMed] [Google Scholar]
- [2].Mitragotri S, Healing sound: the use of ultrasound in drug delivery and other therapeutic applications, Nat. Rev. Drug Discov 4 (3) (2005) 255–260. [DOI] [PubMed] [Google Scholar]
- [3].Coussios CC, Roy RA, Applications of acoustics and cavitation to noninvasive therapy and drug delivery, Annu. Rev. Fluid Mech 40 (2008) 395–420. [Google Scholar]
- [4].McDannold N, Vykhodtseva N, Hynynen K, Targeted disruption of the blood-brain barrier with focused ultrasound: association with cavitation activity, Phys. Med. Biol 51 (4) (2006) 793–807. [DOI] [PubMed] [Google Scholar]
- [5].Datta S, Coussios CC, McAdory LE, Tan J, Porter T, De Courten-Myers G, Holland CK, Correlation of cavitation with ultrasound enhancement of thrombolysis, Ultrasound Med. Biol 32 (8) (2006) 1257–1267. [DOI] [PMC free article] [PubMed] [Google Scholar]
- [6].Hitchcock KE, Ivancevich NM, Haworth KJ, Caudell Stamper DN, Vela DC, Sutton JT, Pyne-Geithman GJ, Holland CK, Ultrasound-enhanced rt-PA thrombolysis in an ex vivo porcine carotid artery model, Ultrasound Med. Biol 37 (8) (2011) 1240–1251. [DOI] [PMC free article] [PubMed] [Google Scholar]
- [7].Wu J, Nyborg WL, Ultrasound, cavitation bubbles and their interaction with cells, Adv. Drug Deliv. Rev 60 (10) (2008) 1103–1116. [DOI] [PubMed] [Google Scholar]
- [8].Eller A, Flynn H, Generation of subharmonics of order one-half by bubbles in a sound field, J. Acoust. Soc. Am 44 (1968) 368–369. [Google Scholar]
- [9].Leighton T, The Acoustic Bubble, Academic Press, London, 1994. [Google Scholar]
- [10].Elder SA, Cavitation microstreaming J Acoust. Soc. Am 31 (1959) 54–64. [Google Scholar]
- [11].Prosperetti A, Bubble phenomena in sould fields: part two, Ultrasonics 22 (3) (1984) 115–124. [Google Scholar]
- [12].Pecha R, Gompf B, Microimplosions: cavitation collapse and shock wave emission on a nanosecond time scale, Phys. Rev. Lett 84 (6) (2000) 1328–1330. [DOI] [PubMed] [Google Scholar]
- [13].Wu J, Chappelow J, Yang J, Weimann L, Defects generated in human stratum corneum specimens by ultrasound, Ultrasound Med. Biol 24 (5) (1998) 705–710. [DOI] [PubMed] [Google Scholar]
- [14].Paliwal S, Menon GK, Mitragotri S, Low-frequency sonophoresis: ultrastructural basis for stratum corneum permeability assessed using quantum dots, J. Invest. Dermatol 126 (5) (2006) 1095–1101. [DOI] [PubMed] [Google Scholar]
- [15].Mitragotri S, Edwards DA, Blankschtein D, Langer R, A mechanistic study of ultrasonically-enhanced transdermal drug delivery, J. Pharm. Sci 84 (6) (1995) 697–706. [DOI] [PubMed] [Google Scholar]
- [16].Tang H, Blankschtein D, Langer R, Effects of low-frequency ultrasound on the transdermal permeation of mannitol: Comparative studies with in vivo and in vitro skin, J. Pharm. Sci 91 (8) (2002) 1776–1794. [DOI] [PubMed] [Google Scholar]
- [17].Tezel A, Sens A, Tuchscherer J, Mitragotri S, Frequency dependence of sonophoresis, Pharm. Res 18 (12) (2001) 1694–1700. [DOI] [PubMed] [Google Scholar]
- [18].Tang H, Wang CCJ, Blankschtein D, Langer R, An investigation of the role of cavitation in low-frequency ultrasound-mediated transdermal drug transport, Pharm. Res 19 (8) (2002) 1160–1169. [DOI] [PubMed] [Google Scholar]
- [19].Ueda H, Mutoh M, Seki T, Kobayashi D, Morimoto Y, Acoustic cavitation as an enhancing mechanism of low-frequency sonophoresis for transdermal drug delivery, Biol. Pharm. Bull 32 (5) (2009) 916–920. [DOI] [PubMed] [Google Scholar]
- [20].Tezel A, Sens A, Mitragotri S, Investigations of the role of cavitation in low-frequency sonophoresis using acoustic spectroscopy, J. Pharm. Sci 91 (2) (2002) 444–453. [DOI] [PubMed] [Google Scholar]
- [21].Tezel A, Mitragotri S, Interactions of inertial cavitation bubbles with stratum corneum lipid bilayers during low-frequency sonophoresis, Biophys. J 85 (6) (2003) 3502–3512. [DOI] [PMC free article] [PubMed] [Google Scholar]
- [22].Wolloch L, Kost J, The importance of microjet vs shock wave formation in sonophoresis, J. Control. Release 148 (2) (2010) 204–211. [DOI] [PubMed] [Google Scholar]
- [23].Terahara T, Mitragotri S, Langer R, Porous resins as a cavitation enhancer for low-frequency sonophoresis, J. Pharm. Sci 91 (3) (2002) 753–759. [DOI] [PubMed] [Google Scholar]
- [24].Schoellhammer CM, Polat BE, Mendenhall J, Maa R, Jones B, Hart DP, Langer R, Blankschtein D, Rapid skin permeabilization by the simultaneous application of dual-frequency, high-intensity ultrasound, J. Control. Release 163 (2) (2012) 154—160. [DOI] [PMC free article] [PubMed] [Google Scholar]
- [25].Yang X, Roy RA, Holt RG, Bubble dynamics and size distributions during focused ultrasound insonation, J. Acoust. Soc. Am 116 (2004) 3423–3431. [DOI] [PubMed] [Google Scholar]
- [26].Simonin J-P, On the mechanisms of in vitro and in vivo phonophoresis, J. Control. Release 33 (1) (1995) 125–141. [Google Scholar]
- [27].Bommannan D, Menon GK, Okuyama H, Elias PM, Guy RH, Sonophoresis. ii. examination of the mechanism(s) of ultrasound-enhanced transdermal drug delivery, Pharm. Res 9 (8) (1992) 1043–1047. [DOI] [PubMed] [Google Scholar]
- [28].Menon GK, Bommannan D, Elias P, High-frequency sonophoresis: permeation pathways and structural basis for enhanced permeability, Skin Pharmacol. Physiol 7 (3) (1994) 130–139. [DOI] [PubMed] [Google Scholar]
- [29].Park D, Ryu H, Kim HS, Kim Y-S, Choi K-S, Park H, Seo J, Sonophoresis using ultrasound contrast agents for transdermal drug delivery: An in vivo experimental study, Ultrasound Med. Biol 38 (4) (2012) 642–650. [DOI] [PubMed] [Google Scholar]
- [30].Polat BE, Hart D, Langer R, Blankschtein D, Ultrasound-mediated transdermal drug delivery: mechanisms, scope, and emerging trends, J. Control. Release 152 (3) (2011) 330–348. [DOI] [PMC free article] [PubMed] [Google Scholar]
- [31].Karande P, Jain A, Mitragotri S, Relationships between skin’s electrical impedance and permeability in the presence of chemical enhancers, J. Control. Release 110 (2) (2006) 307–313. [DOI] [PubMed] [Google Scholar]
- [32].Tezel A, Sens A, Mitragotri S, Description of transdermal transport of hydrophilic solutes during low-frequency sonophoresis based on a modified porous pathway model, J. Pharm. Sci 92 (2) (2003) 381–393. [DOI] [PubMed] [Google Scholar]
- [33].Tang H, Mitragotri S, Blankschtein D, Langer R, Theoretical description of transdermal transport of hydrophilic permeants: Application to low-frequency sonophoresis, J. Pharm. Sci 90 (5) (2001) 545–568. [DOI] [PubMed] [Google Scholar]
- [34].Curdy C, Kalia YN, Guy RH, Post-iontophoresis recovery of human skin impedance in vivo, Eur. J. Pharm. Biopharm 53 (1) (2002) 15–21. [DOI] [PubMed] [Google Scholar]
- [35].Cancel LM, Tarbell JM, Ben-Jebria A, Fluorescein permeability and electrical resistance of human skin during low frequency ultrasound application, J. Pharm. Pharmacol 56 (9) (2004) 1109–1118. [DOI] [PubMed] [Google Scholar]
- [36].Gupta J, Prausnitz MR, Recovery of skin barrier properties after sonication in human subjects, Ultrasound Med. Biol 35 (8) (2009) 1405–1408. [DOI] [PMC free article] [PubMed] [Google Scholar]
- [37].Harrison S, Barry B, Dugard P, Effects of freezing on human skin permeability, J. Pharm. Pharmacol 36 (4) (1984) 261–262. [DOI] [PubMed] [Google Scholar]
- [38].Kasting GB, Bowman LA, Electrical analysis of fresh, excised human skin: a comparison with frozen skin, Pharm. Res 7 (11) (1990) 1141–1146. [DOI] [PubMed] [Google Scholar]
- [39].Barbero AM, Frasch HF, Pig and guinea pig skin as surrogates for human in vitro penetration studies: A quantitative review, Toxicol. in Vitro 23 (1) (2009) 1–13. [DOI] [PubMed] [Google Scholar]
- [40].Godin B, Touitou E, Transdermal skin delivery: Predictions for humans from in vivo, ex vivo and animal models, Adv. Drug Deliv. Rev 59 (11) (2007) 1152–1161. [DOI] [PubMed] [Google Scholar]
- [41].Mast TD, Salgaonkar VA, Karunakaran C, Besse JA, Datta S, Holland CK, Acoustic emissions during 3.1 mhz ultrasound bulk ablation in vitro, Ultrasound Med. Biol 34 (9) (2008) 1434–1448. [DOI] [PMC free article] [PubMed] [Google Scholar]
- [42].Welch P, The use of fast fourier transform for the estimation of power spectra: a method based on time averaging over short, modified periodograms, IEEE Trans. on Audio and Electroacoustics 15 (2) (1967) 70–73. [Google Scholar]
- [43].R Core Team, R: A Language and Environment for Statistical Computing, R Foundation for Statistical Computing, Vienna, Austria: (2013). URL http://www.R-project.org [Google Scholar]
- [44].Scheuplein RJ, Mechanism of percutaneous absorption, J. Invest. Dermatol 48 (1) (1967) 79–88. [PubMed] [Google Scholar]
- [45].Holbrook KA, Odland GF, Regional differences in the thickness (cell layers) of the human stratum corneum: an ultrastructural analysis, J. Invest. Dermatol 62 (4) (1974) 415–422. [DOI] [PubMed] [Google Scholar]
- [46].Yang X, Church CC, A model for the dynamics of gas bubbles in soft tissue, J. Acoust. Soc. Am 118 (2005) 3595–3606. [DOI] [PubMed] [Google Scholar]
- [47].Mitragotri S, Temperature dependence of skin permeability to hydrophilic and hydrophobic solutes, J. Pharm. Sci 96 (7) (2007) 1832–1839. [DOI] [PubMed] [Google Scholar]
- [48].Gay CL, Guy RH, Golden GM, Mak VH, Francoeur ML, Characterization of low-temperature (ie,< 65 c) lipid transitions in human stratum corneum, J. Invest. Dermatol 103 (2) (1994) 233–239. [DOI] [PubMed] [Google Scholar]
- [49].Mitragotri S, Blankschtein D, Langer R, et al. , Ultrasound-mediated transdermal protein delivery, Science 269 (5225) (1995) 850–853. [DOI] [PubMed] [Google Scholar]
- [50].Mitragotri S, Blankschtein D, Langer R, Transdermal drug delivery using low-frequency sonophoresis, Pharm. Res 13 (3) (1996) 411–420. [DOI] [PubMed] [Google Scholar]
- [51].Levy D, Kost J, Meshulam Y, Langer R, Effect of ultrasound on transdermal drug delivery to rats and guinea pigs., J. Clin. Invest 83 (6) (1989) 2074–2078. [DOI] [PMC free article] [PubMed] [Google Scholar]
- [52].Fry FJ, Sanghvi NT, Foster RS, Bihrle R, Hennige C, Ultrasound and microbubbles: their generation, detection and potential utilization in tissue and organ therapy—experimental, Ultrasound Med. Biol 21 (9) (1995) 1227–1237. [DOI] [PubMed] [Google Scholar]
- [53].Park D, Yoon J, Park J, Jung B, Park H, Seo J, Transdermal drug delivery aided by an ultrasound contrast agent: an in vitro experimental study, Open Biomed. Eng. J 4 (2010) 56–62. [DOI] [PMC free article] [PubMed] [Google Scholar]
- [54].Klibanov AL, Ultrasound contrast agents: development of the field and current status, in: Contrast agents II, Springer, 2002, pp. 73–106. [Google Scholar]
- [55].Everbach EC, Makin IRS, Azadniv M, Meltzer RS, Correlation of ultrasound-induced hemolysis with cavitation detector output in vitro, Ultrasound Med. Biol 23 (4) (1997) 619–624. [DOI] [PubMed] [Google Scholar]
- [56].Kost J, Ultrasound-assisted insulin delivery and noninvasive glucose sensing, Diabetes Technol. Ther 4 (4) (2002) 489–497. [DOI] [PubMed] [Google Scholar]