Abstract
Aim
Nonalcoholic steatohepatitis (NASH) is the consequence of insulin resistance, fatty acid accumulation, oxidative stress, and lipotoxicity. We hypothesize that an increase in the inflammatory adipokine NOV decreases antioxidant Heme Oxygenase 1 (HO-1) levels in adipose and hepatic tissue, resulting in the development of NASH in obese mice.
Methods
Mice were fed a high fat diet (HFD) and obese animals were administered an HO-1 inducer with or without an inhibitor of HO activity to examine levels of adipose-derived NOV and possible links between increased synthesis of inflammatory adipokines and hepatic pathology.
Results
NASH mice displayed decreased HO-1 levels and HO activity, increased levels of hepatic heme, NOV, MMP2, hepcidin, and increased NAS scores and hepatic fibrosis. Increased HO-1 levels are associated with a decrease in NOV, improved hepatic NAS score, ameliorated fibrosis, and increases in mitochondrial integrity and insulin receptor phosphorylation. Adipose tissue function is disrupted in obesity as evidenced by an increase in proinflammatory molecules such as NOV and a decrease in adiponectin. Importantly, increased HO-1 levels are associated with a decrease of NOV, increased adiponectin levels, and increased levels of thermogenic and mitochondrial signaling associated genes in adipose tissue.
Conclusions
These results suggest that the metabolic abnormalities in NASH are driven by decreased levels of hepatic HO-1 that is associated with an increase in the adipose-derived proinflammatory adipokine NOV in our obese mouse model of NASH. Concurrently, induction of HO-1 provides protection against insulin resistance as seen by increased insulin receptor phosphorylation. Pharmacological increases in HO-1 associated with decreases in NOV may offer a potential therapeutic approach in preventing fibrosis, mitochondrial dysfunction, and the development of NASH.
1. Introduction
Metabolic syndrome and its associated pathologies of obesity, insulin resistance (IR), and dyslipidemia are often accompanied by liver involvement, defined as nonalcoholic fatty liver disease (NAFLD) [1]. NAFLD's progression to nonalcoholic steatohepatitis (NASH), characterized by low grade inflammation, cell ballooning, and mitochondrial dysfunction, is a primary risk factor for development of fibrosis and cirrhosis and therefore an important area of clinical research [2]. Chronic, low grade inflammation due to metabolic syndrome is provoked when the capacity for adipocytes to store fat is overwhelmed resulting in the production of inflammatory cytokines leading to metabolic inflammation [3]. Fatty acids released from hypertrophic, dysfunctional, and insulin resistant adipocytes, together with increased hepatic de novo lipogenesis and impaired (FA) fatty acid export, cause an accumulation of triglycerides in the liver leading to lipotoxicity [4]. Increased calorie intake and obesity lead to an increase in tissue fat mass through adipocyte hyperplasia and hypertrophy, subsequently resulting in a decrease in adiponectin and an increase of inflammatory TNF-α causing IR, inflammation, and oxidative stress in the liver [5]. Reactive oxygen species (ROS) can induce lipid peroxidation leading to inflammation and liver damage [6, 7]. Steatotic livers are more sensitive to increased ROS and oxidative stress, leading to mitochondrial dysfunction, decreased levels of hepatocyte antioxidants, and inflammation, and culminating in NASH and fibrosis [8, 9].
Induction of HO-1, an antioxidant gene highly inducible in a range of cells, including erythrocyte phagocytosing Kupffer cells and splenic macrophages and in all organs, including fat tissues, but excluding testes and brain, confers advantageous effects in metabolic syndrome [10, 11]. Cobalt protoporphyrin (CoPP) induction of HO-1 contributes to the phosphorylation of the insulin receptor, thus improving insulin sensitivity [12, 13]. Additionally, HO-1 acts through the degradation products of the prooxidant heme, bilirubin, and biliverdin, antioxidants that increase mitochondrial fusion, while also serving to improve adipocyte function and remodeling by increasing levels of adiponectin expression [14, 15]. Humans with low levels of HO-1 suffer severe oxidative stress and organ failure and demonstrate iron deposits in the liver [16, 17]. CoPP has been used to prevent body weight gain, increase oxygen consumption, and decrease fasting blood glucose in rats and mice [18] (reviewed in [11]). Recently, CoPP decreased expression of proapoptotic protein, abridge percolation of inflammatory cells, and reduced AST and ALT levels in IR induced liver damage [19, 20]. Moreover, HO-1 induction increased mitofusion over fission related proteins and improved mitochondrial quality control [21].
In adipose tissues, induction of HO-1 has been shown to reduce body weight, decrease NOV, and increase PGC-1α mediated thermogenesis, thereby increasing energy uptake and the stimulation of mitochondrial FA oxidation [22]. Adipose PGC-1α serves as a key moderator of energy metabolism and promotes mesenchymal stem cell differentiation into brown fat adipocytes [23] and the browning of white fat to a distinct phenotype known as brite fat, which aids in the prevention of the development of metabolic syndrome and type 2 diabetes mellitus (T2DM) [24].
Another important component of metabolic syndrome is an increase in the levels of the prooxidant heme. Intracellular heme levels play a central role in the regulation of many cell functions [25–27]. Inflammatory increases in IL-6 upregulate hepcidin and iron trapping in Kupffer cell diseases [1]. The resulting increase in cellular heme decreases levels of PGC-1α, lipid metabolism, and adipogenesis [28].
The recently discovered inflammatory adipokine, NOV/CCN3 gene (nephroblastoma overexpressed) [29], is also shown to be repressed in conditions of increased HO-1 levels [22]. This protein plays key roles in inflammation, wound healing, fibrosis, and cancers [29]. NOV is involved in the adhesion, migration, proliferation, differentiation, and survival of different cell types [29] and modulates the expression of inflammatory molecules [30, 31].
In adipose tissues, induction of HO-1 has been shown to reduce body weight, decrease NOV, and increase PGC-1α mediated thermogenesis, thereby increasing energy uptake and the stimulation of mitochondrial FA oxidation [22]. Adipose PGC-1α serves as a key moderator of energy metabolism and promotes mesenchymal stem cell differentiation into brown fat adipocytes [23] and the browning of white fat to a distinct phenotype known as brite fat, which aids in the prevention of the development of metabolic syndrome and type 2 diabetes mellitus (T2DM) [24].
A recent study in mice has shown that myeloid-specific depletion of NOV exacerbates liver injury in a mouse model of NAFLD [32]. However, global NOV−/− mice fed a HFD have less steatosis compared to WT mice, and hepatic triacylglycerol content is reduced by approximately threefold [29].
We hypothesize that the development of NASH is the result of the combination of increased NOV and inflammation and a decrease of HO-1 in adipose and hepatic tissues leading to the impairment of mitochondrial function. We further propose that induction of HO-1 in adipose tissues will have positive impact on hepatic tissue and reverse the negative effects on NOV levels, decreasing NASH scores and increasing mitochondrial integrity and function.
2. Methods
Eight-week-old C57Bl6 male mice were fed a high fat diet (HFD) for 20 weeks, a time frame in which the manifestations of NASH are present. Mice were divided into four groups of 6 animals each: (1) control normal chow diet; (2) HFD; (3) HFD treated for the last 8 weeks with cobalt protoporphyrin (CoPP) (once/week a dose of 5 mg/100 g, bw); and (4) HFD treated for the last 8 weeks with CoPP and the last 3 weeks with tin mesoporphyrin (SnMP at a dose of 20 mg/100 g BW), an inhibitor of HO activity (twice/week). BW at the end of the 20-week period C57 lean, range; 29-31; HF; 56-59, HF-CoPP; 34-39, CoPP-SnMP; 47-51 gm, blood glucose and alanine aminotransferase (ALT) were measured as described [22, 33]. All animal experiments followed the NYMC IACUC institutionally approved protocol in accordance with the NIH guidelines.
2.1. Histopathological Examination of Hepatic Tissue, NAS Score Evaluation, and Hepatic Lipid Droplet Analysis
Liver samples from each experimental group were fixed in 4% paraformaldehyde, dehydrated, embedded in paraffin wax, and sectioned (6 μm thick). The main liver histopathological features commonly described in NAFLD including steatosis, inflammation, hepatocyte ballooning, and fibrosis were scored according to the NAFLD histologic activity score (NAS) system, and lipid droplet analysis was performed as previously described [33–35]. Briefly, double-blinded analysis identified the degree of steatosis and NASH (grade 0 ≤ 5%; 1 = 5–33%; grade 2 = 34%–66%; grade 3 ≥ 66%), lobular inflammation (0: no foci, 1 < 2 foci per 200x field, 2: 2 to 4 foci per 200x field, and 3: >4 foci per 200x field), hepatocyte ballooning (0: none; 1: rare or few; 2: many), and fibrosis (0: no fibrosis, 1: perisinusoidal or periportal fibrosis, 2: perisinusoidal and portal/perioral fibrosis, 3: bridging fibrosis, and 4: cirrhosis) [34].
2.2. Real-Time qPCR, Western Blot Analysis, HO Activity, Heme Measurement, and O2 Consumption
Total RNA and protein were extracted from liver and visceral adipose tissue and gene expression analysis was performed by RNeasy® Lipid Tissue (Qiagen), as indicated by the manufacturer [24, 33]. RNA was determined by measuring the absorbance at 260 nm (A260) with a Biotek™ plate reader and the Take3™ plate (Biotek, Winooski, VT) and assessed by the A260/A280 ratio. cDNA was synthesized from total RNA (Applied Biosystems) using a High Capacity cDNA Reverse Transcription Kit (Applied Biosystems). Real-time PCR was performed using TaqMan® Fast Universal Master Mix (2x), on a 7500 HT Fast Real-Time PCR System (Applied Biosystems). For western blotting analyses, tissue was lysed in RIPA lysis buffer supplemented with protease and phosphatase inhibitors (Complete™ Mini and PhosSTOP™, Roche Diagnostics, Indianapolis, IN as previously described [35]. Heme levels were determined by ELISA (BioVision, Inc., Milpitas, CA) as described [35].
HO activity was determined as described [36]. Briefly, freshly lysed and homogenized tissue samples were incubated in sealed vials at 37°C for 90 min with 30 μM heme, and 2 mM NADPH, in the absence or presence of an HO inhibitor, SnMP (50 μM). After termination of reaction, headspace gas was analyzed for CO with C13O16 added as an internal standard. CO measurements were performed using an Agilent 5890 GC-MS. HO activity is calculated by subtracting CO levels obtained in the presence of SnMP from those obtained without. Data are normalized to total protein and are presented as pmol CO/mg protein/h.
Mouse oxygen consumption was assessed as described [22, 24]. Briefly, oxygen consumption (VO2) and carbon dioxide production (VCO2) were measured using the Oxylet gas analyzer and air flow unit (Oxylet; Panlab-Bioseb, Vitrolles, France). Hourly respiratory quotients were measured and performed twice, on individual mice using the VCO2 and VO2 obtained by the gas analyzer. The results are expressed as the consumed VO2 per kilogram body weight per minute (ml/kg/min). The respiratory quota is expressed as CO2 eliminated/O2 consumed.
2.3. Isolation and Development of NOV Overexpressing Adipocytes
Viral transduction was performed as previously described [35]. Briefly, 1x10⁶ cells were seeded per well of a 6-well plate 24 h prior to transduction. The cells were incubated with the transduction medium (1x10⁶ transducing units (TU) of lentiviral particles (Precision LentiORF for NOV (Dharmacon, Lafayette, CO)) in 0.5ml α-MEM growth medium supplemented with polybrene (8 μg/ml) for 3h to maximize the contact between each cell and lentiviral particles. Additional culture medium supplemented with polybrene was then added to each well. After an additional 48 h incubation, antibiotic selection medium was used to kill all the nontransduced cells.
2.4. Statistical Analyses
Statistical significance between experimental groups was determined by Student's t-test for pairwise comparison between groups or by ANOVA with Tukey-Kramer post hoc analysis for comparison between multiple groups. The data are presented as means ± SEM and the null hypothesis was rejected at p<0.05.
3. Results
3.1. HO-1 Induction Prevents Fibrosis and Decreases NASH Score
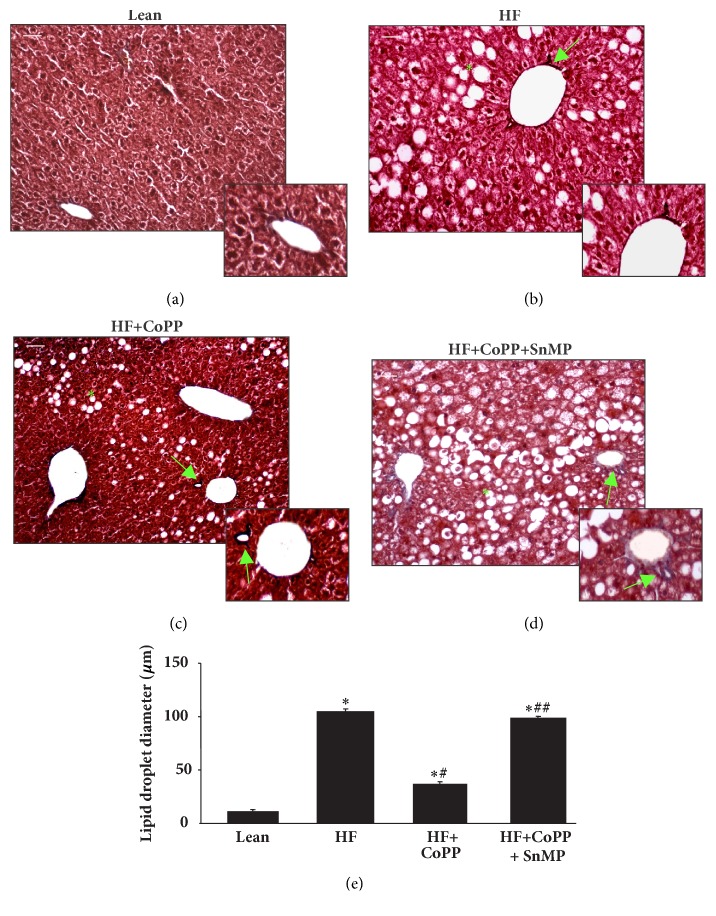
As expected, livers of lean mice showed no significant evidence of steatosis (0.67% of cells positive for intracellular lipid accumulation) with only rare ballooning and no inflammatory foci and no fibrosis. The livers from HF mice revealed a higher NAS score (NAS: 9) with elevated steatosis, moderate lobular inflammatory loci, significant hepatocyte ballooning, and fibrosis (Table 1; Figures 1(a)–1(e)). Increased HO-1 expression with CoPP improved this score (NAS: 3), diminished all the pathological parameters, and resulted in mild steatosis, rare inflammatory loci and ballooning, and no fibrosis. Inhibition of HO activity in HF mice caused perisinusoidal steatosis and ballooning and portal fibrosis (NAS: 8). Furthermore, the adverse effect of hepatosteatosis was confirmed by detailed morphometrical analysis of liver lipid droplet diameter (Figures 1(a)–1(e)). From these results, we conclude that increased levels of HO-1 can prevent lipid droplet formation in the liver, ultimately preventing the development of NAFLD and NASH in obese mice.
Table 1.
Histopathological NAS score evaluation. Degree of steatosis and NASH (grade 0 ≤ 5%; 1 = 5–33%; grade 2 = 34%–66%; grade 3 ≥ 66%), lobular inflammation (0: no foci, 1 < 2 foci per 200x field, 2: 2 to 4 foci per 200x field, and 3: foci per 200x field), hepatocyte ballooning (0: none; 1: rare or few; 2: many), and fibrosis (0: no fibrosis, 1: perisinusoidal or periportal fibrosis, 2: perisinusoidal and portal/perioral fibrosis, 3: bridging fibrosis, and 4: cirrhosis).
| NAS pathological score factors | Control | HF | HF + CoPP | HF + CoPP + SnMP |
|---|---|---|---|---|
| Steatosis | 0 (0.67%) | 2 (42.24%) | 1 (10.28%) | 2 (33.05%) |
| Inflammation | 0 (no foci) | 2 (2-4 foci/field) | 1 (<2 foci/field) | 2 (2-4 foci/field) |
| Ballooning | 1 (rare) | 2 (many) | 1 (rare) | 2 (many) |
| Fibrosis | 0 (no fibrosis) | 3 (bridging fibrosis) | 0 (no fibrosis) | 2 (perisinusoidal and portal fibrosis) |
| NAS value | 1 | 9 NASH | 3 | 8 NASH |
Figure 1.
HO-1 induction prevents fibrosis and decreases NASH score. Liver of lean (a), HF fed (b), HF fed treated with CoPP (c), and HF fed treated with CoPP and SnMP (d) in mice and (e) graph summarizes the morphometrical analysis of liver lipid droplet diameter. ∗ p< 0.05 versus lean; # p< 0.05 versus HF fed; and + p< 0.05 versus HF fed mice + CoPP. Masson's trichrome staining. Bar 20 μm. The arrow shows hepatic perivascular fibrosis and (∗) indicates the steatosis of control lean mice, HF fed mice, HF fed mice + CoPP, and HF fed mice + CoPP + SnMP.
3.2. Induction of HO-1 Decreases NOV and Fibrotic Markers and Improves ALT and AST
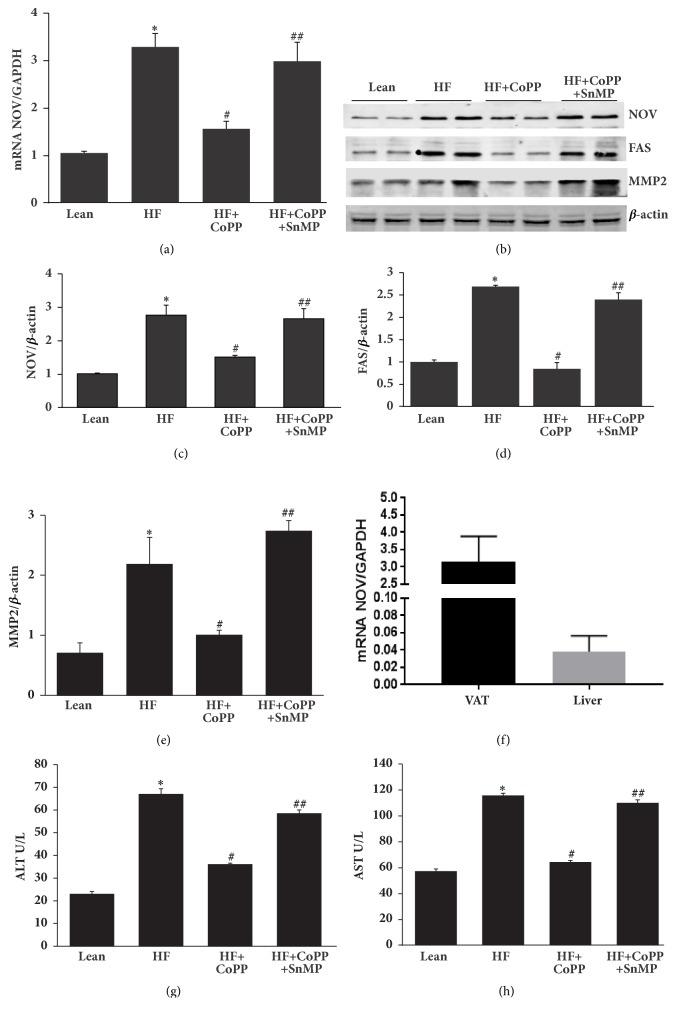
As seen in Figure 2(f), levels of NOV in the lean mouse are significantly (p<0.05) higher in visceral adipose tissue (VAT) than in liver tissue. The HF diet increased the expression of hepatic NOV/ CCN3 mRNA and protein content (Figures 2(a), 2(b), and 2(c)) as compared to lean mice (p<0.05). An increase in HO-1 expression resulted in a normalization of NOV expression, an effect that was blocked by an inhibitor of HO activity; SnMP (p<0.05) (Figures 2(a), 2(b), and 2(c)) (p<0.05). Similarly, FAS protein expression was significantly (p<0.05) elevated in HF fed mice and normalized by CoPP (Figures 2(b) and 2(d)). Fibrotic protein signaling in hepatic tissue of obese mice as measured by the expression of MMP2 was reduced by increased HO-1 levels (p<0.05), an effect that was prevented by inhibition of HO activity (Figures 2(b) and 2(e)). Obese mice developed impaired liver function as indicated by increased levels of serum AST (p < 0.05) and ALT (p < 0.05), all of which were normalized by HO-1 induction (p<0.05) (Figures 2(g) and 2(h)). HO-1 reduction in AST and ALT levels was eliminated by SnMP (Figures 2(g) and 2(h)). Taking all of these findings together, it can be concluded that a decrease in levels of the proinflammatory adipokine NOV in conjunction with increased levels of HO-1 mitigates the development of fibrotic markers that contribute to the NASH phenotype.
Figure 2.
Induction of HO-1 decreases NOV and fibrotic markers and improves ALT and AST. (a) The mRNA expression of NOV, (b) representative western blots and densitometry analysis of (c) NOV, (d) FAS, and (e) MMP2 and levels of (f) AST(U/L), and (g) ALT(U/L) in hepatic tissues of control lean mice, HF fed mice, HF fed + with CoPP, and HF fed mice + CoPP + SnMP. (h) NOV mRNA levels in visceral adipose tissue (VAT) and liver of lean mice. Results are mean ± SE, n=6, ∗p<0.05 versus lean mice, #p<0.05 versus HF fed mice, and ##p<0.05 versus HF fed mice + CoPP.
3.3. Induction of HO-1 Decreases Heme and Hepcidin Expression
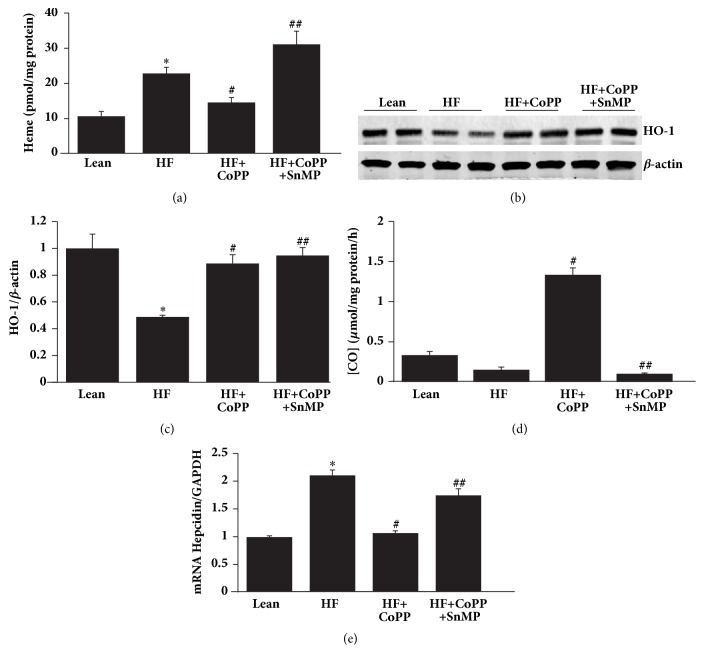
In accordance with our hypothesis, our results indicate that NASH livers have significantly (p<0.01) increased heme levels as compared to control lean mice fed a normal chow diet. Induction of HO-1 decreased heme levels as compared to the HF diet group (p<0.01). The favorable effects of induction of HO-1 were reversed by SnMP (Figure 3(a)). Western blot analysis demonstrated that hepatic tissues of mice fed a HF diet for 20 weeks had significantly (P<0.05) decreased levels of HO-1 protein as compared to hepatic tissues of mice fed a normal chow diet (Figures 3(b) and 3(c)). CoPP treatment for 8 weeks increased liver levels of HO-1 as compared to mice fed a HF diet alone, p<0.01 (Figures 3(b) and 3(c)). The positive effects of increased HO-1 levels were reversed by SnMP (Figures 3(b)–3(d)). Of note is the fact that SnMP does not prevent an increase in HO-1 protein expression but rather inhibits HO activity [37]. HO activity in hepatic tissue was increased by CoPP and decreased by SnMP in HF fed mice, p<0.05 (Figure 3(d)). As seen in Figure 3(e), hepcidin mRNA level was increased in NASH livers of HF fed mice, as compared to lean mice. Increased HO-1 expression significantly, p<0.05, reduced the expression of hepcidin, an effect which was reversed by SnMP (p<0.05).
Figure 3.
Increase of HO-1 decreases heme levels and hepcidin expression. (a) Heme (pmol/mg protein) content, (b) representative western blots of HO-1, (c) densitometry analysis of HO-1 and (d) CO production (μmol/mg protein/h), and (e) mRNA expression of hepcidin in hepatic tissues of control lean mice, HF fed mice, HF fed mice + CoPP, and HF fed mice + CoPP + SnMP. Results are mean ± SE, n=6, ∗p<0.05 versus lean mice, #p<0.05 versus HF fed mice, and ##p<0.05 versus HF fed mice treated with CoPP.
3.4. Increase of HO-1 Expression Augments Mitochondrial Integrity
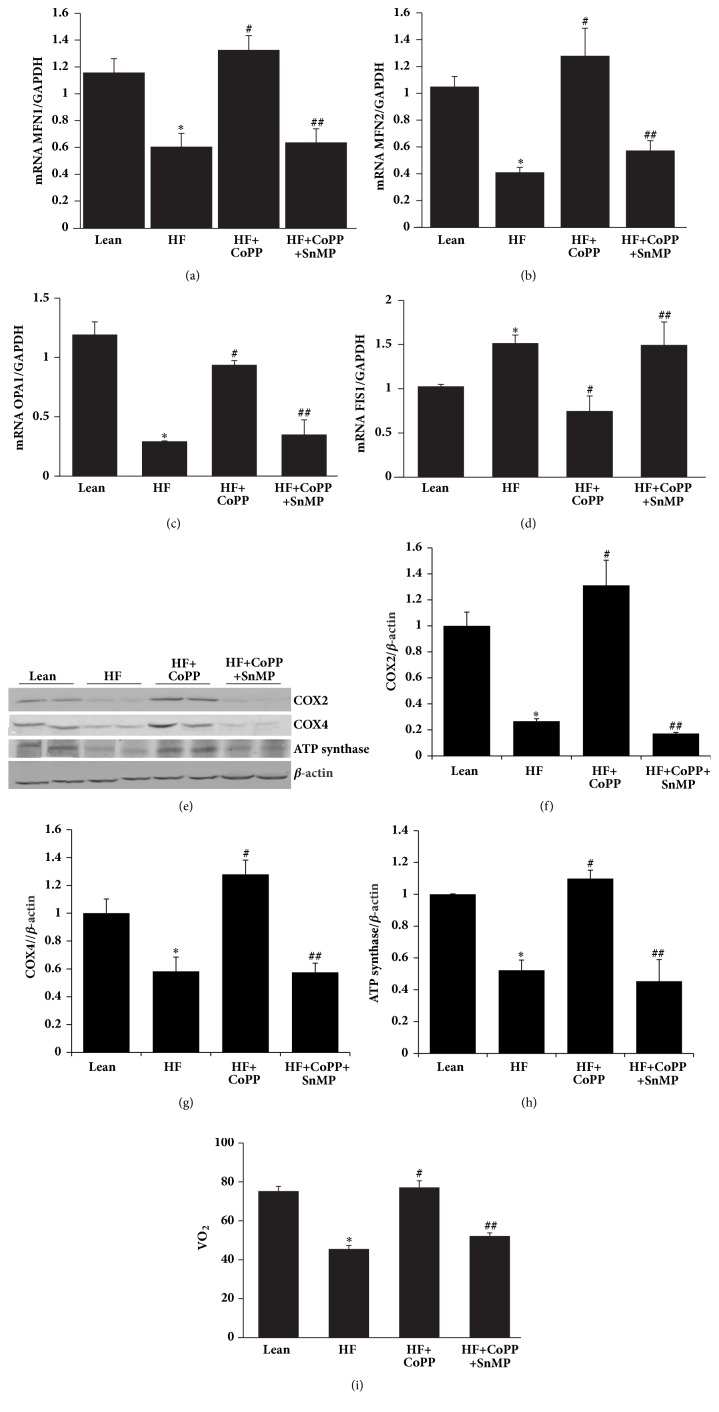
MFN1, MFN2, and OPA1 expression levels were increased, while FIS1 mRNA was decreased by HO-1 induction (p <0.05) an effect that was reversed by SnMP (p<0.05) (Figures 4(a)–4(d)). These results indicate that HO-1 is a powerful inducer of mitochondrial fusion (the merge of dysfunctional to functional) and an inhibitor of mitochondrial fission. This increase in fusion (MFN1 and MFN2) and decrease in fission (FIS1) contribute to an increase in overall mitochondrial function, leading to a decrease in adiposity in HF fed mice, a consequent reduction in obesity, and a concurrent reduction in the development of NASH. Mitochondrial expression of COX2 and COX4 as well as ATP synthase were reduced in obese mice as compared to lean mice (p<0.05), effects that were reversed by increased levels of HO-1 (p<0.05) (Figures 4(e)–4(h)). Oxygen consumption in obese mice was decreased as compared to lean mice (p<0.05) (Figure 4(i)). However, CoPP treatment of obese mice normalized O2 consumption (p<0.05), an effect blocked by SnMP (Figure 4(i)).
Figure 4.
Increase of HO-1 expression augments mitochondrial integrity. mRNA expression of (a) MFN1, (b) MFN2, (c) OPA1, and (d) FIS1. (e) Representative western blots and densitometric analysis of (f) COX2, (g) COX4, and (h) ATP synthase. (i) Total body oxygen consumption (VO2) of mice, in hepatic tissues of control lean mice, HF fed mice, HF fed mice + CoPP, and HF fed mice + CoPP + SnMP. Results are mean ± SE, n=6, ∗p<0.05 versus lean mice, #p<0.05 versus HF fed mice, and ##p<0.05 versus HF fed mice + CoPP.
3.5. HO-1 Upregulation Increases Phosphorylation of the Insulin Receptor in the Liver of Obese Mice
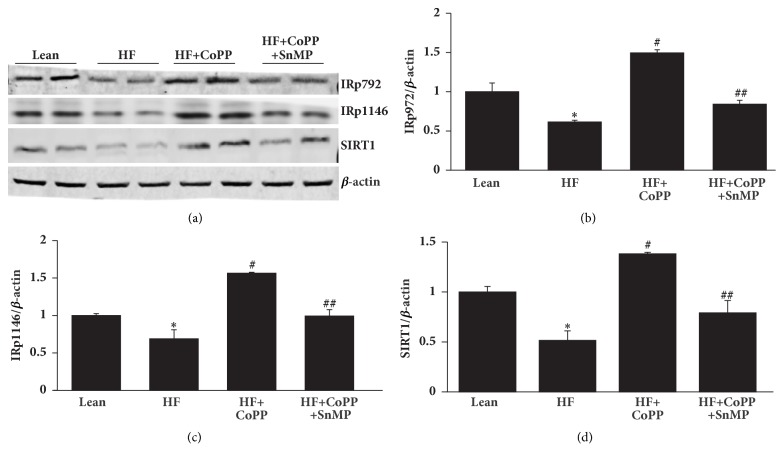
Obese mice had decreased expression levels of IRp-Tyr 972 and IRp-Tyr 1146 (p<0.05), as well as levels of SIRT1, as compared to control lean mice. HO-1 induction ameliorated the effect of HFD on insulin receptor phosphorylation and significantly increased IRp-Tyr 972 and IRp-Tyr 1146, as well as SIRT1 levels (p<0.05) (Figures 5(a)–5(d)). These effects were reversed by SnMP (Figures 5(a)–5(d)). The reversal of these beneficial effects corroborates the role of HO-1 expression and HO activity in mediating the beneficial effects of CoPP.
Figure 5.
HO-1 upregulation increases hepatic pAKT, pAMPK, and insulin receptor phosphorylation levels. Representative western blots (a) and densitometry analysis of (b) IRp972, (c) IRp1146, and (d) SIRT1 in hepatic tissues of control lean mice, HF fed mice, HF fed mice + CoPP, and HF fed mice + CoPP + SnMP. Results are mean ± SE, n=4, ∗p<0.05 versus lean mice, #p<0.05 versus HF fed mice, and ##p<0.05 versus HF fed mice + CoPP.
3.6. Adipose Tissue HO-1 Upregulation Increases Phosphorylation of Both the Insulin Receptor and Acetyl-CoA-Carboxylase (ACC)
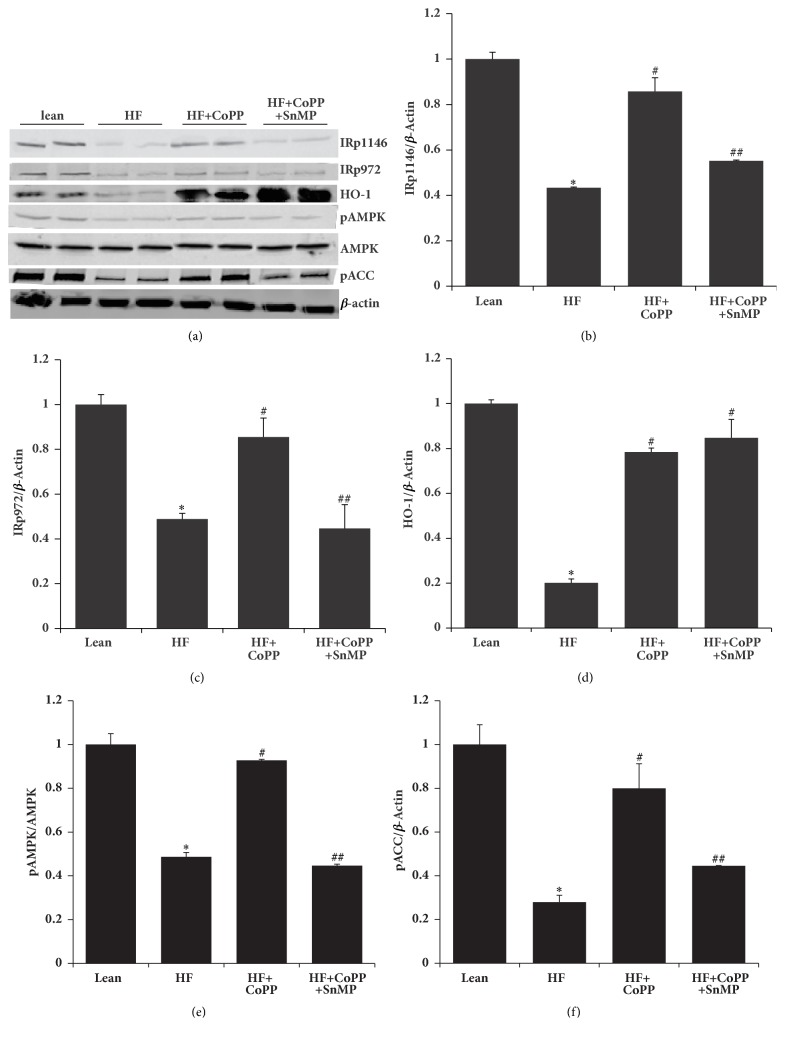
To test the possibility that NOV-mediated increases in adipose inflammation in turn decreases insulin receptor phosphorylation in an obese mouse model, we examined the effects of HO-1 on insulin receptor phosphorylation in adipose tissue. Adipose tissue of obese mice had decreased phosphorylation levels of IRp-Tyr 1146, IRp-Tyr 972, AMPK, and ACC and reduced expression of HO-1 as compared to control lean mice (p<0.05) (Figures 6(a)–6(f)). The negative effects associated with obesity were normalized in obese mice following induction of HO-1 (p<0.05) (Figures 6(a)–6(f)) and reversed by inhibition of HO activity (p<0.05) (Figures 6(a)–6(f)).
Figure 6.
Adipose tissue HO-1 upregulation increases phosphorylation of both insulin receptor and ACC. Representative western blot (a) and densitometry analysis of (b) IRp1146, (c) IRp972, (d) HO-1, (e) pAMPK, and (f) pACC. Results are mean ± SE, n=4, ∗p<0.05 versus lean mice, #p<0.05 versus HF fed mice, and ##p<0.05 versus HF fed mice + CoPP.
3.7. Adipose Tissue HO-1 Upregulation Increases Anti-Inflammatory Adiponectin and Mitochondrial Fusion-Associated Proteins, While Decreasing Proinflammatory NOV and the Mitochondrial Fission-Associated Protein, FIS1
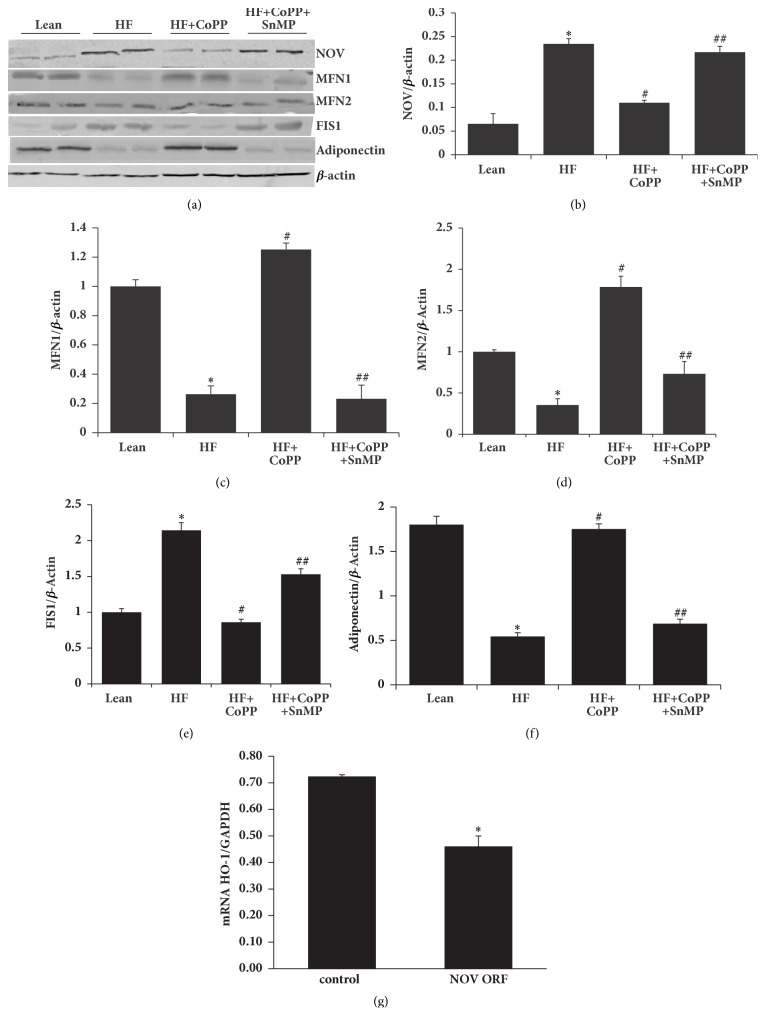
To further test the possibility of potential crosstalk between adipose and hepatic tissue we examined the effects of HO-1 on adipose mitochondrial function as it is related to the proinflammatory adipokine NOV. Inflamed adipose tissue from untreated obese mice expressed elevated levels of NOV. As seen in Figures 7(a) and 7(b), the NOV level in visceral adipose tissues of HF diet fed mice was elevated as compared to the levels in lean mice (p<0.05). HO-1 induction decreased visceral adipose tissue NOV levels (p<0.05), suggesting that induction of HO-1 reprograms white adipose tissue to beige, resulting in less inflammation (Figures 7(a) and 7(b)).
Figure 7.
Adipose tissue HO-1 upregulation increases anti-inflammatory adiponectin and mitochondrial fusion-associated proteins, while decreasing proinflammatory NOV and the mitochondrial fission-associated protein, FIS1. (a) Representative western blots, and densitometry analysis of (b) NOV, (c) MFN1, (d) MFN2, (e) FIS1, and (f) adiponectin. (g) HO-1 mRNA levels in NOV overexpressing 3T3-L1 derived adipocytes. Results are mean ± SE, n=4, ∗p<0.05 versus lean mice/control, #p<0.05 versus HF fed mice, and ##p<0.05 versus HF fed mice + CoPP.
More importantly, as mitochondrial integrity in liver tissue of HF diet fed mice was increased by HO-1 induction and as mitochondrial function is very important also for the health of adipose tissue, we assessed the levels of mitochondrial fusion and fission proteins in the visceral adipose tissue. As seen in Figure 7(a), 7(c)–7(e), the levels of MFN1 and MFN2 were decreased, while FIS1 was increased in obese mice as compared to lean mice, p <0.05. HO-1 induction normalized these levels, an effect reversed by concomitant SnMP-treatment (p<0.05) (Figure 7(a), 7(c)–7(e)). Healthy adipocytes express the anti-inflammatory adipokine, adiponectin. As seen in Figures 7(a) and 7(f), the adiponectin levels in visceral adipose tissues of HF diet fed mice were decreased as compared to the levels in lean mice (p<0.05). CoPP-mediated HO-1 induction normalized visceral adipose tissue adiponectin levels, an effect that was prevented by SnMP-treatment (p<0.05) (Figures 7(a) and 7(f)).
As induction of HO-1 in adipocytes decreased NOV levels, we wondered whether overexpression of NOV would cause a decrease of HO-1 levels. As seen in Figure 7(g), overexpression of NOV in cultured adipocytes led to a reduction in the HO-1 mRNA levels (p<0.05). Successful transduction of cells with the NOV ORF lentiviral particles was confirmed by measuring mRNA levels of NOV in transduced and control adipocytes. The NOV mRNA level was upregulated more than 100-fold (p<0.05) in the NOV overexpressing cells as compared to control cells (data not shown).
4. Discussion
The primary findings of this study are the following. (1) The increase of the proinflammatory adipokine NOV and decrease of HO-1 in hepatic and adipose tissue of obese mice is associated with mitochondrial dysfunction and the development and progression of obesity-induced NASH. (2) Fat expansion is associated with remodeling marked by an increase in proinflammatory molecules and oxidative stress and a decrease in PGC-1α and insulin receptor phosphorylation with the eventual development of metabolic abnormalities. (3) TNF-α and NOV are increased while adiponectin is decreased in obese mice. (4) Reduction of levels of heme through the pharmacological induction of HO-1 reduces the severity of steatosis, inflammation, and fibrosis through the improvement of hepatic mitochondrial function. We and others have shown that heme levels are elevated in lipid laden, unhealthy, terminal differentiated adipocyte, and increase of HO-1; i.e., increase of heme degradation decreases adiposity [38, 39]. Diminishing HO-1 levels are seen in maturing inflamed adipocyte in hepatic tissues [35, 39, 40].
Increased levels of HO-1 shown to play a critical role in the amelioration of oxidative stress, and, in both humans and mice, low levels of HO-1 lead to organ damage [16, 41]. Moreover, overexpression of HO-1 lowers levels of the inflammatory mediators TNF-α and IL-6 in the liver of mice [42]. A decrease in HO activity exacerbates mitochondrial lipid peroxidation and mitochondrial dysfunction, while induction of HO-1 upregulates mitochondrial transcription factor [21], all of which support the hypothesis that a reduction in HO activity results in mitochondrial dysfunction and increased insulin resistance [22, 24]. Mitochondrial dysfunction leads to a decrease in beta oxidation in the liver which allows fat to accumulate resulting in a “fatty liver” [43, 44].
The potential beneficial role of decreasing NOV in obesity and metabolic syndrome has been recently described [22]. Increased levels of NOV appear to be a key component of the inflammatory and fibrotic response in the liver of obese mice, and adiposity mediated increase of NOV appears to be involved in hepatic IR and in the pathophysiology of the inflammation and resulting fibrosis. In NOV−/− obese mice, there is a reduction in body weight, a decrease in expression of proinflammatory cytokines and chemokines, and increase in the levels of PGC-1α and UCP1. In our obese mouse model, increased levels of HO-1 led to a concomitant reduction in NOV mRNA, as inflammation and markers of fibrosis to the levels of lean animals. This effect was reversed by inhibiting HO activity, not HO-1 protein, by SnMP, a well-known effect for SnMP [37] indicating the pivotal role of HO-1 and HO activity in the regulation of obesity and metabolic syndrome. We speculate that a crosstalk exists between adipose dysfunction and the development of fibrosis and NASH.
Mitochondrial dysfunction is also a key player in the generation of ROS [45], which results in abnormal respiration [43]. Oxidative stress in NAFLD/NASH is associated with the reduced expression of PGC-1α in adipose tissue, negatively affecting mitochondrial biogenesis, thereby resulting in the mitochondrial dysfunction that is seen in the development of IR [45]. PGC-1α targets SIRT3, a mitochondrial deacetylase, which promotes mitochondrial biogenesis, suppression of ROS [46], and mitochondrial FA oxidation [47]. PGC-1α adipocyte knockout mice develop IR and glucose intolerance and consequently elevated levels of circulating lipids and cholesterol [48]. This demonstrates the existence of PGC-1α crosstalk between adipocytes and the liver, thereby correlating adipocyte mediated release of inflammatory cytokines with hepatic insulin resistance and steatosis. With HO-1 induction, levels of PGC-1α and markers of mitochondrial fusion increase in adipose tissue, oxidative stress decreases, and lipogenesis and liver function in obese mice improve.
A HFD increases the expression of the FIS1 gene, which regulates mitochondrial fission, while concomitantly reducing the expression of those genes responsible for mitochondrial quality control and fusion processes, fueling ROS generation, and causing tissue inflammation [49]. An inverse relationship exists between Mfn2 mRNA levels in skeletal muscles and BMI. Consistent with these observations, skeletal muscle from obese subjects presents an altered, fragmented mitochondrial network, associated with nutrient oxidation, respiratory chain defects, and IR [50]. Additionally, liver MFN2 levels are decreased in obesity, but increased by increasing HO-1 levels, thereby reducing the severity of NASH. In particular, increased levels of HO-1 decrease steatosis and abolish fibrosis, and the NAS score is reduced. In agreement with our data, NASH and fatty liver are both associated with IR, but NASH alone is associated with mitochondrial structural defects [51]. Finally, since hepcidin is released from adipose tissue and is upregulated by NOV, it follows that there would be increased hepcidin in individuals with higher BMI and metabolic abnormalities who would be more likely to develop NASH [1]. Thus, considering only a small percentage of patients with NAFLD progress to NASH, an increase in hepcidin might explain the conversion and associated mitochondrial dysfunction and inflammation. Additionally, differences may exist in patients with fatty liver based on different genetic backgrounds of these individuals (increased heme-NOV and a decrease in HO-1 expression).
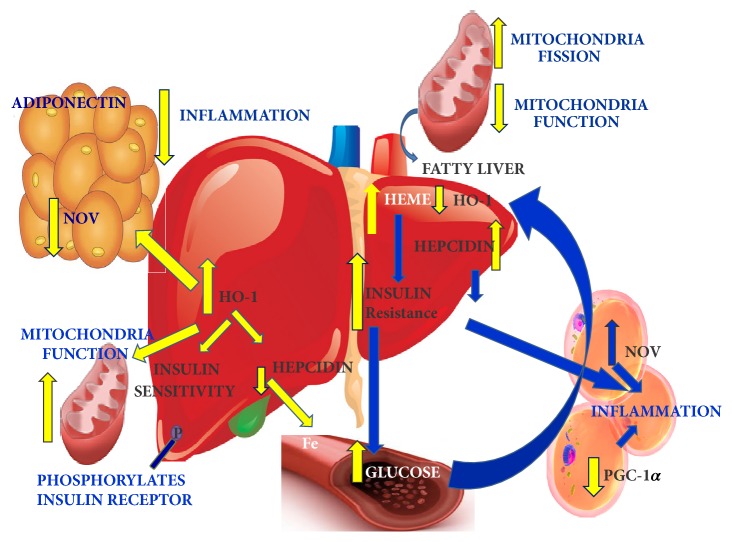
In conclusion, these data identify that a decrease in adipose and hepatic HO-1 is associated with an increase in adipose-derived NOV activation and that these perturbations can be regarded as key mediators in the development and progression of obesity-induced fibrosis and NASH. Decreased heme levels result in improved mitochondrial function and decreased FAS with an overall reduction in NOV-inflammation, fibrosis, and NASH scores (summarized in Figure 8). As the pursuit of a reliable surrogate marker of inflammation and fibrosis continues, liver histopathology is reflected by the NAFLD Activity Score, which remains the gold standard end-point of therapeutic efficacy. However, future pharmacologic targeting of the NOV/HO-1 axis may prove fruitful in reducing the severity of a disease process that is increasing significantly in prevalence.
Figure 8.
Schematic description of the HO-1 mediated induction of adipose tissue of HF fed mice. As seen in right side panel, decreased HO-1 resulted in an increase of hepatic heme, hepcidin, which is associated with the development and progression of obesity-induced NASH, fibrosis via mitochondrial dysfunction (fission and decreases in COX 2 and 4). Fat expansion was associated with remodeling marked by an increase in adipocyte hyperplasia and hypertrophy leading to proinflammatory molecule NOV, which is associated with a decrease of PGC-1α and insulin receptor phosphorylation and eventually development of fibrosis and NAS. In the left panel, induction of HO-1 reduced the severity of steatosis, inflammation, and fibrosis through decrease in NOV and an increase of adiponectin that resulted in the improvement of hepatic mitochondrial integrity, pAMPK-pAKT, and insulin receptor phosphorylation that all in concert leads to an improvement in hepatic function and steatosis.
Acknowledgments
All authors had full access to the data and take responsibility for its integrity. All authors have read and agree with the manuscript as written. The content is solely the responsibility of the authors and does not necessarily represent the official views of the National Institutes of Health.
Data Availability
In order to maximize utility of the study results, all data is available to other researchers on request.
Conflicts of Interest
The authors declare that they have no conflicts of interest.
Authors' Contributions
David Sacerdoti and Shailendra P. Singh contributed equally to this work.
References
- 1.Nelson J. E., Wilson L., Brunt E. M., et al. Relationship between the pattern of hepatic iron deposition and histological severity in nonalcoholic fatty liver disease. Hepatology. 2011;53(2):448–457. doi: 10.1002/hep.24038. [DOI] [PMC free article] [PubMed] [Google Scholar]
- 2.Nelson J. E., Bhattacharya R., Lindor K. D., et al. HFE C282Y mutations are associated with advanced hepatic fibrosis in caucasians with nonalcoholic steatohepatitis. Hepatology. 2007;46:723–729. doi: 10.1002/hep.21742. [DOI] [PubMed] [Google Scholar]
- 3.Kowdley K. V., Belt P., Wilson L. A., et al. Serum ferritin is an independent predictor of histologic severity and advanced fibrosis in patients with nonalcoholic fatty liver disease. Hepatology. 2012;55(1):77–85. doi: 10.1002/hep.24706. [DOI] [PMC free article] [PubMed] [Google Scholar]
- 4.Vatner D. F., Majumdar S. K., Kumashiro N., et al. Insulin-independent regulation of hepatic triglyceride synthesis by fatty acids. Proceedings of the National Acadamy of Sciences of the United States of America. 2015;112(4):1143–1148. doi: 10.1073/pnas.1423952112. [DOI] [PMC free article] [PubMed] [Google Scholar]
- 5.Li Y., Ding L., Hassan W., Abdelkader D., Shang J. Adipokines and hepatic insulin resistance. Journal of Diabetes Research. 2013;2013:8. doi: 10.1155/2013/170532.170532 [DOI] [PMC free article] [PubMed] [Google Scholar]
- 6.Jayashree G. V., Krupashree K., Rachitha P., Khanum F. Patulin Induced Oxidative Stress Mediated Apoptotic Damage in Mice, and its Modulation by Green Tea Leaves. Journal of Clinical and Experimental Hepatology. 2017;7(2):127–134. doi: 10.1016/j.jceh.2017.01.113. [DOI] [PMC free article] [PubMed] [Google Scholar]
- 7.Krithika R., Verma R. J., Shrivastav P. S., Suguna L. Phyllanthin of Standardized Phyllanthus amarus Extract Attenuates Liver Oxidative Stress in Mice and Exerts Cytoprotective Activity on Human Hepatoma Cell Line. Journal of Clinical and Experimental Hepatology. 2011;1(2):57–67. doi: 10.1016/S0973-6883(11)60123-0. [DOI] [PMC free article] [PubMed] [Google Scholar]
- 8.Lee P.-C., Yang L.-Y., Wang Y.-W., et al. Mechanisms of the prevention and inhibition of the progression and development of non-alcoholic steatohepatitis by genetic and pharmacological decoy receptor 3 supplementation. Hepatology Research. 2017;47(12):1260–1271. doi: 10.1111/hepr.12863. [DOI] [PubMed] [Google Scholar]
- 9.Okura Y., Namisaki T., Moriya K., et al. Combined treatment with dipeptidyl peptidase-4 inhibitor (sitagliptin) and angiotensin-II type 1 receptor blocker (losartan) suppresses progression in a non-diabetic rat model of steatohepatitis. Hepatology Research. 2017;47(12):1317–1328. doi: 10.1111/hepr.12860. [DOI] [PubMed] [Google Scholar]
- 10.Goda N., Suzuki K., Naito M., Takeoka S., Tsuchida E., Ishimura Y., et al. Distribution of heme oxygenase isoforms in rat liver. Topographic basis for carbon monoxide-mediated microvascular relaxation. Journal of Clinical Investigation. 1998;101:604–612. doi: 10.1172/JCI1324. [DOI] [PMC free article] [PubMed] [Google Scholar]
- 11.Abraham N. G., Junge J. M., Drummond G. S. Translational significance of heme oxygenase in obesity and metabolic syndrome. Trends in Pharmacological Sciences. 2016;37(1):17–36. doi: 10.1016/j.tips.2015.09.003. [DOI] [PMC free article] [PubMed] [Google Scholar]
- 12.Kim D. H., Burgess A. P., Li M. Heme oxygenase-mediated increases in adiponectin decrease fat content and inflammatory cytokines tumor necrosis factor-α and interleukin-6 in Zucker rats and reduce adipogenesis in human mesenchymal stem cells. The Journal of Pharmacology and Experimental Therapeutics. 2008;325(3):833–840. doi: 10.1124/jpet.107.135285. [DOI] [PubMed] [Google Scholar]
- 13.Nicolai A., Li M., Kim D. H., et al. Heme oxygenase-1 induction remodels adipose tissue and improves insulin sensitivity in obesity-induced diabetic rats. Hypertension. 2009;53(3):508–515. doi: 10.1161/HYPERTENSIONAHA.108.124701. [DOI] [PMC free article] [PubMed] [Google Scholar]
- 14.Cao J., Peterson S. J., Sodhi K., et al. Heme oxygenase gene targeting to adipocytes attenuates adiposity and vascular dysfunction in mice fed a high-fat diet. Hypertension. 2012;60(2):467–475. doi: 10.1161/HYPERTENSIONAHA.112.193805. [DOI] [PMC free article] [PubMed] [Google Scholar]
- 15.Puri N., Arefiev Y., Chao R., et al. Heme Oxygenase Induction Suppresses Hepatic Hepcidin and Rescues Ferroportin and Ferritin Expression in Obese Mice. Journal of Nutrition and Metabolism. 2017;2017:1–11. doi: 10.1155/2017/4964571. [DOI] [PMC free article] [PubMed] [Google Scholar]
- 16.Kawashima A., Oda Y., Yachie A., Koizumi S., Nakanishi I. Heme oxygenase-1 deficiency: the first autopsy case. Human Pathology. 2002;33(1):125–130. doi: 10.1053/hupa.2002.30217. [DOI] [PubMed] [Google Scholar]
- 17.Yachie A., Niida Y., Wada T., et al. Oxidative stress causes enhanced endothelial cell injury in human heme oxygenase-1 deficiency. The Journal of Clinical Investigation. 1999;103(1):129–135. doi: 10.1172/jci4165. [DOI] [PMC free article] [PubMed] [Google Scholar]
- 18.Csongradi E., Docarmo J. M., Dubinion J. H., Vera T., Stec D. E. Chronic HO-1 induction with cobalt protoporphyrin (CoPP) treatment increases oxygen consumption, activity, heat production and lowers body weight in obese melanocortin-4 receptor-deficient mice. International Journal of Obesity. 2012;36(2):244–253. doi: 10.1038/ijo.2011.78. [DOI] [PMC free article] [PubMed] [Google Scholar]
- 19.Li J., Wu B., Teng D., et al. Cobalt-protoporphyrin enhances heme oxygenase 1 expression and attenuates liver ischemia/reperfusion injury by inhibiting apoptosis. Molecular Medicine Reports. 2018 doi: 10.3892/mmr.2018.8384. [DOI] [PubMed] [Google Scholar]
- 20.Zhan X., Zhang Z., Huang H., Zhang Y., Zeng Z. Effect of heme oxygenase-1 on the protection of ischemia reperfusion injury of bile duct in rats after liver transplantation. Clinics and Research in Hepatology and Gastroenterology. 2017 doi: 10.1016/j.clinre.2017.09.008. [DOI] [PubMed] [Google Scholar]
- 21.Park J., Choi H., Yim S., Lee S. Heme Oxygenase-1 Protects the Liver from Septic Injury by Modulating TLR4-Mediated Mitochondrial Quality Control in Mice. Shock. 2018:p. 1. doi: 10.1097/SHK.0000000000001020. [DOI] [PubMed] [Google Scholar]
- 22.Cao J., Singh S. P., McClung J. A., et al. EET intervention on Wnt1, NOV, and HO-1 signaling prevents obesity-induced cardiomyopathy in obese mice. American Journal of Physiology-Heart and Circulatory Physiology. 2017;313(2):H368–H380. doi: 10.1152/ajpheart.00093.2017. [DOI] [PMC free article] [PubMed] [Google Scholar]
- 23.Huang P. I., Chen Y. C., Chen L. H., Juan C. C., HH K. u., Wang S. T., et al. PGC-1alpha mediates differentiation of mesenchymal stem cells to brown adipose cells. Journal of Atherosclerosis and Thrombosis. 2011;18:966–980. doi: 10.5551/jat.7401. [DOI] [PubMed] [Google Scholar]
- 24.Singh S. P., Schragenheim J., Cao J., Falck J. R., Abraham N. G., Bellner L. PGC-1 alpha regulates HO-1 expression, mitochondrial dynamics and biogenesis: Role of epoxyeicosatrienoic acid. Prostaglandins & Other Lipid Mediators. 2016;125:8–18. doi: 10.1016/j.prostaglandins.2016.07.004. [DOI] [PMC free article] [PubMed] [Google Scholar]
- 25.Kruger A. L., Peterson S. J., Schwartzman M. L., et al. Up-regulation of heme oxygenase provides vascular protection in an animal model of diabetes through its antioxidant and antiapoptotic effects. The Journal of Pharmacology and Experimental Therapeutics. 2006;319(3):1144–1152. doi: 10.1124/jpet.106.107482. [DOI] [PubMed] [Google Scholar]
- 26.Peterson S. J., Husney D., Kruger A. L., et al. Long-term treatment with the apolipoprotein A1 mimetic peptide increases antioxidants and vascular repair in type I diabetic rats. The Journal of Pharmacology and Experimental Therapeutics. 2007;322(2):514–520. doi: 10.1124/jpet.107.119479. [DOI] [PubMed] [Google Scholar]
- 27.Fujihara C. K., Sena C. R., Malheiros D. M. A. C., Mattar A. L., Zatz R. Short-term nitric oxide inhibition induces progressive nephropathy after regression of initial renal injury. American Journal of Physiology-Renal Physiology. 2006;290(3):F632–F640. doi: 10.1152/ajprenal.00259.2005. [DOI] [PubMed] [Google Scholar]
- 28.Kumar N., Solt L. A., Wang Y., et al. Regulation of adipogenesis by natural and synthetic REV-ERB ligands. Endocrinology. 2010;151(7):3015–3025. doi: 10.1210/en.2009-0800. [DOI] [PMC free article] [PubMed] [Google Scholar]
- 29.Martinerie C., Garcia M., Do T. T. H., et al. NOV/CCN3: A new adipocytokine involved in obesity-associated insulin resistance. Diabetes. 2016;65(9):2502–2515. doi: 10.2337/db15-0617. [DOI] [PubMed] [Google Scholar]
- 30.Riser B. L., Najmabadi F., Perbal B., et al. CCN3 (NOV) is a negative regulator of CCN2 (CTGF) and a novel endogenous inhibitor of the fibrotic pathway in an in vitro model of renal disease. The American Journal of Pathology. 2009;174(5):1725–1734. doi: 10.2353/ajpath.2009.080241. [DOI] [PMC free article] [PubMed] [Google Scholar]
- 31.Le Dréau G., Kular L., Nicot A. B., et al. NOV/CCN3 upregulates CCL2 and CXCL1 expression in astrocytes through beta1 and beta5 integrins. Glia. 2010;58:1510–1521. doi: 10.1002/glia.21025. [DOI] [PubMed] [Google Scholar]
- 32.Wu W., Hu X., Zhou X., Klenotic P. A., Zhou Q., Lin Z. Myeloid deficiency of CCN3 exacerbates liver injury in a mouse model of nonalcoholic fatty liver disease. Journal of Cell Communication and Signaling. 2017:1–11. doi: 10.1007/s12079-017-0432-4. [DOI] [PMC free article] [PubMed] [Google Scholar]
- 33.Singh S. P., Grant I., Meissner A., Kappas A., Abraham N. G. Ablation of adipose-HO-1 expression increases white fat over beige fat through inhibition of mitochondrial fusion and of PGC1α in female mice. Hormone Molecular Biology and Clinical Investigation. 2017;31(1) doi: 10.1515/hmbci-2017-0027. [DOI] [PubMed] [Google Scholar]
- 34.Bedossa P., Poitou C., Veyrie N., et al. Histopathological algorithm and scoring system for evaluation of liver lesions in morbidly obese patients. Hepatology. 2012;56(5):1751–1759. doi: 10.1002/hep.25889. [DOI] [PubMed] [Google Scholar]
- 35.Waldman M., Bellner L., Vanella L., et al. Epoxyeicosatrienoic Acids Regulate Adipocyte Differentiation of Mouse 3T3 Cells, Via PGC-1alpha Activation, Which Is Required for HO-1 Expression and Increased Mitochondrial Function. Stem Cells and Development. 2016;25:1084–1094. doi: 10.1089/scd.2016.0072. [DOI] [PMC free article] [PubMed] [Google Scholar]
- 36.Puri N., Zhang F., Monu S. R., et al. Antioxidants condition pleiotropic vascular responses to exogenous H 2O2: Role of modulation of vascular TP receptors and the heme oxygenase system. Antioxidants & Redox Signaling. 2013;18:471–480. doi: 10.1089/ars.2012.4587. [DOI] [PMC free article] [PubMed] [Google Scholar]
- 37.Sardana M. K., Kappas A. Dual control mechanism for heme oxygenase: Tin(IV)-protoporphyrin potently inhibits enzyme activity while markedly increasing content of enzyme protein in liver. Proceedings of the National Academy of Sciences of the United States of America. 1987;84:2464–2468. doi: 10.1073/pnas.84.8.2464. [DOI] [PMC free article] [PubMed] [Google Scholar]
- 38.Hosick P. A., Stec D. E. Heme oxygenase, a novel target for the treatment of hypertension and obesity? American Journal of Physiology-Regulatory, Integrative and Comparative Physiology. 2012;302:R207–R214. doi: 10.1152/ajpregu.00517.2011. [DOI] [PMC free article] [PubMed] [Google Scholar]
- 39.Salley T. N., Mishra M., Tiwari S., Jadhav A., Ndisang J. F. The heme oxygenase system rescues hepatic deterioration in the condition of obesity co-morbid with type-2 diabetes. PLoS ONE. 2013;8(11) doi: 10.1371/journal.pone.0079270.e79270 [DOI] [PMC free article] [PubMed] [Google Scholar]
- 40.Hinds T. D., Jr., Sodhi K., Meadows C., et al. Increased HO-1 levels ameliorate fatty liver development through a reduction of heme and recruitment of FGF21. Obesity. 2014;22(3):705–712. doi: 10.1002/oby.20559. [DOI] [PMC free article] [PubMed] [Google Scholar] [Retracted]
- 41.Radhakrishnan N., Yadav S. P., Sachdeva A., et al. Human heme oxygenase-1 deficiency presenting with hemolysis, nephritis, and asplenia. Journal of Pediatric Hematology/Oncology. 2011;33(1):74–78. doi: 10.1097/MPH.0b013e3181fd2aae. [DOI] [PubMed] [Google Scholar]
- 42.Qu S., Yuan B., Zhang H., et al. Heme Oxygenase 1 Attenuates Hypoxia-Reoxygenation Injury in Mice Liver Sinusoidal Endothelial Cells. Transplantation. 2018:p. 1. doi: 10.1097/TP.0000000000002028. [DOI] [PubMed] [Google Scholar]
- 43.Spahis S., Delvin E., Borys J. M., Levy E. Oxidative Stress as a Critical Factor in Nonalcoholic Fatty Liver Disease Pathogenesis. Antioxid Redox Signal. 2017;26:519–541. doi: 10.1089/ars.2016.6776. [DOI] [PubMed] [Google Scholar]
- 44.Cusi K. Role of obesity and lipotoxicity in the development of nonalcoholic steatohepatitis: pathophysiology and clinical implications. Gastroenterology. 2012;142(4):711.e6–725.e6. doi: 10.1053/j.gastro.2012.02.003. [DOI] [PubMed] [Google Scholar]
- 45.Gutterman D. D. Mitochondria and reactive oxygen species: an evolution in function. Circulation Research. 2005;97(4):302–304. doi: 10.1161/01.res.0000179773.18195.12. [DOI] [PubMed] [Google Scholar]
- 46.Aharoni-Simon M., Hann-Obercyger M., Pen S., Madar Z., Tirosh O. Fatty liver is associated with impaired activity of PPARγ-coactivator 1α (PGC1α) and mitochondrial biogenesis in mice. Laboratory Investigation. 2011;91(7):1018–1028. doi: 10.1038/labinvest.2011.55. [DOI] [PubMed] [Google Scholar]
- 47.Hirschey M. D., Shimazu T., Goetzman E., et al. SIRT3 regulates mitochondrial fatty-acid oxidation by reversible enzyme deacetylation. Nature. 2010;464(7285):121–125. doi: 10.1038/nature08778. [DOI] [PMC free article] [PubMed] [Google Scholar]
- 48.Spiegelman B., Puigserver P., Wu Z. Regulation of adipogenesis and energy balance by PPARγ and PGC-1. International Journal of Obesity. 2000;24(S4):S8–S10. doi: 10.1038/sj.ijo.0801492. [DOI] [PubMed] [Google Scholar]
- 49.Satapati S., Kucejova B., Duarte J. A., et al. Mitochondrial metabolism mediates oxidative stress and inflammation in fatty liver. The Journal of Clinical Investigation. 2015;125(12):4447–4462. doi: 10.1172/JCI82204. [DOI] [PMC free article] [PubMed] [Google Scholar]
- 50.Bach D., Naon D., Pich S., et al. Expression of Mfn2, the Charcot-Marie-Tooth neuropathy type 2A gene, in human skeletal muscle: effects of type 2 diabetes, obesity, weight loss, and the regulatory role of tumor necrosis factor α and interleukin-6. Diabetes. 2005;54(9):2685–2693. doi: 10.2337/diabetes.54.9.2685. [DOI] [PubMed] [Google Scholar]
- 51.Sanyal A. J., Campbell-Sargent C., Mirshahi F., et al. Nonalcoholic steatohepatitis: association of insulin resistance and mitochondrial abnormalities. Gastroenterology. 2001;120(5):1183–1192. doi: 10.1053/gast.2001.23256. [DOI] [PubMed] [Google Scholar]
Associated Data
This section collects any data citations, data availability statements, or supplementary materials included in this article.
Data Availability Statement
In order to maximize utility of the study results, all data is available to other researchers on request.


