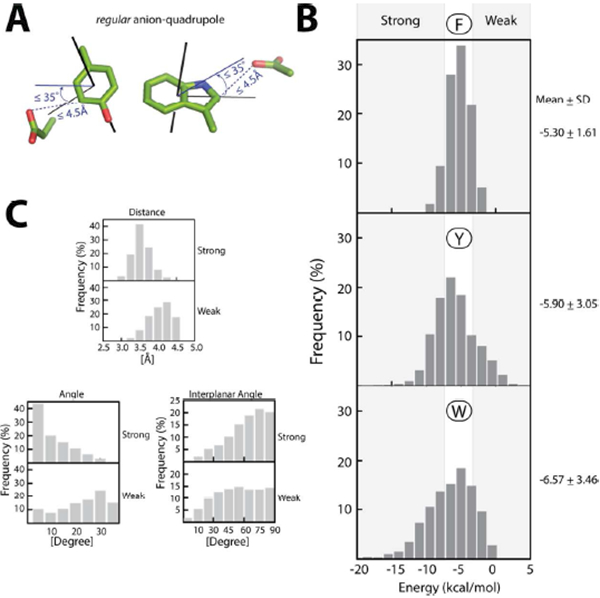
Figure 1. Regular anion–quadrupole interactions and their energies:

(A) The distance (≤ 4.5 Å) and angle (≤ 35°) detection criteria. (B) The distribution of the interaction energies for Phe (top), Tyr (middle), and Trp (bottom). Energy ranges for the strong and weak anion–quadrupole interactions are indicated by the gray background. (C) A comparison of the distribution of properties between strong and weak interactions: distances (top), angles (left, bottom), and interplanar angles (right, bottom).
