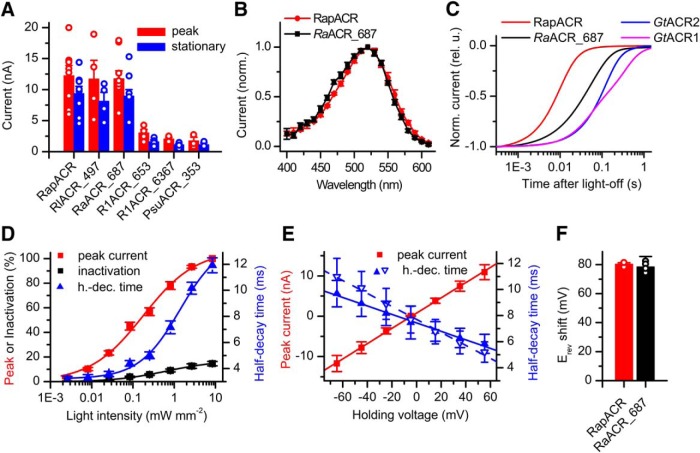
Figure 1.
Screening of ACR homologs. A, The amplitude of photocurrents generated by tested ACR homologs expressed in HEK293 cells in response to the first pulse of continuous light at the wavelength of the maximal sensitivity for each homolog (Table 3) at -60 mV at the amplifier output in standard solutions. The stationary current was measured at the end of a 1-s light pulse. The data are the mean values ± SEM (n = 3–10 cells). The data obtained in each individual cell are shown as empty circles. B, The action spectra of photocurrents generated by RapACR (RsACR_665) and RaACR_687. The data are the mean values ± SEM (n = 4 and n = 8 scans, respectively). C, The kinetics of the photocurrent decay after switching off the continuous light (1-s duration) at -60 mV. D, The dependence of the normalized peak amplitude, inactivation, and half-decay time of RapACR photocurrents recorded in response to 1-s pulses of 520-nm light on the stimulus intensity. The data points are mean ± SEM (n = 5 cells). E, The dependence of the peak amplitude (red) and half-decay time (blue) of RapACR photocurrents on the holding voltage corrected for the liquid junction potential. Filled symbols, solid lines, measurements using standard HEK293 solutions (Table 1); empty downward triangles, dashed line, measurements using neuronal solutions (Table 2). The data points are mean ± SEM (n = 6 cells). F, The shifts of the reversal potential on partial replacement of Cl– with Asp- in the bath. The data are the mean values ± SEM (n = 3 and n = 5 cells for RapACR and RaACR_687, respectively).

