

Abstract
Defining the metabolic limitations of tumour growth will help develop cancer therapies1. Cancer cells proliferate slower in tumours than in standard culture conditions, indicating that a metabolic limitation may restrict cell proliferation in vivo. Aspartate synthesis can limit cancer cell proliferation when respiration is impaired2–4; however, whether acquiring aspartate is endogenously limiting for tumour growth is unknown. We confirm aspartate has poor cell permeability, preventing environmental acquisition, whereas the related amino acid asparagine is available to cells in tumours, but cancer cells lack asparaginase activity to convert asparagine to aspartate. Heterologous expression of guinea pig asparaginase 1 (gpASNase1), an enzyme that produces aspartate from asparagine5, confers the ability to use asparagine to supply intracellular aspartate to cancer cells in vivo. Tumours expressing gpASNase1 grow at a faster rate, indicating aspartate acquisition is an endogenous metabolic limitation for growth of some tumours. Tumours expressing gpASNase1 are also refractory to the growth suppressive effects of metformin, suggesting that metformin inhibits tumour growth by depleting aspartate. These findings suggest that therapeutic aspartate suppression could be effective to treat cancer.
How cancer-associated metabolic pathways support cell proliferation has been extensively studied in culture, however environmental differences between tumours and cell culture can result in the use of alternative pathways in vivo6–9. Thus, understanding the metabolic limitations of tumour cells in vivo is critical to translate the growing understanding of cancer metabolism and help develop cancer therapies. Production of the amino acid aspartate can be a metabolic limitation for cancer cell proliferation in some contexts. Inhibition of the mitochondrial electron transport chain (ETC) impairs the regeneration of electron acceptors and suppresses both aspartate synthesis and cell proliferation2–4,10. Cancer cells in tumours are exposed to lower oxygen levels than cells in culture11, and ETC inhibitors can impair tumour growth in some contexts3,12,13. These findings raise the possibility that aspartate synthesis may constrain cancer cell proliferation in vivo.
Transport of aspartate into most mammalian cells is inefficient, with millimolar concentrations of aspartate needed to restore proliferation of cells when electron transport is impaired2–4. Because aspartate levels are low in circulation14, we investigated other approaches to raise aspartate levels in cells in a physiological tissue context. While most mammalian cells lack a known asparaginase activity, the enzymatic activity that converts asparagine to aspartate, such an activity is found in some organisms15. We reasoned that because asparagine is more abundant in the circulation, providing cancer cells with an asparaginase activity may be a method to provide aspartate to the cells in tumours.
Human cells have two genes that encode products with homology to asparaginase enzymes from other organisms, but these gene products have not shown robust asparaginase activity5,16, and alternative enzymatic functions have been proposed16,17. However, it has been hypothesized that asparaginase activity might be activated in some contexts18. Thus, we first examined whether asparagine could functionally contribute to the aspartate pool in cells. Providing U-13C labeled asparagine to cells contributed to the intracellular asparagine pool when supplied in the micromolar range, however U-13C labeled aspartate only labeled the intracellular aspartate pool when provided at millimolar concentrations (Fig. 1a). Overexpression of the glial transporter SLC1A3, which can transport aspartate4,19, allows labeling of intracellular aspartate from micromolar levels of labeled extracellular aspartate, confirming that aspartate is relatively impermeable to cells without this transporter (Supplementary Fig. 1a). To confirm that these labeling differences reflect intracellular amino acid pools, we examined the incorporation of labeled aspartate or asparagine into protein over 24 hours and found that label from asparagine incorporated into protein at lower extracellular concentrations than label from aspartate (Fig. 1b). Exogenous asparagine also increased intracellular asparagine levels when provided at micromolar levels, whereas addition of 10 millimolar aspartate was needed to even slightly increase aspartate levels in cells (Fig. 1c, d). Expression of SLC1A3 enabled exogenous aspartate to raise intracellular pools at lower aspartate concentrations, consistent with aspartate being relatively impermeable to non-SLC1A3-expressing cells (Supplementary Fig. 1b). In fact, extracellular aspartate only marginally contributes to intracellular aspartate, whereas asparagine contributes considerably to intracellular asparagine, across several cancer cell lines cultured in the presence of 1 mM U-13C-labeled aspartate or asparagine (Supplementary Fig. 1c-f). Taken together, these data are consistent with previous studies20–22 suggesting many cancer cells can take up asparagine, but not aspartate.
Figure 1. Extracellular asparagine, but not aspartate, is accessible to cells.
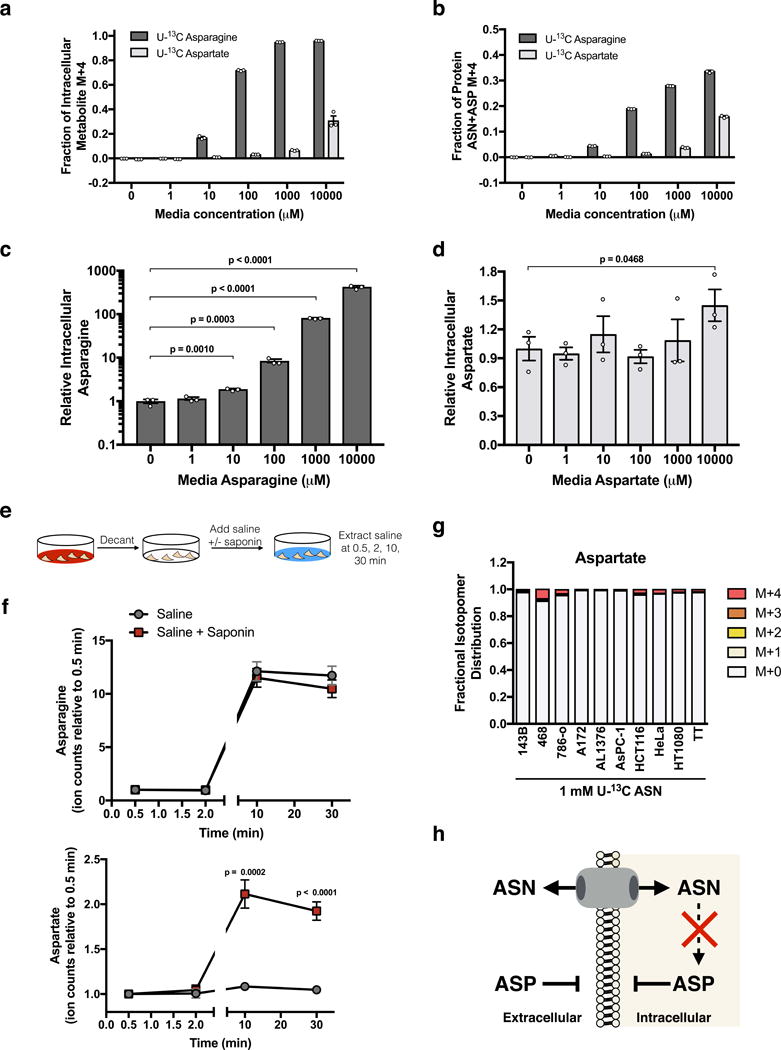
(a) Fractional labeling of intracellular asparagine and aspartate in 143B cells after 1 hour of exposure to the indicated concentrations of U-13C labeled asparagine or U-13C labeled aspartate. (b) Fractional labeling of total asparagine plus aspartate in protein hydrolysates derived from 143B cells cultured for 24 hours with the indicated concentrations of U-13C labeled asparagine or U-13C labeled aspartate as indicated. Acid hydrolysis of protein cleaves amides to carboxylic acids and converts all asparagine to aspartate. Thus, the labeled aspartate measured represents the sum of labeled aspartate and asparagine in protein in these cells. (c) Intracellular asparagine levels from 143B cells cultured in the indicated concentrations of asparagine for 1 hour. (d) Intracellular aspartate levels from 143B cells cultured in the indicated concentrations of aspartate for 1 hour. (e) Schematic detailing the saponin-specific metabolite release assay used in f and Supplementary Fig. 1g. (f) Saponin-specific metabolite release of asparagine (top) and aspartate (bottom). (g) Fractional labeling of intracellular aspartate from the indicated cancer cell lines cultured with 1 mM U-13C asparagine for 24 hours. (h) Schematic summarizing the permeability of asparagine (ASN) and aspartate (ASP), and the inability of cells to convert ASN to ASP. p values were calculated by unpaired one-tailed t test (c, d, f). Values denote mean ± SEM. Sample size (n) = 3 independent biological replicates from a single representative experiment (a-d, f, g). Source data for f and g are available in Supplementary Table 1.
While these data indicate a difference in the ability of physiological levels of aspartate and asparagine to enter cells, we also determined whether these permeability characteristics applied to their release from cells. To test this, we measured the extracellular release of metabolites into saline with and without the detergent saponin (Fig. 1e). Saponin can form pores when complexed to cholesterol in the cytoplasmic membrane, a process that takes approximately five minutes, causing release of cytosolic small molecules by diffusion3. We reasoned that permeable metabolites would equilibrate rapidly with extracellular saline, while impermeable metabolites would only equilibrate after the cytoplasmic membrane was permeabilized with saponin. Lactate, a molecule known to rapidly equilibrate across cell membranes, showed no difference in concentration in extracellular saline with or without saponin, while glutamate, a molecule known to be concentrated in cells and not readily exported without co-import of another amino acid23, showed saponin-specific metabolite release (Supplementary Fig. 1g). Aspartate, but not asparagine, also shows saponin-specific metabolite release, further arguing that unlike asparagine, aspartate is not readily transported across cell membranes (Fig. 1f). Despite the ability to take up asparagine, none of the cancer cells tested displayed robust conversion of 13C-asparagine to 13C-aspartate (Fig. 1g). These data confirm that asparagine, but not aspartate, is permeable to cell membranes at physiological concentrations, and that these cancer cells lack the ability to convert asparagine to aspartate (Fig. 1h).
We hypothesized that if cells were able to convert asparagine to aspartate, extracellular asparagine might be able to contribute to intracellular aspartate levels (Fig. 2a). Guinea pigs are relatively unique among mammals in possessing asparaginase activity in their blood24. The protein responsible for this activity, guinea pig asparaginase 1 (gpASNase1), has only recently been identified5. We confirmed that recombinant gpASNase1 has asparaginase activity (Supplementary Fig. 2a). When epitope tagged gpASNase1 is expressed in 143B cells (Fig. 2b), an increase in cellular asparaginase activity is observed (Supplementary Fig. 2b). Expression of gpASNase1 results in a minor proliferation defect compared to empty vector (ev) control cells in media lacking asparagine and has no effect on proliferation in media with asparagine (Fig. 2c). Since asparagine depletion can lead to cell death in certain contexts20–22, we determined whether gpASNase1 expression could negatively affect cells when asparagine synthesis was impaired. Indeed, shRNA mediated knockdown of asparagine synthetase (ASNS) does not affect cell viability when asparagine is available but synergizes with gpASNase1 to kill cells cultured without asparagine (Supplementary Fig. 2c-e). These data confirm that asparagine depletion can impair viability and argue that these cells have sufficient endogenous ASNS capacity to avoid detrimental effects of asparagine consumption by gpASNase1.
Figure 2. Heterologous expression of guinea pig asparaginase 1 confers asparaginase activity to cells.
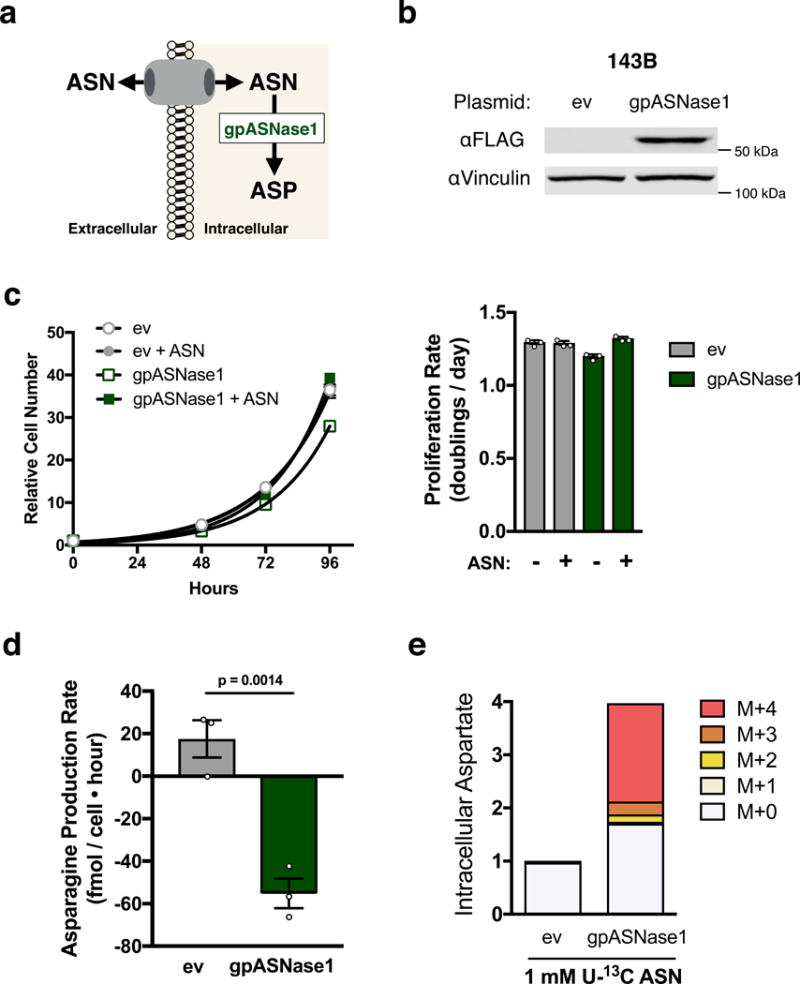
(a) Schematic depicting how intracellular expression of gpASNase1 allows environmental asparagine to support intracellular aspartate levels. (b) Western blot analysis of 143B cells expressing empty vector (ev) or FLAG-tagged gpASNase1 as indicated. gpASNase1 expression is detected with an anti-FLAG antibody, and vinculin expression is also shown as a loading control. Predicted molecular weight of gpASNase1 is 60 kDa. This experiment was repeated with similar results 4 times. (c) Relative cell number over time of 143B cells expressing ev or gpASNase1, in the presence or absence of 1 mM asparagine as indicated (left). These data were used to calculate proliferation rate (right). (d) Asparagine production/consumption rate of 143B cells expressing ev or gpASNase1 cultured in 1 mM asparagine as indicated. p value was calculated by unpaired one-tailed t test. (e) Measurement of aspartate levels (magnitude of bars) and fractional isotopomer labeling (colored segments) of ev or gpASNase1-expressing 143B cells cultured with 1 mM U-13C labeled asparagine for 24 hours. Values denote mean ± SEM. Sample size (n) = 3 independent biological replicates from a single representative experiment (c-e). Source data for c and e are available in Supplementary Table 1.
To determine whether gpASNase1 expression changes nutrient utilization, we examined asparagine levels in the media over time for gpASNase1-expressing and control cells. While control cells net produce asparagine, gpASNase1 cells consume asparagine (Fig. 2d). When cells are cultured in media containing U-13C-labeled asparagine, gpASNase1 expressing cells exhibit increased aspartate levels, with a substantial fraction of the aspartate labeled from U-13C asparagine (Fig. 2e). Asparagine-derived aspartate is also incorporated into known aspartate utilizing pathways, including the tricarboxylic acid (TCA) cycle and pyrimidine synthesis (Supplementary Fig. 2f, g). Cells expressing gpASNase1 had increased levels of some aspartate derived metabolites compared to control cells (Supplementary Fig. 2h), but consistent with previous work2–4, aspartate supplementation did not affect the intracellular NAD+/NADH ratio (Supplementary Fig. 2i). These data indicate that gpASNase1 expression confers the ability to convert environmental asparagine into intracellular aspartate and downstream products of aspartate metabolism.
Expression of gpASNase1 is predicted to restore proliferation to aspartate-limited cells when asparagine is available. Since glutamine is a major source of intracellular aspartate for most cells in culture25–27, we examined whether gpASNase1 provides an orthogonal source of aspartate and decreases glutamine utilization (Fig. 3a). Indeed, providing asparagine decreased anaplerotic glutamine consumption (glutamine consumed – glutamate released) in gpASNase1-expressing, but not control cells, and had no effect on other major nutrient fluxes (Fig. 3b, Supplementary Fig. 3a, b). Asparagine also restores proliferation of gpASNase1-expressing cells, but not control cells, in glutamine limited conditions (Fig. 3c).
Figure 3. gpASNase1 expression allows extracellular asparagine to support proliferation under conditions where aspartate is limiting.
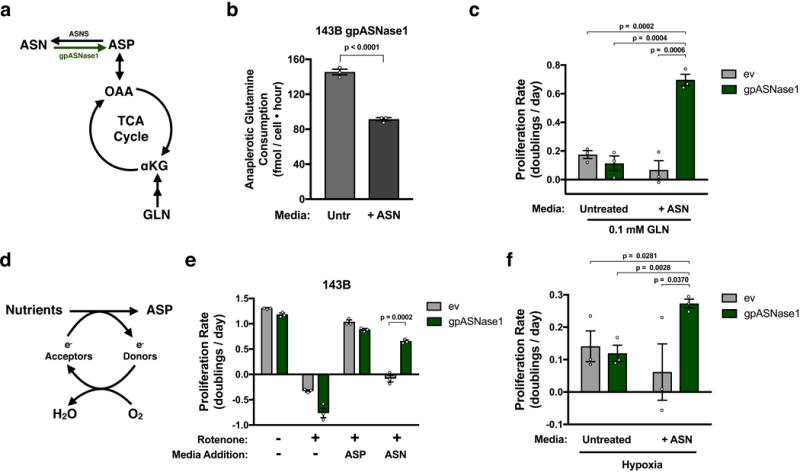
(a) Schematic indicating the relationship between glutamine (GLN) metabolism and aspartate(ASP)/asparagine(ASN) metabolism and the tricarboxylic acid (TCA) cycle. α-ketoglutarate (αKG); Oxaloacetic acid (OAA); asparagine synthetase (ASNS). (b) Anaplerotic glutamine consumption (glutamine consumption rate – glutamate release rate) from media when 143B gpASNase1 cells are cultured in the presence or absence of 1 mM asparagine as indicated. (c) Proliferation rate of 143B cells expressing empty vector (ev) or gpASNase1 when cultured in 0.1 mM glutamine in the presence or absence of 1 mM asparagine as indicated. (d) Schematic depicting the requirement for electron acceptors to produce aspartate. (e) Proliferation rate of 143B cells expressing empty vector (ev) or gpASNase1, with or without 120 nM rotenone, and cultured in media with or without 20 mM aspartate or 1 mM asparagine as indicted. (f) Proliferation rate of 143B cells expressing empty vector (ev) or gpASNase1 when cultured in hypoxia (0.8% O2), in the presence or absence of 1 mM asparagine, as indicated. p values were calculated by unpaired one-tailed t test (b, c, e, f) Values denote mean ± SEM. Sample size (n) = 3 independent biological replicates from a single representative experiment (b, c, e, f).
Inhibiting mitochondrial respiration decreases aspartate synthesis, making cells dependent on alternative electron acceptors or supplementation with supraphysiological concentrations of aspartate2–4,10,28,29 (Fig. 3d). We confirmed that rotenone, an inhibitor of mitochondrial ETC complex I, inhibits proliferation of control and gpASNase1 cells in the absence of asparagine and that supplementation with 20 mM aspartate restores proliferation (Fig. 3e). Asparagine supplementation restores gpASNase1-expressing cell proliferation, but not control cell proliferation, to rotenone treated cells, consistent with gpASNase1 expression allowing asparagine to support aspartate levels (Fig. 3e). Supplementation with nucleotide precursors that bypass the demand for aspartate to support nucleotide synthesis can also partially restore rotenone treated cell proliferation (Supplementary Fig. 3c). These data highlight the demand for aspartate to support nucleotide synthesis, but do not exclude protein synthesis as another critical demand for aspartate. Two respiration incompetent cell lines, 143B cytB and UOK262 cells, require exogenous electron acceptors or high dose aspartate treatment to proliferate2,4,28, and asparagine only restored proliferation of these cells when gpASNase1 was expressed (Supplementary Fig. 3d, e). Expression of gpASNase1 also partially restored cell proliferation in hypoxia (0.8% O2), an electron acceptor-deficient state experienced by cancer cells in vivo, but only when asparagine is provided in the culture media (Fig. 3f). In fact, 143B derived xenograft tumours show comparable levels of HIF1α protein, a marker of hypoxia, as 143B cells cultured in 0.8% O2 (Supplementary Fig. 3f). These data support the hypothesis that environmental conditions in vivo may cause aspartate acquisition to be a metabolic limitation for tumour growth.
To determine whether expressing gpASNase1 allows cancer cells to obtain aspartate from circulating asparagine, we quantified aspartate and asparagine levels in mouse plasma and found micromolar concentrations of each, consistent with previous reports14 (Fig. 4a). At these concentrations, asparagine is permeable to cells, whereas aspartate is not (Fig. 1a). We then measured the contribution of U-13C-labeled asparagine to intracellular aspartate in control and gpASNase1 cells at physiological asparagine concentrations. Under these conditions, asparagine labeled the intracellular aspartate pool in gpASNase1-expressing cells, with approximately 20% of the intracellular aspartate pool being derived from asparagine after 3 hours and reaching steady state at approximately 25% labeling after 8 hours (Fig. 4b, Supplementary Fig. 4a). In addition, physiological asparagine levels can partially restore proliferation of gpASNase1-expressing cells subjected to rotenone treatment or glutamine limitation (Fig 4c, Supplementary Fig. 4b).
Figure 4. Expression of gpASNase1 increases tumour growth rate and causes metformin insensitivity.
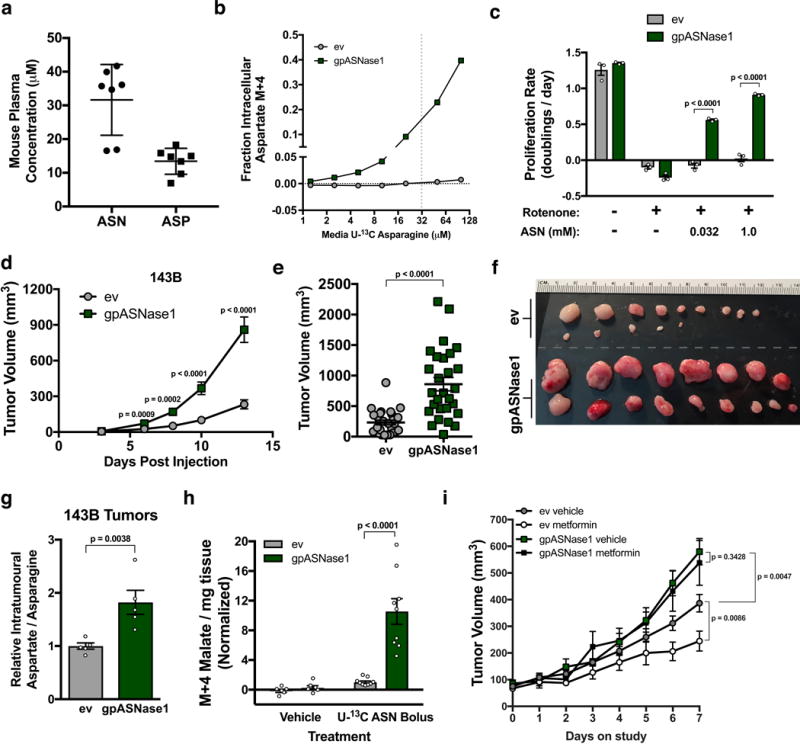
(a) Concentrations of asparagine and aspartate in mouse plasma. (b) Fractional labeling of intracellular aspartate from 143B cells expressing empty vector (ev) or gpASNase1 when cultured with the indicated concentrations of U-13C asparagine for 3 hours. This experiment was repeated with similar results one time. (c) Proliferation rate of 143B cells expressing ev or gpASNase1, with or without rotenone (120 nM), and cultured in media with the indicated concentrations of asparagine. (d) Volumes of tumours derived from 143B cells expressing empty vector (ev) or gpASNase1 measured over time as indicated. (e) Tumour volumes 13 days after implantation of 143B cells expressing empty vector (ev) or gpASNase1 as indicated. (f) Tumours dissected 13 days after implantation of 143B cells expressing empty vector (ev) (top rows) and gpASNase1 (bottom rows) from a separate experiment as (d and e). (g) Relative aspartate to asparagine ratio from tumours derived from 143B cells expressing empty vector (ev) or gpASNase1 as indicated. (h) Measurement of labeled M+4 malate in tumours derived from AL1376 cells expressing ev or gpASNase1 following two boluses of either vehicle (saline) or 30 mg/ml U-13C asparagine. (i) Assessment of tumour volume over time for tumours derived from 143B cells expressing ev or gpASNase1 in mice that were treated with either vehicle (water) or 1 g/kg metformin once daily by oral gavage. Treatment was initiated in mice with size-matched tumours after reaching 45 mm3. p values were calculated by unpaired one-tailed t test (c-e, g-i). Values denote mean ± SEM. Sample size (n) = 7 independent biological replicates from a single representative experiment (a), n = 3 independent biological replicates from a single representative experiment (b, c), 10 mice were injected per genotype, with 3 injections per mouse (d-f) yielding n = 27 (ev) and n = 28 (gpASNase1), n = 5 measurements from independent tumors from each genotype (g), n = 6 (vehicle) or n = 9 (bolus) independent tumor samples from each genotype (h). For (i) 5 mice were used per group harboring 3 injection sites each, when tumours reached ≥ 45 mm3 they were put on study, occasionally resulting in multiple tumours per mouse going on study, yielding n = 6 (ev vehicle and ev metformin), n = 7 (gpASNase1 vehicle), and n = 8 (gpASNase1 metformin). Source data for b, d, and i are available in Supplementary Table 1.
We next determined whether gpASNase1 expression could change aspartate metabolism in tumours and affect tumour growth in vivo. Implantation of control and gpASNase1-expressing 143B cells into nu/nu mice resulted in differential tumour growth, with gpASNase1-expressing tumours growing faster than tumours derived from control cells (Fig. 4d), resulting in larger tumour volumes 13 days post tumour implantation (Fig. 4e and f). Expression of gpASNase1 did not affect the efficiency of tumour initiation, arguing that this size difference reflects faster tumour growth (Supplementary Fig. 4c). A similar increase in tumour growth rate in gpASNase1-expressing cells is observed when implanted with control cells into opposite flanks on the same mouse, indicating gpASNase1-expression does not increase tumour growth via a systemic effect (Supplementary Fig. 4d). Measurement of intratumoural metabolites shows an increased aspartate to asparagine ratio in gpASNase1 expressing tumours, consistent with increased asparagine to aspartate conversion (Fig. 4g). To directly test asparaginase activity in tumours, we injected U-13C asparagine or vehicle into mice harboring tumours with or without gpASNase1 expression. Consistent with intracellular metabolism of U-13C asparagine, we only observe robust malate labeling in gpASNase1-expressing tumours (Fig. 4h).
We tested whether gpASNase1 expression affects growth of tumours derived from cancer cells of different tissue origins and genotypes. We expressed gpASNase1 and observed conversion of asparagine to aspartate in gpASNase1-expressing HCT116, AL1376, and AsPC-1 cells (Supplementary Fig. 4e, f). Expression of gpASNase1 increased tumour growth in HCT116 and AL1376 derived tumours, but not AsPC-1-derived tumours, suggesting that some cancer cells are aspartate-limited in tumours, but that aspartate is not limiting growth of all tumours (Supplementary Fig. 4g). In all cases, increases in the intratumoural aspartate to asparagine ratio were observed in gpASNase1 tumours and there were no significant differences in the rate of tumour formation (Supplementary Fig. 4h, i). Expression of gpASNase1 altered several metabolite levels in tumours, although the most consistent change was decreased asparagine levels (Supplementary Fig. 4j). As observed in culture, gpASNase1 expression did not alter NAD+ levels in tumours (Supplementary Fig 4k). Collectively these data indicate gpASNase1 expression can supply aspartate in physiological contexts, and that obtaining aspartate can limit the growth of some tumours. Expression of asparaginases from other organisms can have differential effects on tumour growth22, potentially indicating that the mammalian asparaginase used here has enzyme properties that preclude intracellular asparagine depletion to deleterious levels. Regardless, the observation that SLC1A3 expression can also increase tumour growth supports aspartate production being limiting in some cancers19.
Different tumours rely on distinct metabolic pathways to support growth, which can be influenced by the cancer genotype, tissue environment, and cell lineage1. The finding that cancer cells of disparate lineage and genotype can be engineered to grow tumours faster by expressing gpASNase1 suggests that acquiring aspartate may be a metabolic limitation for a subset of cancers. Different pathways can support aspartate levels in tumours from different tissues. For example, glucose supports aspartate synthesis in some lung cancers7,9, while some pancreatic cancers catabolize extracellular protein as a source of aspartate30. Importantly, inhibition of these pathways in their respective contexts can suppress tumour growth in vivo7,9,31. Another potential method to suppress aspartate levels in tumours is to inhibit mitochondrial respiration. Indeed, the anti-diabetes drug metformin can inhibit tumour growth via cancer cell autonomous inhibition of mitochondrial complex I32,33. The anti-cancer activity of metformin can correspond with decreases in intratumoural aspartate, suggesting that metformin may suppress tumour growth through aspartate limitation3. To test this, we implanted 143B cells with or without gpASNase1 expression into nu/nu mice and, upon tumours reaching 45 mm3, treated the mice with either metformin or vehicle. Whereas metformin suppressed control tumour growth, metformin had no effect on the growth of gpASNase1-expressing tumours (Fig. 4i). These data support the hypothesis that metformin can suppress tumour growth by exacerbating an endogenous aspartate limitation.
Why some cancer cells are more aspartate-limited than others is unknown, but may be related to the method by which they acquire aspartate or their metabolic gene expression34. One possible contributor is intratumoural hypoxia, which limits access to the electron acceptors that are important for aspartate synthesis. The finding that gpASNase1 has no effect on AsPC-1 tumour growth argues that aspartate is not necessarily a limiting metabolite for the growth of all tumours, or by extension all proliferating cells in normal tissues. Thus, these data argue that targeting aspartate production may have particular efficacy to inhibit the growth of some tumours.
Methods
Cell culture and generation of cell lines
All cell lines were passaged in DMEM with pyruvate (Corning, 50-003) supplemented with 10% fetal bovine serum (Sigma) and penicillin-streptomycin (Corning). The identity of 143B, 468, 786-o, A172, AsPC-1, HCT116, HeLa, HT1080, and TT cells were authenticated by satellite tandem repeat testing and referenced to ATCC values. AL1376 cells were generated in house from a pancreatic tumour from the KP-/-C (KrasG12D/+; Trp53fl/fl; Pdx1-cre) mouse model of pancreatic adenocarcinoma. All cell lines were negative for mycoplasma (Lonza, MycoAlert). For experiments, media was changed to DMEM without pyruvate (Corning, 50-013) supplemented with 10% dialyzed fetal bovine serum (Sigma), penicillin-streptomycin, and treatments as indicated. 143B CytB cells were also supplemented with 0.1 mg/mL uridine.
The protein sequence of gpASNase1 was reverse translated into a nucleotide sequence which was synthesized and inserted into a pUC57 plasmid (Biomatik). Primers were designed to amplify the gpASNase1 sequence, encode a C-terminal FLAG tag, and use restriction cloning to insert gpASNase1 into the plasmid pLHCX. Primers used were AAATTTAAGCTTATGGCCCGAGCGAGTGGTAG and CCAGAGGTGCCACCTGCCATTGGTTCTGGTTCTGACTACAAAGACGATGACGACAAGTAGATCGAT AAATTT, both 5’ to 3’. HINDIII and CLAI were used to cut at restriction sites.
Retrovirus was generated in HEK293T cells by transfection using standard techniques. Cells were infected with virus containing either empty vector pLHCX or gpASNase1 pLHCX and were selected with 200 μg/mL (143B, 143B CytB, UOK262, AsPC-1) or 500 μg/mL (AL1376, HCT116) hygromycin B (Invitrogen). Cell were maintained in hygromycin B containing media until all uninfected control cells had died.
Expression of SLC1A3 was accomplished in 143B cells using virus generated from PMXS-SLC1A3, a gift from David Sabatini (Addgene plasmid # 72873). Standard techniques were used and cells were selected in 5 μg/mL blasticidin (Invitrogen).
Knockdown of ASNS was accomplished in 143B cells using standard techniques to generate virus containing pLKO.1 shRNA targeting either human ASNS (Sigma TRCN0000290103 (ASNS1), TRCN0000290105 (ASNS2)) or GFP (Addgene plasmid #30323). Cells were maintained in 2 μg/ml puromycin containing media until all uninfected control cells had died.
Metabolite permeability assays
Cells were plated in 6 well dishes at 2.5E5 cells per well and allowed to incubate overnight. The next day, cells were washed two times with PBS, 4 mL media containing the indicated concentrations of U-13C labeled aspartate and asparagine was added, and cells were incubated for 1 hour. At the end point, cells were washed 3 times with ice cold saline and extracted with 300 μL 80% methanol containing norvaline standard. Extracts were centrifuged at 21,000 g for 10 minutes at 4°C, 200 μL of supernatant was moved to a fresh microcentrifuge tube, and extracts were dried under N2 gas. Dried extracts were then frozen at –80°C before subsequent derivatization and measurement by GCMS (aspartate) or resuspension in 1:1 acetonitrile:H2O and measurement by LCMS (asparagine).
GCMS
Polar metabolites were analyzed by gas chromatography mass spectrometry (GCMS). Dried extracts were derivatized with 16 μL MOX reagent (Thermo) for 60 minutes at 37°C followed by 20 μL N-tert-Butyldimethylsilyl-N-methyltrifluoroacetamide with 1% tert-Butyldimethylchlorosilane (Sigma) for 30 minutes at 60 °C. Following derivatization, samples were analyzed using an Agilent 7890A gas chromatograph using a DB-35MS column (Agilent) coupled to an Agilent 5975C mass spectrometer. Mass isotopomer distributions and total ion counts were determined by integrating metabolite ion fragments and were corrected for natural abundance.
LCMS
Liquid chromatography mass spectrometry (LCMS) analyses were conducted on a QExactive benchtop orbitrap mass spectrometer equipped with an Ion Max source and a HESI II probe, coupled to a Dionex UltiMate 3000 UPLC system (Thermo Fisher Scientific). External mass calibration was performed using the standard calibration mixture every 7 days. 1-2 uL of each sample was injected onto a SeQuant ZIC-pHILIC 2.1 × 150 mm (5 μm particle size) column (EMD Millipore) using chromatographic separation conditions and MS operating conditions previously described2. Metabolites were monitored in full-scan, polarity-switch, mode with a range of 70-1000 m/z. Relative quantitation of polar metabolites was performed with XCalibur QuanBrowser 2.2 (Thermo Fisher Scientific) using a 5 ppm mass tolerance and referencing an in-house library of chemical standards. For stable isotope labeling studies, data were corrected for natural abundance.
Protein Hydrolysis
143B cells were plated into 6 well dishes at 1.5E5 cells per well and allowed to incubate overnight. The next day, cells were washed two times with PBS, 4 mL media containing the indicated concentrations of U-13C labeled aspartate and asparagine was added, and cells were incubated for 24 hours. At end point, cells were washed with PBS, trypsinized, washed with PBS two more times, and pelleted. Acid hydrolysis of cellular proteins was performed on cell pellets by boiling in 1 mL of 6 M hydrochloric acid for amino acid analysis (Sigma) overnight at 100°C. 50 μL of the HCl solution was then dried under nitrogen while heating at 80°C. The dried hydrolysates were then frozen at –80°C before subsequent derivatization and measurement by GCMS.
Saponin-specific metabolite release
1E6 143B cells were split onto a 6 well dish and incubated overnight. The next day media was quickly decanted and 1 mL of saline with or without 100 μg/mL saponin was added to cells. After 0.5, 2, 10, and 30 minutes, 50 μL was removed to a microcentrifuge tube and set on ice. 20 μL of each sample was added to 300 μL HPLC grade ethanol. Samples were centrifuged at 21,000 g for 10 minutes at 4°C, 200 μL of supernatant was moved to a fresh microcentrifuge tube, and extracts were dried under N2 gas. Samples were resuspended in 20 μL 1:1 H2O:acetonitrile and metabolites were measured by LCMS. Due to differences in metabolite transport, ionization efficiencies of different molecules, and different residual concentrations from the original media, the magnitude that a molecule changes over time cannot be used to interpret its relative concentration in cells or media. However, a change in metabolite levels after saponin pore formation relative to untreated saline indicates that the metabolite is not released from cells in saline as readily as when cells were permeabilized.
Cellular asparaginase activity
Cells were plated into 6 well dishes at 1.5E5 cells per well and allowed to incubate overnight. The next day, cells were washed two times with PBS, 4 mL media containing 1 mM U-13C labeled asparagine was added, and cells were incubated the indicated time. At the end point, cells were washed 3 times with ice cold saline and extracted with 300 μL 80% methanol containing norvaline standard. Extracts were centrifuged at 21,000 g for 10 minutes at 4°C, 200 μL of supernatant was moved to a fresh microcentrifuge tube, and extracts were dried under N2 gas. Dried extracts were then frozen at –80°C before subsequent derivatization and measurement of aspartate isotopomer abundance by GCMS.
Purification of recombinant asparaginase
gpASNase1 was cloned into pET28a(+) by Gibson Assembly (New England Biolabs) according to the manufacturer’s protocol. The resulting vector encodes gpASNase1 with a C-terminal 6xHis tag following a Ser-Gly-Ser-Gly linker. The vector was transformed into BL21(DE3) E. coli, which were grown at 37 °C to an optical density of 0.7 at 600 nm before asparaginase expression was induced with 0.5 mM (final) isopropyl β-β-1-thiogalactopyranoside for 6 hours at room temperature. Bacteria were flash frozen, resuspended in lysis buffer (50 mM Tris-HCl pH 8.5, 300 mM NaCl, 10% (v/v) glycerol, 5 mM imidazole), and lysed by sonication. The clarified lysate was incubated with Ni-NTA agarose beads (Qiagen), and the bound material was washed extensively with wash buffer (lysis buffer containing 30 mM imidazole) before elution into elution buffer (50 mM Tris-HCl pH 8.5, 250 mM NaCl, 10% (v/v) glycerol, 250 mM imidazole). The eluted enzyme was dialyzed against dialysis buffer (50 mM Tris-HCl pH 7.5, 25 mM NaCl, 20% (v/v) glycerol) overnight before being aliquoted and frozen.
Recombinant asparaginase activity
Asparaginase catalytic activity was monitored by a linked assay described previously5. In this assay, aspartate produced by the hydrolysis of asparagine is transaminated to oxaloacetate that is reduced to malate, resulting in the loss of NADH, and the rate of consumption of NADH is calculated from the decrease in absorbance at 340 nm. Each reaction included 200 μM NADH, 200 μM α-ketoglutarate, 5 U glutamate-oxaloacetate transaminase (Roche), and 1.5 U malate dehydrogenase (Roche) as well as reaction buffer (100 mM Tris-HCl pH 7.5, 100 mM KCl). Reactions were conducted in a 100 μL volume at room temperate. Each reaction contained either commercial E. coli asparaginase (Biovendor), recombinant His-tagged gpASNase1 at the indicated final concentrations, hypotonic lysate (at 600 μg/mL final concentration), or buffer (no enzyme control). Activity was determined in the presence or absence of 1 mM asparagine. To control for the non-specific loss of NADH absorbance, each specific activity value reported is the difference between these values. Hypotonic lysates were prepared by washing trypsinized cells with cold PBS before incubation in hypotonic buffer (20 mM HEPES-KOH pH 7.0, 5 mM KCl, 1 mM MgCl2, 0.5 mM DTT, and 1x cOmplete mini protease inhibitor (Roche)) for 10 minutes on ice. Cells were lysed by passing them through a 22.5-gauge needle 15 times, and lysates were clarified for 10 minutes at 4 °C. KCl was added to a final concentration of 100 mM. Protein concentrations were determined by Bradford assay using bovine serum albumin as a standard.
Proliferation Assays
Cells were plated in replicate in six well dishes (Corning), with an initial seeding density of 20,000 cells per well for 143B cells, and 30,000 cells per well for 143B CytB and UOK262 cells. After seeding, cells were allowed to equilibrate overnight and one six-well dish was counted to quantify the starting cell number prior to treatment. The wells in the remaining dishes were washed twice with phosphate buffered saline and 4 mL of media containing the indicated treatments was added. Final cell counts were determined 4 days after initial treatment using a Cellometer Auto T4 Plus Cell Counter (Nexcelom Biosciences). Proliferation rate was determined based on the following formula:
Western Blot Analysis
Cells expressing either empty vector or c-terminal FLAG tagged gpASNase1 were washed with cold PBS and lysed with cold RIPA buffer containing cOmplete Mini protease inhibitors (Roche). Protein concentration was determined by BCA Protein Assay (Pierce) using BSA as a standard. Samples were resolved by SDS-PAGE using standard techniques, and protein was detected with the following antibodies: primary antibodies: FLAG (Cell Signaling, 2368, 1:1000), Vinculin (Abcam, ab18058, 1:10,000), ASNS (Sigma, HPA029318, 1:250), HIF1α (BD Transduction Laboratories, 610958, 1:250); secondary antibodies: IR680LT dye conjugated anti-rabbit IgG (Licor Biosciences, 925-68021, 1:10,000), IR800 dye conjugated anti-mouse IgG (Licor Biosciences, 925-32210, 1:10,000), HRP-linked Anti-mouse IgG (Cell Signaling, 7076S, 1:10.000). FLAG and ASNS blots were imaged by an Odyssey infrared scanner (Licor Biosciences) and analyzed using Image Studio Lite. HIF1α blots were imaged with film (Denville Scientific).
Metabolite consumption or production
Metabolite consumption or production was determined by measuring the change in metabolite levels in the medium collected from the culture of proliferating cells. Cell number was measured from duplicate treatment plates to determine proliferation rate and metabolite flux was determined with the following formula:
Where N0 is initial cell count (cells), T is final time point (hours), k is proliferation rate (doublings/hour) Asparagine levels in medium were quantified by LCMS and compared to a standard curve of U-13C asparagine in medium. Measurements of glucose, lactate, glutamine, and glutamate in medium were measured on a YSI-2950 Biochemistry Analyzer (Yellow Springs Instruments).
Mouse studies
All experiments performed in this study were approved and compliant with ethical regulations regarding animal research provided by the MIT Committee on Animal care (IACUC). Nu/nu mice were purchased from Charles river (088) with ad lib access to food and water.
Mouse plasma metabolite measurement
To collect mouse plasma samples, animals were anesthetized using a mixture of isofluorane and oxygen and blood was collected into EDTA-containing tubes via retro-orbital bleeding. Samples were centrifuged at 3,000 rpm for 10 minutes at 4°C, supernatant collected and re-centrifuged. Plasma samples were collected and stored at −80°C until further analysis.
Xenograft tumour growth
Cancer cells were suspended in 100 μL PBS and injected into the flanks of 6-8 week old, male nu/nu mice at 1E6 cells per injection (143B, AsPC-1), 2E5 cells per injection (AL1376), or 3E6 cells per injection (HCT116). When tumours became palpable, tumour volume was measured by calipers in two dimensions, and volumes were estimated using the equation V = (π/6)(L x W2). Only tumour sites that formed tumours by the end point of the growth assay were measured and factored into the tumour volume calculation. For experiments comparing ev and gpASNase1 expressing cells, sample size estimates were not conducted prior to initiating experiments, mice were not randomized, and the primary investigator was not blinded during or after the experiment, although results were qualitatively verified by blinded investigators. For experiments determining the efficacy of metformin treatment in tumours derived from cells expressing ev or gpASNase1, tumours were permitted to grow to 45 mm3, after which animals were randomly assigned to treatment or vehicle group. Vehicle (water) or 1 g/kg metformin (in water) was dosed via oral gavage daily for 8 days. Measurements of tumour volume for this experiment were conducted by a blinded investigator. Mice were sacrificed at endpoints consistent with our mouse protocol or prior if recommended by the veterinary staff.
Tumour metabolite extraction
After excision, tumours were rapidly freeze-clamped using a liquid nitrogen cooled BioSqueezer (Biospec Products) and stored at −80°C. 5-20 mg pieces of frozen tumour tissue were cryogenically homogenized (Retsch Cryomill) and extracted with 1.3 mL 6:3:4 methanol:H2O:chloroform. Tumour extractions were vortexed at 4°C for 10 minutes, centrifuged at 21,000 g for 10 minutes at 4°C, and 500 μL of the upper, aqueous layer was moved to a fresh microcentrifuge tube and dried under N2. Dried extracts were resuspended in 50 μL acetonitrile:H2O and metabolites were measured by LCMS.
Tumour protein extraction
5-20 mg pieces of frozen tumour tissue was homogenized in 300 μL of ice cold RIPA buffer containing cOmplete Mini protease inhibitors (Roche) and 1% Antifoam Y-30 (Sigma) using gentleMACS dissociators (Miltenya Biotec). Tissue homogenate protein was quantified and analyzed as normal for western blot analysis.
Asparagine tracing in tumours
Following xenograft growth assay of AL1376 cells expressing ev or gpASNase1, mice were given a retro orbital bolus of either vehicle (saline) or 30 mg/ml U-13C asparagine at time 0 and 30 minutes. One hour after the initial bolus, mice were sacrificed and tumours were extracted for metabolite analysis by LCMS as detailed above. Due to small contaminating amounts of U-13C aspartate in the U-13C asparagine stock, measurement of M+4 aspartate in tumours was confounded by labeled aspartate in the blood. Since this blood level of aspartate was far below what is required to enter cells, we rationalized that we could use a downstream metabolite of intracellular aspartate metabolism, malate, which is not detectable in the blood, as a surrogate for intracellular asparaginase activity.
Statistics and Reproducibility
Data are presented as mean ± SEM. Samples size (n) indicates experimental replicates from a single representative experiment; the results of experiments were validated by independent repetitions. For all experiments, each data point analyzed was from an independent biological sample. The experiments in Figures 4b and Supplementary Figures 2c, 3d, and 4e were repeated one time. Statistical significance typically determined using an unpaired one-tailed t test, in which significance was determined as p ≤ 0.05. Determination of the statistical significance of tumour formation efficiency was determined by a two-sided Fisher’s exact test.
Data Availability
Source data for Figures 1f, 1g, 2c, 2e, 4b, 4d, 4i and Supplementary Figures 1g, 2f, 2g, 2h, 3b, 4a, 4c, 4d, 4f, 4g, 4i, 4j have been provided in Supplementary Table 1. Metabolomics data for Supplementary Figures 2h and 4j have also been deposited at https://doi.org/10.6084/m9.figshare.6169409. All other data generated that support the findings of this study are available from the corresponding author upon reasonable request.
Supplementary Material
Acknowledgments
We thank members of the Vander Heiden lab for helpful discussions. We also thank the AIPT core within the Koch Institute Swanson Biotechnology Center for assistance with the metformin xenograft study. L.B.S. acknowledges support from a postdoctoral fellowship, PF-15-096-01-TBE, from the American Cancer Society and a Pathway to Independence award from the NIH (K99CA218679). A.L. was supported by the Ludwig Center for Molecular Oncology Fund and NSF (GRFP DGE-1122374). L.V.D. was supported by a NIH Ruth Kirschstein Fellowship, F32CA210421. L.N.B. was supported by Alex’s Lemonade Stand Undergraduate Research Fellowship. A.N.L is a Robert Black Fellow of the Damon Runyon Cancer Research Foundation, DRG-2241-15. M.G.V.H. acknowledges support from a Faculty Scholar grant from the Howard Hughes Medical Institute, SU2C, the Lustgarten Foundation, the Ludwig Center at MIT, and the NIH (R01CA201276, R01CA168653, P30CA14051).
References
- 1.Vander Heiden MG, DeBerardinis RJ. Understanding the Intersections between Metabolism and Cancer Biology. Cell. 2017;168:657–669. doi: 10.1016/j.cell.2016.12.039. [DOI] [PMC free article] [PubMed] [Google Scholar]
- 2.Sullivan LB, et al. Supporting Aspartate Biosynthesis Is an Essential Function of Respiration in Proliferating Cells. Cell. 2015;162:552–63. doi: 10.1016/j.cell.2015.07.017. [DOI] [PMC free article] [PubMed] [Google Scholar]
- 3.Gui DY, et al. Environment Dictates Dependence on Mitochondrial Complex I for NAD+ and Aspartate Production and Determines Cancer Cell Sensitivity to Metformin. Cell Metab. 2016;24:716–727. doi: 10.1016/j.cmet.2016.09.006. [DOI] [PMC free article] [PubMed] [Google Scholar]
- 4.Birsoy K, et al. An Essential Role of the Mitochondrial Electron Transport Chain in Cell Proliferation Is to Enable Aspartate Synthesis. Cell. 2015;162:540–551. doi: 10.1016/j.cell.2015.07.016. [DOI] [PMC free article] [PubMed] [Google Scholar]
- 5.Schalk AM, Nguyen HA, Rigouin C, Lavie A. Identification and Structural Analysis of an l-Asparaginase Enzyme from Guinea Pig with Putative Tumor Cell Killing Properties. J Biol Chem. 2014;289:33175–33186. doi: 10.1074/jbc.M114.609552. [DOI] [PMC free article] [PubMed] [Google Scholar]
- 6.Muir A, et al. Environmental cystine drives glutamine anaplerosis and sensitizes cancer cells to glutaminase inhibition. Elife. 2017;6 doi: 10.7554/eLife.27713. [DOI] [PMC free article] [PubMed] [Google Scholar]
- 7.Davidson SM, et al. Environment Impacts the Metabolic Dependencies of Ras-Driven Non-Small Cell Lung Cancer. Cell Metab. 2016;23:517–28. doi: 10.1016/j.cmet.2016.01.007. [DOI] [PMC free article] [PubMed] [Google Scholar]
- 8.Hensley CT, et al. Metabolic Heterogeneity in Human Lung Tumors. Cell. 2016;164:681–694. doi: 10.1016/j.cell.2015.12.034. [DOI] [PMC free article] [PubMed] [Google Scholar]
- 9.Sellers K, et al. Pyruvate carboxylase is critical for non–small-cell lung cancer proliferation. J Clin Invest. 2015;125:687–698. doi: 10.1172/JCI72873. [DOI] [PMC free article] [PubMed] [Google Scholar]
- 10.Titov DV, et al. Complementation of mitochondrial electron transport chain by manipulation of the NAD+/NADH ratio. Science (80-) 2016;352:231–235. doi: 10.1126/science.aad4017. [DOI] [PMC free article] [PubMed] [Google Scholar]
- 11.Wilson WR, Hay MP. Targeting hypoxia in cancer therapy. Nat Rev Cancer. 2011;11:393–410. doi: 10.1038/nrc3064. [DOI] [PubMed] [Google Scholar]
- 12.Wheaton WW, et al. Metformin inhibits mitochondrial complex I of cancer cells to reduce tumorigenesis. Elife. 2014;3 doi: 10.7554/eLife.02242. [DOI] [PMC free article] [PubMed] [Google Scholar]
- 13.Schöckel L, et al. Targeting mitochondrial complex I using BAY 87-2243 reduces melanoma tumor growth. Cancer Metab. 2015;3:11. doi: 10.1186/s40170-015-0138-0. [DOI] [PMC free article] [PubMed] [Google Scholar]
- 14.Mayers JR, Vander Heiden MG. Famine versus feast: understanding the metabolism of tumors in vivo. Trends Biochem Sci. 2015;40:130–140. doi: 10.1016/j.tibs.2015.01.004. [DOI] [PMC free article] [PubMed] [Google Scholar]
- 15.Batool T, Makky EA, Jalal M, Yusoff MM. A Comprehensive Review on l-Asparaginase and Its Applications. Appl Biochem Biotechnol. 2016;178:900–923. doi: 10.1007/s12010-015-1917-3. [DOI] [PubMed] [Google Scholar]
- 16.Cantor JR, Stone EM, Chantranupong L, Georgiou G. The Human Asparaginase-like Protein 1 hASRGL1 Is an Ntn Hydrolase with β-Aspartyl Peptidase Activity. Biochemistry. 2009;48:11026–11031. doi: 10.1021/bi901397h. [DOI] [PMC free article] [PubMed] [Google Scholar]
- 17.Karamitros CS, Konrad M. Human 60-kDa lysophospholipase contains an N-terminal L-asparaginase domain that is allosterically regulated by L-asparagine. J Biol Chem. 2014;289:12962–75. doi: 10.1074/jbc.M113.545038. [DOI] [PMC free article] [PubMed] [Google Scholar]
- 18.Iraci N, et al. Extracellular vesicles are independent metabolic units with asparaginase activity. Nat Chem Biol. 2017 doi: 10.1038/nchembio.2422. [DOI] [PMC free article] [PubMed] [Google Scholar]
- 19.Garcia-Bermudez J, et al. Aspartate is a limiting metabolite for cancer cell proliferation under hypoxia and in tumors. Nat Cell Biol, this issue. 2018 doi: 10.1038/s41556-018-0118-z. [DOI] [PMC free article] [PubMed] [Google Scholar]
- 20.Krall AS, Xu S, Graeber TG, Braas D, Christofk HR. Asparagine promotes cancer cell proliferation through use as an amino acid exchange factor. Nat Commun. 2016;7:11457. doi: 10.1038/ncomms11457. [DOI] [PMC free article] [PubMed] [Google Scholar]
- 21.Zhang J, et al. Asparagine Plays a Critical Role in Regulating Cellular Adaptation to Glutamine Depletion. Mol Cell. 2014;56:205–218. doi: 10.1016/j.molcel.2014.08.018. [DOI] [PMC free article] [PubMed] [Google Scholar]
- 22.Pavlova NN, et al. As Extracellular Glutamine Levels Decline, Asparagine Becomes an Essential Amino Acid. Cell Metab. 2018 doi: 10.1016/j.cmet.2017.12.006. [DOI] [PMC free article] [PubMed] [Google Scholar]
- 23.Park JO, et al. Metabolite concentrations, fluxes and free energies imply efficient enzyme usage. Nat Chem Biol. 2016;12:482–9. doi: 10.1038/nchembio.2077. [DOI] [PMC free article] [PubMed] [Google Scholar]
- 24.Broome JD. Evidence that the L-Asparaginase Activity of Guinea Pig Serum is responsible for its Antilymphoma Effects. Nature. 1961;191:1114–1115. doi: 10.1084/jem.118.1.99. [DOI] [PMC free article] [PubMed] [Google Scholar]
- 25.Patel D, et al. Aspartate Rescues S-phase Arrest Caused by Suppression of Glutamine Utilization in KRas-driven Cancer Cells. J Biol Chem. 2016;291:9322–9329. doi: 10.1074/jbc.M115.710145. [DOI] [PMC free article] [PubMed] [Google Scholar]
- 26.Altman BJ, Stine ZE, Dang CV. From Krebs to clinic: glutamine metabolism to cancer therapy. Nat Rev Cancer. 2016;16:619–634. doi: 10.1038/nrc.2016.71. [DOI] [PMC free article] [PubMed] [Google Scholar]
- 27.Hosios AM, et al. Amino Acids Rather than Glucose Account for the Majority of Cell Mass in Proliferating Mammalian Cells. Dev Cell. 2016;36:540–549. doi: 10.1016/j.devcel.2016.02.012. [DOI] [PMC free article] [PubMed] [Google Scholar]
- 28.Martínez-Reyes I, et al. TCA Cycle and Mitochondrial Membrane Potential Are Necessary for Diverse Biological Functions. Mol Cell. 2016;61:199–209. doi: 10.1016/j.molcel.2015.12.002. [DOI] [PMC free article] [PubMed] [Google Scholar]
- 29.Cardaci S, et al. Pyruvate carboxylation enables growth of SDH-deficient cells by supporting aspartate biosynthesis. Nat Cell Biol. 2015;17:1317–26. doi: 10.1038/ncb3233. [DOI] [PMC free article] [PubMed] [Google Scholar]
- 30.Davidson SM, et al. Direct evidence for cancer-cell-autonomous extracellular protein catabolism in pancreatic tumors. Nat Med. 2016;23:235–241. doi: 10.1038/nm.4256. [DOI] [PMC free article] [PubMed] [Google Scholar]
- 31.Commisso C, et al. Macropinocytosis of protein is an amino acid supply route in Ras-transformed cells. Nature. 2013;497:633–7. doi: 10.1038/nature12138. [DOI] [PMC free article] [PubMed] [Google Scholar]
- 32.Wheaton WW, et al. Metformin inhibits mitochondrial complex I of cancer cells to reduce tumorigenesis. Elife. 2014;3 doi: 10.7554/eLife.02242. [DOI] [PMC free article] [PubMed] [Google Scholar]
- 33.Birsoy K, et al. Metabolic determinants of cancer cell sensitivity to glucose limitation and biguanides. Nature. 2014;508:108–112. doi: 10.1038/nature13110. [DOI] [PMC free article] [PubMed] [Google Scholar]
- 34.Rabinovich S, et al. Diversion of aspartate in ASS1-deficient tumours fosters de novo pyrimidine synthesis. Nature. 2015;527:379–383. doi: 10.1038/nature15529. [DOI] [PMC free article] [PubMed] [Google Scholar]
Associated Data
This section collects any data citations, data availability statements, or supplementary materials included in this article.
Supplementary Materials
Data Availability Statement
Source data for Figures 1f, 1g, 2c, 2e, 4b, 4d, 4i and Supplementary Figures 1g, 2f, 2g, 2h, 3b, 4a, 4c, 4d, 4f, 4g, 4i, 4j have been provided in Supplementary Table 1. Metabolomics data for Supplementary Figures 2h and 4j have also been deposited at https://doi.org/10.6084/m9.figshare.6169409. All other data generated that support the findings of this study are available from the corresponding author upon reasonable request.