

Abstract
Heterochromatin mostly comprises repeated DNA sequences prone to ectopic recombination. In Drosophila cells, ‘safe’ homologous recombination repair of heterochromatic double-strand breaks relies on the relocalization of repair sites to the nuclear periphery before strand invasion. Mechanisms responsible for this movement were unknown. Here, we show that relocalization occurs via directed motion along nuclear actin filaments assembled at repair sites by Arp2/3. Relocalization requires Smc5/6-associated nuclear myosins and the myosin activator Unc45, which is recruited to repair sites by Smc5/6. Arp2/3, actin nucleation and myosins also relocalize heterochromatic DSBs in mouse cells. Defects in this pathway result in heterochromatin repair defects and chromosome rearrangements. These findings uncover de novo nuclear actin filaments and myosins as effectors of chromatin dynamics for heterochromatin repair and stability in multi-cellular eukaryotes.
Specialized mechanisms promote homologous recombination (HR) repair in pericentromeric heterochromatin (hereafter ‘heterochromatin’) while preventing aberrant recombination1,2. Heterochromatin constitutes ~30% of fly and human genomes3, mostly comprising repeated DNA sequences (e.g., transposons and ‘satellite’ repeats4) and ‘silent’ epigenetic marks3 (e.g., H3K9me2/3 and HP1), but is absent in budding yeast. In heterochromatin, thousands to millions of identical sequences, even from different chromosomes, can engage in ectopic recombination, presenting a serious threat to genome stability in multicellular eukaryotes1,2,5–8.
In Drosophila melanogaster, heterochromatin forms a distinct nuclear domain5,9, and aberrant recombination is prevented by relocalizing double-strand breaks (DSBs) to the nuclear periphery before Rad51 recruitment5–8,10. Loss of components required for relocalization (e.g., dPIAS SUMO E3-ligase, or the Smc5/6 SUMO E3-ligases Nse2/Qjt, Nse2/Cerv) or for anchoring to periphery (e.g., Nup107 nuclear pore protein or Koi and Spag4 inner nuclear membrane proteins, INMPs), results in heterochromatin repair defects and widespread chromosome rearrangements5,7,8. Relocalization likely prevents aberrant recombination by separating damaged DNAs from similar repeats on non-homologous chromosomes, while promoting ‘safe’ exchanges with the sister or homolog1,2,5–8,10. A similar relocalization to outside heterochromatic ‘chromocenters’ occurs in mouse G2 cells during HR repair6,11,12. What mechanisms drive this striking movement is a major unresolved question.
Actin nucleators mediate relocalization of heterochromatic DSBs
Nuclear actin filaments (F-actin) form in response to DSBs in mammalian cells, and have poorly understood functions in repair13–15. We tested the role of actin polymerization in relocalization of heterochromatic DSBs. In Drosophila cells, repair sites start leaving the heterochromatin domain 10 min after DSB induction with ionizing radiation (IR), resulting in fewer repair sites (γH2Av foci) in DAPI-bright heterochromatin and more at the nuclear periphery 1 h after IR5,7. Inhibition of actin polymerization with Latrunculin B (LatB) increases the number of γH2Av foci in DAPI-bright 1 h after IR, without affecting total focus count (Extended Data Fig. 1a). Similarly, inactivating Arp2/3 actin nucleator by RNAi or CK666 treatment results in more foci remaining in DAPI-bright and fewer reaching the nuclear periphery, consistent with relocalization defects (Fig. 1a, Extended Data Fig. 1b–e). Removal of the chemicals (LatB and CK666) reverses the effects (Extended Data Fig. 1f–g), ruling out permanent damage to repair pathways. RNAi of Spire or Dia actin nucleators does not affect relocalization, revealing a specific role of Arp2/3 (Extended Data Fig. 1h). Relocalization kinetics are comparable in mouse cells, and are similarly affected by Arp3 RNAi, LatB or CK666 treatment (Fig. 1b, Extended Data Fig. 1i–k), suggesting conserved pathways.
Figure 1. Actin nucleators mediate relocalization of heterochromatic DSBs.

(a) Immunofluorescence (IF) and quantification of Kc cells fixed at indicated timepoints after IR show γH2Av foci in DAPI-bright following indicated RNAi. ****P≤0.0001, n≥100 cells/RNAi/timepoint. (b) IF and quantification of NIH3T3 G2 cells at indicated timepoints after IR show γH2AX foci associated with DAPI-bright chromocenters following indicated RNAi. ****P<0.0001, ***P=0.0004 vs Ctrl, n≥20 cells/RNAi/timepoint. (c) As in a., IF performed 60 min after IR. ****P<0.0001 and ***P=0.0009 vs Ctrl, **P=0.0019, n>250 cells/RNAi/timepoint. (d) As in a. ****P<0.0001 vs Ctrl, n>250 cells/RNAi. (e) Immunoprecipitation (Ip) of FHA-Nse2 or GFP-Arp3 in Kc cells before (−) or after (+) IR and Western blot (Wb) analysis with indicated antibodies. Actin, background band (*): loading controls. WCE: whole cell extract. (f) IF and quantification in DAPI-bright at indicated timepoints after IR of γH2Av foci colocalizing with FHA(FLAG-HA)-Arp2 or Arpc3B. Arrows: colocalizations in DAPI-bright. n>30 Kc cells/timepoint/experiment. (g) As in f, colocalizations between γH2Av and Arp2 10 min after IR, following indicated RNAi. ****P<0.0001, n>22 cells/RNAi/experiment. Scale bars: 1 μm. Error bars: mean ± SEM in a,b,f,g and ± SD of at least three independent experiments in c,d. Grey headings above each graph indicate the compartments to which quantifications refer. P values calculated with two-tailed Mann-Whitney test.
Arp2/3 is activated by the Wiskott-Aldrich Syndrome protein family: Wash, Scar, Whamy, and Wasp in fly cells. Depletion of Wash or Scar, but not Whamy or Wasp, causes relocalization defects (Fig. 1c, Extended Data Fig. 1l). Depletion of Arp2/3, Scar+Wash, or Arp2/3+Scar+Wash results in similar relocalization defects, while Scar and Wash RNAi effects are additive (Fig. 1c), suggesting that Scar and Wash independently activate Arp2/3 for relocalization. Arp2/3 is not required for early repair steps (Mu2/Mdc1, ATRIP, Smc6 or Nse2 focus formation, or suppression of Rad51 foci inside the heterochromatin domain5,7,8; Extended Data Fig. 2a–c), suggesting that actin nucleation mediates relocalization after resection and Smc5/6 recruitment.
Epistatic analyses place Smc5/6 and Arp2/3 in the same pathway for relocalization (Fig. 1d and Extended Data Fig. 2g), and Arp2/3 co-immunoprecipitates with the heterochromatin repair complex Smc5/6 in response to IR (Fig. 1e, Extended Data Fig. 2h), suggesting a direct role for Arp2/3 in heterochromatin repair. Accordingly, Arp2/3 is enriched at repair foci in DAPI-bright 10 min after IR, i.e., before relocalization5,7, and most Arp2/3-containing foci are associated with the heterochromatin mark H3K9me3 (Fig. 1f, Extended Data Fig. 2e,f). Smc5/6 or Smc5/6-dependent SUMOylation might promote Arp2/3 activation or recruitment to DSBs. However, RNAi of Smc5/6 or SUMO E3-ligases does not affect Arp2/3 recruitment to foci (Fig. 1g), suggesting a role for Smc5/6 in Arp2/3 regulation. Arp2/3 recruitment to repair foci depends on the DSB signaling protein Mre11 and on the heterochromatin component HP1a (Fig. 1g, Extended Data Fig. 2i), suggesting the concerted activity of these factors as a mechanism for targeting Arp2/3 specifically to heterochromatic DSBs. We conclude that Arp2/3 is recruited to heterochromatic breaks via Mre11 and HP1a, and mediates relocalization of DSBs to the nuclear periphery in concert with Smc5/6.
Nuclear F-actin is required for relocalization
The presence of Arp2/3 at heterochromatic DSBs suggests that actin polymerization at these sites promotes relocalization. We targeted a GFP-tagged F-actin chromobody (F-actCB-GFP-NLS) to the nucleus to visualize nuclear actin filaments in vivo without altering actin levels (Extended Data Fig 3a). Before IR this marker displays a diffuse nuclear signal, but striking filaments surrounding the heterochromatin domain and reaching the nuclear periphery are seen after IR (Fig. 2a, Extended Data Fig 3b, Suppl. Videos 1,2). Phalloidin staining of cells with or without the chromobody indicates these are canonical actin filaments (Extended Data Fig. 3c,d). Consistent with a role for Arp2/3 in filament assembly, filaments are: enriched for Arp2/3 (Extended Data Fig. 3e); disrupted by Arp2/3 RNAi or CK666 (Fig. 2b); and characterized by branches with 70 ± 7° 16 (Extended Data Fig. 3e).
Figure 2. Nuclear F-actin is required for relocalization.

(a) Frames of Suppl. Video 2 and quantification of Kc cells expressing F-actCB-GFP-NLS and mCherry(mCh)-HP1a (heterochromatin mark5) show dynamic filaments in cells treated (+) or non-treated (−) with IR. Arrowheads: filaments reaching the nuclear periphery. Timepoints are after IR. P<0.0001, + vs − IR; n>22 cells/experiment. (b) As in a except cells treated with indicated RNAi or CK666. P<0.0001, Ctrl vs Arp2/3 RNAi, DMSO vs CK666, n≥19 cells/treatment/experiment. (c) Frames of Suppl. Video 3 show Mu2 focus moving along actin filaments. Timepoints relative to start of focus movement. (d) IF of γH2Av foci colocalizing with FLAG-NLS-actin WT, R62D, or S14C at indicated timepoints. ****P<0.0001, ***P=0.0006 n≥40 cells/timepoint/experiment. (e) Quantification of γH2Av foci in DAPI-bright at indicated time points, in cells expressing indicated actin forms after Ipo9 RNAi. ***P=0.0005, **P=0.0019, n≥47 cells/timepoint/experiment. Scale bars: 1 μm. Error bars: mean ± SEM. P values calculated with extra sum-of-squares F-test, nonlinear regression for curve fitting in a,b and two-tailed Mann-Whitney test in d,e.
Filaments form concurrently with DSB departure from the heterochromatin domain (i.e., 10–30 min after IR5,7), persist ~25 min on average, are highly dynamic suggesting actin remodeling17, and progressively disappear during DSB relocalization to the nuclear periphery (i.e., 30–60 min after IR7) (Fig. 2a–c, Extended Data Figs. 3b,c,f,g,4a, Suppl. Videos 2,3). Most filaments originate from repair foci and the heterochromatin domain periphery (Extended Data Fig 4b). Nearly all filaments (98.6%) remain outside the domain during elongation, suggesting they tend to polymerize away from the domain. Filament length spans the distance between the heterochromatin domain periphery and the nuclear periphery (Extended Data Fig. 4c). Repair foci decorate actin filaments in fixed samples and travel along the filaments in time-lapse experiments (Fig. 2c, Extended Data Figs. 3d,4a, Suppl. Video 3). Together, these data support a direct role for actin filaments in relocalization of heterochromatic repair sites to the nuclear periphery.
Triton extraction partially destabilizes actin filaments resulting in residual chromobody signals colocalizing with phalloidin and repair sites (Extended Data Fig. 3d). Similar colocalization occurs in cells expressing FLAG-NLS-tagged wild-type actin (act-WT), but not in cells expressing a non-polymerizable R62D mutant (Fig. 2d, Extended Data Fig. 4e), supporting the presence of F-actin at repair sites. Colocalization between F-actin and DSBs peaks at 10–60 min after IR, followed by a significant decline (Fig. 2d). This reduction likely results from actin depolymerization, given that expression of a filament-stabilizing S14C mutant induces persistent colocalization (Fig. 2d, Extended Data Fig. 4e). Further, consistent with a role of Arp2/3 in filament formation, colocalization between DSBs and F-actin is affected by RNAi of Arp2/3 or Scar+Wash (Extended Data Fig. 4f). Thus, Arp2/3, Scar, and Wash are required to form F-actin at DSBs, with a peak of polymerization during relocalization followed by depolymerization.
We directly tested the role of nuclear F-actin in relocalization of heterochromatic DSBs by investigating the effects of blocking actin polymerization in the nucleus without altering cytoplasmic F-actin. We expressed in the nucleus act-WT or the R62D mutant, while blocking nuclear import of endogenous actin by RNAi depletion of the actin-specific importin Ipo9. Act-WT expression results in normal kinetics of focus relocalization, while expression of act-R62D leads to remarkable relocalization defects (Fig. 2e, Extended Data Fig. 4g–i). We conclude that nuclear actin polymerizes at repair sites, forms long filaments reaching the nuclear periphery, and is required for relocalization of heterochromatic DSBs along the filaments.
Relocalization relies on nuclear myosins
Myosins I and V have been proposed to mediate nuclear dynamics along actin filaments in human cells, including for gene repositioning during transcription18,19, chromosome territory reorganization20, and viral infection21. In Drosophila cells, simultaneous RNAi depletion of myosin I (Myo1A and Myo1B) and myosin V (MyoV) results in defective relocalization of heterochromatic DSBs (Fig. 3a, Extended Data Fig. 5a–c). Relocalization is also impaired after nuclear expression of dominant-negative mutants of MyoV (i.e., NLS-tagged MyoVheadless or MyoVtail) (Fig. 3a, Extended Data Fig. 5b), consistent with a nuclear function of myosins in relocalization.
Figure 3. Relocalization relies on nuclear myosins.
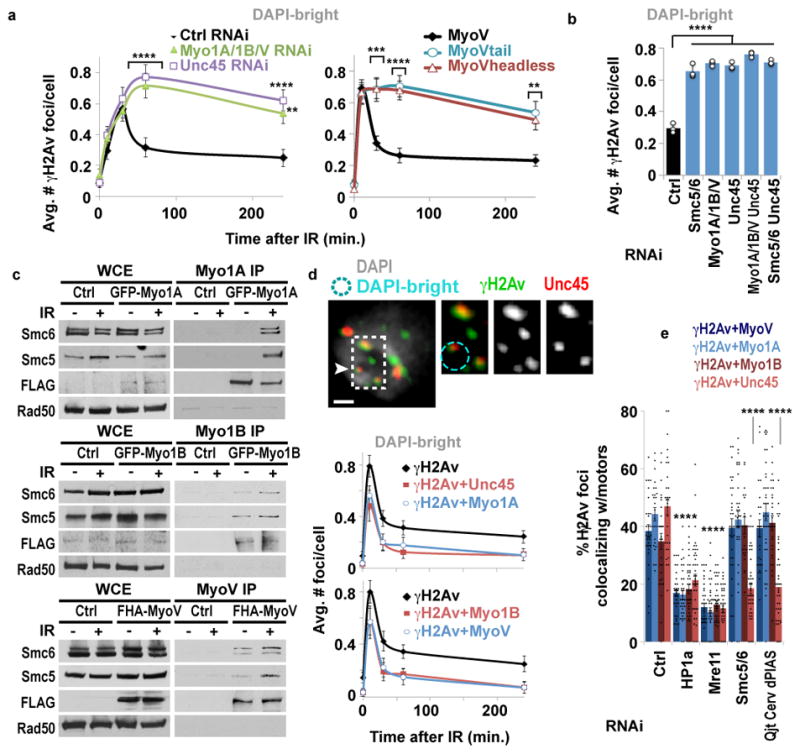
(a) Quantification of Kc cells fixed at indicated timepoints shows γH2Av foci in DAPI-bright following indicated RNAi or expression of MyoV forms. ****P<0.0001, ***P=0.0004, **P≤0.0033, n≥99 cells/RNAi or cell line/timepoint. (b) As in a, 1 h after IR. ****P<0.0001, n≥227 cells/RNAi. Ctrl and Smc5/6 as in Fig. 1d. (c) Ip of GFP-Myo1A, GFP-Myo1B or FHA-MyoV with Smc5/6 before (−) and after (+) IR and Wb analysis with indicated antibodies. (d) IF and quantification in DAPI-bright of γH2Av foci colocalizing with FHA-Myo1A, GFP-Myo1B, MyoV, or Unc45, at indicated timepoints. n ≥30 cells/timepoint/experiment. Scale bars: 1 μm. (g) As in d, 10 min after IR, after indicated RNAi. ****P<0.0001 vs Ctrl, n >24 cells/experiment. Error bars: mean ± SEM in a,d,e and ± SD of at least three independent experiments in b.
Similar relocalization defects occur after RNAi depletion of Unc45 (Fig. 3a, Extended Data Fig. 5a–c), required for myosin stability and function. Epistasis analyses reveal each myosin independently contributes to relocalization, and myosins and Unc45 work in the same pathway as Smc5/6 for relocalization (Fig. 3b, Extended Data Fig. 5d–e). Similar to Arp2/3 RNAi, myosin or Unc45 RNAi does not affect early repair steps (Mu2/Mdc1, ATRIP, Smc6, Nse2 focus formation, or Rad51 suppression inside the domain) (Extended Data Figs. 5f,g, 6a), suggesting that myosins act after resection and Smc5/6 recruitment. Myosins, and not other early repair components, co-immunoprecipitate with Smc5/6 in response to IR (Fig. 3c, Extended Data Fig. 6b,c), consistent with a direct interaction between Smc5/6 and myosins for relocalization.
Myosins and Unc45 are enriched at heterochromatic DSBs before relocalization (Fig. 3d and Extended Data Fig. 6e–f), consistent with a specific role in heterochromatin repair. Similarly to Arp2/3, myosin recruitment to DSBs relies on Mre11 and HP1a, suggesting a coordinated activity of Mre11 and HP1a for myosin targeting to heterochromatic DSBs (Fig. 3e). Additionally, recruitment of Unc45 to DSBs, but not myosin recruitment, relies on Smc5/6 and SUMOylation (Fig. 3e). This suggests Unc45 recruitment to a pre-assembled relocalization machinery (i.e., Arp2/3, F-actin, and myosins) is the trigger for myosin activation and repair site relocalization downstream from Smc5/6.
MyoVheadless or MyoVtail mutations affect the ability of MyoV to walk along actin filaments, suggesting this as the key myosin function for relocalization. Similarly, cell treatment with the myosin inhibitor 2,3-butanedione monoxide (BDM) or the MyoV inhibitor MyoVin, which interfere with myosin movement along actin filaments, results in reversible relocalization defects (Extended Data Fig. 6g,h). BDM and MyoVin also affect relocalization in mouse cells (Extended Data Fig. 6i). We conclude that Smc5/6 interacts with nuclear myosins and recruits Unc45 to heterochromatic DSBs, and this enables relocalization of repair sites through myosins’ ability to walk along actin filaments.
Actin nucleators and myosins drive directed motions of heterochromatic DSBs
Nuclear actin might generate filamentous structures for myosin-mediated trafficking of heterochromatic repair sites, resulting in directed motions22. Alternatively, F-actin and myosin could contribute to relocalization indirectly, such as by local chromatin changes enabling DNA ‘looping’ from the domain23 followed by Brownian motion and nuclear periphery anchoring. To distinguish Brownian vs directed motions, we investigated the biophysical properties of the motion via Mu2/Mdc1 focus tracking and mean-square displacement (MSD)24 analyses in Drosophila cells.
MSD curves for heterochromatic foci have a higher plateau than those for euchromatic foci (Fig. 4a, Extended Data Fig. 7a), reflecting a larger space explored24. This is particularly striking considering that undamaged sites (centromeres) embedded in heterochromatin, like centromeres, display little mobility (Fig. 4a, GFP-CenpA). Heterochromatic foci reaching the nuclear periphery during the 1 h time-lapse (~20% of all heterochromatic foci) are the most dynamic, while foci that stay inside the heterochromatin domain, move to the domain periphery, or persist at the domain periphery, show limited mobility (Fig. 4b, Extended Data Fig. 7b). In agreement with a specialized role for nuclear periphery in heterochromatin repair7, euchromatic DSBs rarely move to the nuclear periphery (Extended Data Fig. 7c).
Figure 4. Actin nucleators and myosins drive directed motions of heterochromatic DSBs.

(a) MSD analysis of heterochromatic (HC) or euchromatic (EU) GFP-Mu2/Mdc1 foci (i.e., formed inside or outside the HP1a domain, respectively) after IR, or GFP-CenpA foci before (−) and after (+) IR. P<0.0001 for all comparisons, n>19 tracks/category. (b) MSD analysis of HC Mu2 foci from a that: remain inside HP1a domain; move to domain periphery; remain at domain periphery; or move to nuclear periphery. P<0.0001 for all comparisons vs ‘to nuclear periphery’ category. n=41 foci (c) LDM analysis of foci that reach nuclear periphery in b. Duration and length of LDMs (black lines) are adjusted relative to a ‘pseudo-trajectory’ defined by average time foci are in each nuclear space. n=28 foci. (d) 3D reconstructions in Imaris and MSD analyses of GFP-Mu2/Mdc1 foci that leave the heterochromatin domain (mCh-HP1a) and reach the nuclear periphery, or euchromatic foci, after indicated RNAi depletions. P<0.0001 vs Ctrl, n≥28 HC and n≥19 EU foci/RNAi. (e) Quantification of LDM durations of all heterochromatic foci in d. ****P<0.0001 vs Ctrl, n≥30 cells/RNAi. Scale bars: 1 μm. Error bars: mean ± SEM in a–e. P values calculated with extra sum-of-squares F-test, nonlinear regression for curve fitting for a,b,d and two-tailed Mann-Whitney test in e.
While MSD curves reaching a plateau typically describe Brownian motions in a confined space24, similar plots also result from averaging MSD curves of asynchronous foci each characterized by different types of motions22,24. Indeed, application of a computational method24 unmasked long-lasting directed motions (LDMs) associated with nearly all heterochromatic foci, mostly occurring between the heterochromatin domain periphery and the nuclear periphery (Fig. 4c, Extended Data Fig. 7d–g). LDMs last 24 ± 2.4 min, consistent with the average duration of nuclear actin filaments, and are characterized by an average speed of 0.148 ± 0.01 μm/min, in agreement with previously described F-actin and myosin-driven chromatin motions18,25.
Arp2/3 or Unc45 depletion significantly affects the dynamics of heterochromatic foci by reducing: the plateau of MSD curves, the number of foci leaving the domain, and LDM frequency (Fig. 4d,e; Extended Data Fig. 7b). Conversely, these depletions did not affect focus dynamics in euchromatin (Fig. 4d,e; Extended Data Fig. 7g), highlighting a specialized role for Arp2/3 and Unc45 in the directed motion of heterochromatic DSBs. Intriguingly, Arp2/3 (but not Unc45) mediates focus clustering in euchromatin and not in heterochromatin (Extended Data Fig. 7h), revealing that Arp2/3 plays distinct functions in the two domains and suggesting that focus clustering does not require extensive dynamics in Drosophila cells. The role of Arp2/3 and actin polymerization in focus clustering is conserved in human cells26. We conclude that nuclear actin filaments enable the myosin-dependent directed motion of heterochromatic repair sites to the nuclear periphery.
Nuclear F-actin and myosins promote heterochromatin integrity
These studies uncovered the role of nuclear F-actin and myosins in relocalizing heterochromatic DSBs, suggesting the importance of these components in heterochromatin repair. We directly tested this by determining the biological consequences of inactivating nuclear actin polymerization or myosins. Defective heterochromatin repair results in persistent γH2Av foci associated with the heterochromatin domain 20 h after IR in fly cells7 and 16–24 h after IR in mouse cells27, i.e. at time points when repair is largely completed in euchromatin7,27. Similar defects occur after disruption of homologous pairing (Slmb RNAi) or sister chromatid cohesion (Rad21+Slmb RNAi) in Drosophila (Extended Data Fig. 8a–c), consistent with the importance of both homologous templates for heterochromatin repair10. Persistent foci occur after RNAi depletion of Arp2/3, myosins, and Unc45, or nuclear expression of a non-polymerizable form of actin in fly cells, or Arp3 RNAi in mouse cells (Fig. 5a–c, Extended Data Fig. 8d,e). Those depletions also impair fly cell survival after IR (Fig. 5c)7. We conclude that Arp2/3, nuclear F-actin, and myosins are critical for timely progression of heterochromatin repair.
Figure 5. Nuclear F-Actin and myosins promote heterochromatin integrity.

(a) IF and quantification of Kc cells fixed 20 h after IR show γH2Av foci associated (+) with H3K9me2 after indicated RNAi or expression of actin forms. ****P<0.0001, n>65 cells/RNAi and n>220 cells/actin-expressing line. (b) As in a except NIH3T3 G2 cells stained for γH2AX and PH3. ****P<0.0001, ***P=0.0008, n ≥20 cells/RNAi. (c) IR sensitivity of Kc cells after indicated RNAi or expression of actin forms. Rad51 RNAi: positive control7. P<0.0001 vs Ctrl RNAi or Act-WT, n>1324 cells/RNAi/dose. (d) IF and quantification of micronuclei (arrow) in cells stained for H3K9me2 and nuclear periphery (Nup62), after indicated RNAi or expression of actin forms and IR. ***P<0.0009, n>311 cells/RNAi; ****P<0.0001, n >340 cells/actin expressing line. +/−: micronuclei with/without H3K9me2 signals. (e) As in d, except NIH3T3 cells stained for H3K9me3. ****P<0.0001 vs Ctrl; n>1450 cells/RNAi. (f) FISH and quantification of larval karyotypes stained for indicated satellites show chromosome abnormalities in mutants or RNAi depleted flies vs controls w1118 or ActGAL4/+. Arrows: chromosome fusions. Dashed circle: arm loss. ****P<0.0001, n>36 karyotypes/genotype. Scale bars: 1 μm in a,d; 5 μm in b,e,f. Error bars: mean ± SEM in a(RNAi),b,f or ± SD of at least three independent experiments in a(actin),c–e. P values calculated with two-tailed Mann-Whitney test in a,b,d(RNAi); unpaired t-test with Welch’s correction in d(actin),e,f; extra sum-of-squares F-test, nonlinear regression for curve-fitting in c. (g) Heterochromatin relocalization pathway model: DSBs are resected inside the heterochromatin domain; Mre11 and HP1a promote the loading of Arp2/3 and nuclear myosins to DSBs; Arp2/3 activation by Scar and Wash induce formation of actin filaments reaching nuclear periphery; Unc45 recruitment by Smc5/6 activates nuclear myosins to ‘walk’ along filaments, thus relocalizing DSBs to nuclear pores or INMPs5,7,8; HR continues while filaments disassemble. Relocalization prevents ectopic recombination by isolating damaged sites and their homologous templates (grey lines) from undamaged heterochromatic repeats before strand invasion.
Inactivation of myosins or actin polymerization triggers the formation of IR-induced heterochromatic micronuclei in fly and mouse cells (Fig. 5d,e, Extended Data Fig 8f,g), and genome instability in larval neuroblasts (Fig. 4f; Extended Data Fig 8h,i). Abnormal karyotypes are likely caused by defective repair of spontaneous DSBs during larval development. These include aneuploidies, chromosome fusions, and changes in the number of satellites (Fig. 5f); most rearrangements involve the heterochromatic 4th and Y chromosomes, or pericentromeric regions, as expected for defective heterochromatin repair7 (Extended Data Fig. 8i). We conclude that Arp2/3-dependent nuclear actin polymerization and myosins are critical for heterochromatin repair and stability in Drosophila cells and tissues, and in mouse cells.
Discussion
This study revealed a striking role of F-actin and myosins in the directed motions of heterochromatic DSBs to the nuclear periphery. We visualize for the first time by live imaging the formation of IR-induced nuclear actin filaments and the movement of repair sites along them. Filaments form at repair sites, reach the nuclear periphery, and disassemble after relocalization. We also identify a specialized network of proteins coordinating heterochromatin dynamics and nuclear actin filament formation in concert with Smc5/6, including: Arp2/3; the Arp2/3 activators Scar and Wash; Myo1A, Myo1B and MyoV nuclear myosins; and the Myosin activator Unc45. Arp2/3 and myosins are targeted to heterochromatic DSBs by Mre11 and the heterochromatin component HP1a. Unc45 recruitment also requires Smc5/6 and SUMO E3-ligases, suggesting Unc45 as a trigger for the myosin-dependent movement of heterochromatic DSBs along actin filaments downstream from Smc5/6. This pathway appears conserved in mouse cells, and its deregulation results in heterochromatin repair defects and instability. These results support a model where DSBs in heterochromatin induce the formation of nuclear actin filaments connecting repair sites to the nuclear periphery. Smc5/6-associated myosins traveling along these ‘highways for repair’ enable the directed movement of repair sites to the nuclear periphery for ‘safe’ progression of HR repair (Fig. 5g).
Nuclear repositioning of repair sites has been observed in different contexts1,2, including DSBs in rDNA28,29, damaged telomeric and subtelomeric sequences30–34, collapsed replication forks35,36, persistent DSBs30,35,37–39, and homology search40,41. Cytoplasmic microtubules contribute to some of these dynamics via the trans-nuclear membrane LINC complex39,42. However, nuclear structures responsible for those movements have remained largely unknown, and Brownian motions are thought to account for most of these dynamics23.
Directed motions might be especially needed to leave the heterochromatin domain, given the compact nature of this domain and its potential resistance to releasing repair sites. Accordingly, Arp2/3 and myosins affect directed motions in heterochromatin and not in euchromatin. Interestingly, Arp2/3-dependent nuclear actin filaments form loose branches, distinct from the dense cytoplasmic network mediating cell movement. This likely reflects specialized Arp2/3 regulation and F-actin remodeling17 in the nucleus for the directed motion of repair sites. Remarkably, these studies identify nuclear F-actin and myosins as critical components for heterochromatin repair and genome stability in multicellular eukaryotes.
METHODS
Cell culture and generation of stable cell lines
Kc167 (Kc) cells were used for most experiments and were maintained as logarithmically growing cultures in Schneider’s medium (Sigma) + FBS (Gemini). Kc cells were authenticated by the Drosophila Genomic Resource Center (DGRC) and no mycoplasma contamination was detected43. Stable lines were obtained by cotransfecting the plasmid of interest with pCoHygro (Invitrogen) or pCoPuro (Addgene) and selecting in the presence of 100 μg/ml hygromycin B (Invitrogen) or 2 mg/ml puromycin (Enzo Life Sciences). Transfection was performed with DOTAP (Roche) or Cellfectin (Life Technologies), according to manufacturers’ protocols. Mouse NIH3T3 cells (kind gift from V. Longo) were maintained at 30–80% confluency in DMEM medium (Corning) + 10% CBS (Denver Serum Company).
IR Treatments
Cell cultures were exposed to IR using a 160 kV X-ray source (X-RAD iR-160, Precision X-Ray). For Drosophila cells, we mostly use a range of Gy at which the damage response increases linearly with dose (1.7–20 Gy), and corresponds to nearly sublethal doses for controls7. A dose of 5 Gy was used for most experiments, unless otherwise indicated. Treatments with this dose do not affect nuclear-cytoplasmic transport, which was evaluated by measuring the ratio between nuclear and cytoplasmic GFP-tagged Myo1A, Myo1B, MyoV, Arp2, Arp3 and Unc45. The estimated number of DSBs induced by 5 Gy in Drosophila cells is ~7.5 DSBs in G1 and ~14 DSBs in G27. In kinetic analyses of fixed cells, time 0 (Unt) corresponds to cells fixed without exposure to IR. In time-lapse experiments, time 0 (Unt) corresponds to cells imaged 5–10 min before IR treatment unless otherwise specified. Mouse cells were exposed to 1 Gy, similar to previous studies27,44,45.
Plasmids
pCopia-GFP-Mu2/Mdc1, pCopia-mCherry-HP1a, pCopia-GFP-Smc5, pCopia-GFP-Nse2, pCopia-GFP-ATRIP, and pCopia-GFP-CenpA plasmids were previously described in5,7,46. All other GFP- and FHA (3×FLAG-3×HA)-tagged proteins were generated by insertion of PCR-amplified coding regions of cDNAs from DGRC or other sources. Clone numbers from DGRC were: Arp2 (LD18955), Arp3 (LD35711), Myo1A (SD01662), Myo1B (FI19407) and Unc45 (SD10334). Arp2/3 has been previously identified as a major actin nucleating factor in Drosophila47. Functions of Unc45 in myosin regulation have been described48. Actin WT and the two mutant constructs S14C and R62D were PCR amplified from pEF-FLAG-NLS-βActin-WT, S14C or R62D49 (kind gift from G. Posern). Detailed information is available on the DGRC web site (http://dgrc.cgb.indiana.edu). MyoV was generated by PCR amplification of clone FI23904 (Ref. 2014.4.22, kind gift from S. Celniker) and the Actin Chromobody by PCR amplification of Actin-Chromobody-TagGFP2-NLS plasmid50. MyoVheadless and MyoVtail mutants were generated by PCR amplifications of truncated versions of MyoV, according to51. All PCR products were cloned into pCopia-LAP-EGFP vectors52, or pCopia-3XFLAG-StrepII-3×HA vectors5. pCopia-mCh-Mu2/Mdc1 was generated by swapping the Mu2 gene from pCopia-GFP-Mu2 into a pCopia-mCh vector5.
dsRNA synthesis and sequences
siRNAs for RNAi depletions in Drosophila cultured cells were prepared with the MEGAscript T7 Kit (Applied Biosystems). dsRNA derived from the brown (bw) gene was used as control in all experiments. Amplicons and RNAi conditions for bw, Smc5, Smc6, and Rad51 were previously described5. Amplicons used for all other dsRNAs were: DRSC25363/DRSC34284 for Myo1A, DRSC27633 for Myo1B, DRSC07603/DRSC40837 for MyoV, DRSC15449 for Unc45, DRSC31428/DRSC19332 for Arp2, DRSC29666/DRSC31430 for Arp3, DRSC03426/BKN22532 for Scar, DRSC37426/DRSC06302 for Wash, DRSC26170/DRSC15032 for Wasp, DRSC03519/DRSC24127 for Dia, DRSC03619/DRSC24744/DRSC40746 for Spire and DRSC40055 for Ipo9, DRSC17056/DRSC32610 for Slmb, DRSC20839/DRSC38781 for Rad21. Sequences can be found on the DRSC website (http://flyrnai.org). dsRNA for Whamy RNAi was prepared with the oligos: 5′GAATTAATACGACTCACTATAGGGAGACGGAATACGGATTATCCGCC and 5′ GAATTAATACGACTCACTATAGGGAGAGATGCAGAAATCACAGCCCAA. Wash, Scar, Whamy, and Wasp are previously-described Wiskott-Aldrich Syndrome protein family in fly cells53. When more than one amplicon is indicated, we combined equal amounts of each dsRNA for better efficiency of protein depletion. For mouse cells, RNAi experiments were conducted using SMARTpool ON-TARGETplus ARP3 siRNA (Dharmacon) and a corresponding non-targeting RNAi control.
RNAi depletion
For Drosophila cells, dsRNAs were transfected with DOTAP (Roche) following manufacturer’s instructions and depletion was done for 5 days before performing experiments, except Slmb and Rad21 RNAi, which was done for 4 days. We did not detect significant effects of RNAi depletions shown in this paper on cell cycle progression by FACS, or on the heterochromatin domain by live imaging of GFP-HP1a-expressing cells. Additionally, RNAi depletion of Arp2/3, Myosins or Unc45 did not affect nuclear pore structure by Nup62 IF staining. Notably, studies in flies revealed that loss of Wash affects HP1a association with heterochromatin54. However, depletion of Wash in Kc cells did not affect the mCh-HP1a signal, indicating that the heterochromatin domain is still largely intact in the RNAi conditions used in Fig. 1c and Extended Data Fig. 1b,e. This supports the model that Wash works downstream from HP1a in the relocalization of heterochromatic DSBs. We also note here that all kinetics resulting from RNAi depletion must be compared to cells treated with control dsRNAs, since the γH2Av peak shifts from 10 min after IR in non-RNAi experiments (e.g., Fig. 1f) to 30 min after IR in RNAi controls5 (e.g., Fig. 1a). RNAi depletion efficiencies for Smc5/6, Nse2/Cerv, Nse2/Qjt, dPIAS and Rad51 were previously validated5,7,55. Mouse cells were transfected using Lipofectamine RNAiMAX reagent (Thermo Fisher Scientific) for 2 days before the experiments.
qPCR
qPCR analysis of RNAi depletions in Drosophila cultured cells was performed as described in7. Changes in transcript levels were normalized to Ebony or CG12493 or Actin5c mRNA. Primer sequences were: CGCACGGAAATTATCAAGGT and GTCTGCTCGTCATCCTCCTC for Ipo9; ATCATTCACTCCAATTTTACT and AGTAATCTGGTTATTAGTGGAA for Whamy, GGCTGAAGAAGAGCAACCAC and TCACCTTGCGCAACTGACCAG for Spire; GCGAGTTGTTCCCCAAGATA and GGAGACAATCTTGCCGTCAT for Slmb. For qPCR analysis of RNAi depletions in flies, total RNA was isolated from 5–10 larvae by Trizol extraction and treated with DNase I to remove genomic DNA. RNA was used to generate single-stranded cDNA using oligo dT priming and Superscript Reverse Transcriptase III (Invitrogen). Primer sequences were: CTTAACGAAGACCTGAATGAGGC and CGACAGTGTCTCCTGTTCCAG for Lamin; GAATGCCCCACATTTGTTCGC and ACCGGAAATTAGGATGCAGGT for Myo1A; AGAGCGAAGAAGCCTTCATCG and GCTTGTAGGGATTCACGGAGAT for Myo1B. Transcripts were quantified with iQ SYBR Green Supermix (Bio-Rad) according to manufacturer’s instruction. Changes in transcript levels were normalized to Lamin mRNA. In both cultured cells and flies, each qPCR was repeated at least three times, and graphs show the average level of depletion relative to control RNAi. qPCR analysis of Arp3 RNAi depletion in mouse cells was done using two independent primer sets for both ARP3 and the control gene GAPDH, and the qPCR was repeated twice for each set. Averaged values were normalized for each GAPDH qPCR and averaged between each other. The primer sequences used for this analysis were: AAGAATGAAGCGGACAGGAC and AGTTGGTGATTCCTAGCGTG (set 1) AATCACCAACTTCCCCATCC and AAACCTTCTCACACAGCCTC (set 2) for Arp3; CTTTGTCAAGCTCATTTCCTGG and TCTTGCTCAGTGTCCTTGC (set 1) and GCCTTCCGTGTTCCTACC and CCTCAGTGTAGCCCAAGATG (set 2) for GAPDH.
Immunofluorescence (IF) and quantifications in fixed samples
Chromosome preparation and FISH protocols used in Fig. 5f and Extended Data Fig. 8b,i were previously described56. AACAC, AATAT, and 359bp probes were designed as previously described56 and were purchased from Integrated DNA Technologies. Probe sequences are: 5′-6-FAM-(AACAC)7 and 5′-Cy3-TTTTCCAAATTTCGGTCATCAAATAATCAT, 5′-Cy5-(AATAT)6 respectively. IF without Triton extraction was used for most experiments as previously described5. IF staining of myosins, Unc45, Arp2/3 complex subunits, FLAG-actin-NLS (WT, R62D and S14C in Fig. 2d), and F-actCB-GFP-NLS in Extended Data Fig. 3d,4d–e, was preceded by a triton extraction step as described in7. Notably, these Triton extraction treatments partially destabilize actin filaments57–59. Detection of nuclear actin filaments with phalloidin in Extended Data Fig. 3c was done by fixing cells for 10 min at 37°C in pre-warmed, freshly made, fixation buffer (4% PFA, 0.5% Triton-X100, 2mM ATP, 0.004% NaAz, 1mM Na3VO4, 1mM NaF, 1mM PMSF, protease inhibitor tablets (Roche), Phalloidin 1:500; modified from60,61). Imaging and image processing for fixed cells was described previously5, and similar approaches were used for imaging chromosome preparations from tissues. Quantification of repair foci relative to DAPI-bright in Drosophila cells was done as described in7. Quantification of repair foci relative to H3K9me2 (Fig. 5a) in Drosophila cells was done as described in7. Quantification of repair foci relative to DAPI-bright in mouse cells was done on volume reconstructions and only cells in G2 were used; detection of G2 cells was based on PH3 staining as described in44. For quantification of actin filaments in Extended Data Fig. 3c, filaments were imaged with 0.2 μm intervals between the Z-stacks, and images were deconvolved 20× with a conservative protocol. Filaments inside the nuclei were identified using DAPI staining as a reference. Figures shown are max intensity projections of a few Z stacks across the DAPI-bright domain (Figs. 1a,b; 5a,b; Extended Data Fig. 1a), individual Z stacks or max intensity projections of two Z stacks (Figs. 1f,2d, 3d; Extended Data Figs. 1d–e, 3c, 3e, 4b, 4d, 6e, 8i), or all Z stacks across the nucleus (Figs. 2a, 5d–e, Extended Data Figs. 2a, 2c, 3b, 3f, 4a, 5f–g, 7a, 8b).
Western blotting
Protein extraction and Western blotting to validate RNAi depletions were conducted as previously described7.
Immunoprecipitation (Ip)
Ip experiments were performed as described in1. For Myo1a Ip, 3×10⁸ Kc cells expressing GFP-Myo1a, or Kc cells as a control, were pelleted and snap-frozen before and 25 min after exposure to 20 Gy IR. Pellets were incubated in lysis buffer A (50 mM Hepes, 10 mM KCl, 2 mM MgCl2, 20% glycerol, 1 mM PMSF, 20 mM NaF, 20mM glycerol-2-phosphate, 1mM benzamidine, 0.5% NP-40, 25 mM NEM, 150 mM NaOAc, 250 mM NaCl, and protease inhibitors (Complete, Roche), and digested with 1 μl Benzonase (EMD Millipore) at 4 °C for 30 min. Pellets were centrifuged and soluble lysates collected. Pellets were resuspended in buffer A and extracted with 300 mM sodium acetate for 1 h at 4 °C. Next, the supernatant was pooled with the soluble lysate. Samples were incubated for 3 h at 4 °C with Protein G-coupled Sepharose beads and 5 μl of goat anti-GFP antibody. Beads were washed 5× with wash buffer A (50 mM Hepes, 10 mM KCl, 2 mM MgCl2, 20% glycerol, 0.5% NP-40, 350 mM NaCl, 150 mM NaOAc, and 25 mM NEM) and heated in loading buffer for 3 min at 95 °C for SDS-PAGE.
For Myo1B, Arp3, and Nse2 Ip, 3×10⁸ Kc cells expressing GFP-Myo1, GFP-Arp3 or FHA-Nse2 were pelleted and snap-frozen before and 25 min after exposure to 20 Gy IR. Pellets were incubated with lysis buffer C (50 mM Hepes/KOH pH 7.5, 140 mM NaCl, 1 mM EDTA, 1% Triton X-100, 0.05% Na-deoxycholate, 25 mM NEM) for 30 min at 4 °C. Lysates were pelleted and the supernatant was incubated with 1 μl of Benzonase (EMD Millipore) for 30 min at 4 °C. Next, supernatants were incubated with FLAG-M2 agarose beads (Sigma) for Nse2 or Protein G-coupled Sepharose beads and 5 μl of goat anti-GFP antibody for Myo1B for 4 h at 4 °C. Samples were washed once with lysis buffer C and four times with wash buffer B (100 mM Tris pH 8.0, 250 mM NaCl, 1 mM EDTA, 0.5% NP-40, 0.1% Na- deoxycholate), before heating them in loading buffer for 3 min at 95 °C for SDS-PAGE. As a control for Myo1B Ip, GFP-Myo1B cells were incubated in Sepharose beads without antibodies. Kc cells were used as control for Nse2 and Arp3 Ip.
For MyoV Ip, 3×10⁸ Kc cells expressing FHA-MyoV, or cells without the FHA-MoV plasmid as a control, were used. Cells were pelleted and snap-frozen before and 25 min after exposure to 20 Gy IR. Pellets were incubated in lysis buffer B (50 mM Tris, 150 mM NaCl, 2 mM EDTA, 10% glycerol, 0.2% Nonidet P-40, protease inhibitors (Complete, Roche), 1 mM PMSF, and 25 mM NEM) for 30 min at 4 °C. Lysates were centrifuged and the supernatant was incubated with FLAG-M2 agarose beads (Sigma). Samples were incubated with beads at 4 °C for 5 h. Beads were washed 5 times with lysis buffer B and heated in loading buffer for 3 min at 95 °C for SDS-PAGE.
Cytoplasmic and nuclear actin fractionation
Adapted from62. All steps carried out in ice or in cold room. 1 ml 10×7 cells/ml were collected, washed once with ice-cold phosphate-buffered saline (PBS), and pelleted by centrifugation at 800×g for 10 min. Cell pellets were placed at −80°C for 1 h. Pellets were resuspended gently on ice in 200 μl of buffer P1 (HEPES 10 mM, EGTA 0.1mM, DTT 1 mM, complete protease inhibitors (Roche)). After addition of Triton X-100 (final concentration 0.5%), samples were vortexed on the highest setting for 10 sec followed by centrifugation at 4 °C 10000g for 10 min. 150 μl of the supernatant was collected for the cytoplasmic fraction. The remaining supernatant was removed and discarded. The cytoplasmic fraction was centrifuged at 16000g, transferred to a new tube, and placed at −80 °C. The nuclear pellet was gently resuspended in 1 ml of buffer P1 followed by centrifugation at 4 °C 10000g for 10 min. The supernatant of the nuclear fraction was discarded and nuclear pellet lysed in 50 μl of buffer P2 (20 mM HEPES, 25%glycerol, 400 mM NaCl, 1 mM EGTA, 1 mM DTT, complete protease inhibitors (Roche)) by vortexing for 90 min at 4 °C. Nuclear extract was clarified by centrifugation at 20000g for 10 min. The samples were stored at −80 °C until SDS-page and Western blotting were performed. 25 μg of total protein extract (nuclear or cytoplasmic) was loaded on an SDS-PAGE gel, per lane.
Chemical treatments
Myosin and actin polymerization inhibitors were added to the cultures before IR treatments. In Drosophila cells, treatment conditions were: 2 mM or 10 mM BDM (Sigma, Ref. 63) for 5 min; 200 or 400 μM MyoVin-1 (Calbiochem, Ref. 64) for 2 h; 100 μM or 400 μM CK666 (Sigma, Ref. 65) for 60 min; 4 μM or 8 μM Latrunculin B (Enzo Life Sciences) for 20 min. Stocks of MyoVin-1 (100 mM), CK666 (100 mg/ml) and Latrunculin B (10 mM) were prepared in DMSO and those of BDM were diluted in water. For mouse cells, treatment conditions were: 7.5 mM BDM for 20 min; 200 μM MyoVin-1 for 60 min; 400 μM CK666 for 60 min; 8 μM Latrunculin B for 20 min. All stocks were prepared in DMSO. For controls, DMSO was added to the media to yield final concentrations equivalent to samples treated with chemicals. For the ‘release’ time points of Extended Data Figs 1f–g and 6h, cells were washed 3× after incubation with each chemical, and incubated at 27 °C for 1 h before IR. Cells were fixed 60 min after IR. Notably, the doses of LatB treatments used affect nuclear actin polymerization in addition to cytoplasmic actin66.
Cell Imaging and Processing in Time-Lapse Experiments
For MSD analyses, cells stably expressing GFP-Mu2 and mCherry-HP1a were imaged before and after IR as described in24. Briefly, imaging after IR was done every 40 sec for 60 min starting from 3–5 min after IR as in7,24. Ten Z-stacks at 0.8 μm distance were imaged for 0.005 ms for GFP, and 0.015 ms for mCherry. The Coolsnap HQ2 camera was set at 2×2 binning for maximizing the light collected while minimizing light exposure and cell phototoxicity. Accordingly, these imaging conditions did not induce DSB formation or affect cell division (Extended Data Fig. 7a). All videos were corrected to compensate for modest photobleaching effects using softWorks (Applied Precision/GE Healthcare). Next, for each nucleus, 6–12 of the most stationary and spatially distant foci were tracked with Imaris (Bitplane) and used as reference for registering the nucleus as described in24. Foci were tracked in 3D using a semi-automated method and manually corrected to ensure optimal connections between timepoints24. IR dose was reduced from 5 Gy to 1.7 Gy, to reduce the average number of Mu2 foci/nucleus and the frequencies of ambiguous tracks. Focus positional data were extracted in Excel and analyzed in Matlab (MathWorks) using a customized script24. MSDs were calculated as described in24. Positional data were also analyzed using a customized script in R Studio to detect LDMs24. Briefly, the script derives MSD curves for time intervals Δt>10 and increasing starting time points for each trajectory, and identifies time intervals characterized by MSD graphs with increasing slopes22,60. LDMs shown in Fig 5c and Extended Data Fig. 7b correspond to the largest contiguous time interval containing MSDs of increasing slope for each focus. The ability of the script to correctly detect directed motions was confirmed by independent MSD analysis of the positional data within the time intervals of the LDMs, as shown in Extended Data Fig. 7e. For live imaging of nuclear actin filaments, a stable cell line expressing the F-actCB-GFP-NLS was exposed to 5 Gy IR. The same field of cells was imaged before and every 5 min after IR, with 60-min time intervals and 10 Z-stacks at 0.8 μm distance, starting from 3–12 min after IR. 3D volume reconstructions and movie generation were done in Imaris (Bitplane). Quantification of filament length and angles of actin branches was done using the ‘Measurement Tool’ in Imaris.
IR sensitivity assay
IR sensitivity assay for RNAi depletion experiments (Fig. 5c, left) was done as previously described7. Quantification of IR sensitivity for Act-WT or Act-R62D expressing cells (Fig. 5c, right) was done using a trypan blue exclusion test for cell viability described in67.
Micronucleus assays
Micronucleus assay in Kc cells was done as previously described7. Micronuclei in NIH3T3 cells were quantified 72 h after IR based on the DAPI and H3K9me3 staining.
Antibodies
Primary antibodies used in Drosophila cells were: anti-actin (1:1000, Abcam, ab8224); anti-γH2Av (1:1000, Rockland, 600-401-914); anti-Rad51 (1:1000, gift from J. Kadonaga); anti-HA (1:1000, Abcam, ab9134 for Western blot; 1:1000; Covance, 16B12 for IF); anti-FLAG (1:1000, Sigma, F1804); anti-GFP (1:1000, Invitrogen, AP11122 for Western blot; 1:1000 Aves Lab, GFP-1020 for IF; Rockland, 600-101-215 for Ip); anti-H3K9me2 (1:750, Wako Chemicals, MABI0307, 302-32369); anti-Wash (1:10, Developmental Studies Hybridoma Bank, P3H3); anti-Wasp (1:5, Developmental Studies Hybridoma Bank, P5E1); anti-Scar (1:10, Developmental Studies Hybridoma Bank, P1C1); anti-Whamy (1:10, Developmental Studies Hybridoma Bank, P1D1); Phalloidin (1:500 AlexaFluor488, Invitrogen, A12379), anti-Arpc3A (1:10000, for Wb kind gift from L. Cooley), anti-Arpc3B (1:500, for IF, kind gift from L. Cooley), anti-MyoV (head) (1:500, kind gift from A. Eprussi), anti-Unc45 (1:500, kind gift from S. Bernstein), anti-Smc5 (SDI, 1:800)5; anti-Smc6; (SDI, 1:800)5; anti-Nup62 (1:1000, kind gift from H. Ohkura); anti-Rad50 (1:1000, kind gift from M. Gatti), anti-dPIAS (1:1000, kind gift from G. Karpen), anti-TopBP1 (1:1000, kind gift from M. Michael68); anti-HP1a (1:500, Developmental Studies Hybridoma Bank, C1A9). Primary antibodies used in NIH3T3 cells were: anti-H3K9me3 (1:2000, Abcam, ab8898); anti pH3S10 (1:4000, Milipore, 06-570); anti-gamma H2A.X (phospho-S139; 1:2000, Abcam, ab26350). Secondary antibodies for IF were from Life Technologies and Jackson Immunoresearch. Those used for Western blot were from Pierce and Santa Cruz Biotech. Antibodies were previously validated5,7,44 or validated by comparing signals in the presence of the protein of interest with signals after RNAi depletions or IF signals in the absence of primary antibodies.
Fly stocks and crosses
Drosophila were maintained on standard media at 25°C, which was prepared as in69. Stocks were obtained from BDSC (http://fly.bio.indiana.edu) or VDRC (www.vdrc.at) and are: Myo1A (BDSC #33971) y[1] sc[*] v[1]; P{y[+t7.7] v[+t1.8]=TRiP.HMS00298}attP2; Myo1B (BDSC #41689) y[1] v[1]; P{y[+t7.7] v[+t1.8]=TRiP.HMS02253}attP2; Arp3 (BDSC #32921) y[1] sc[*] v[1]; P{y[+t7.7] v[+t1.8]=TRiP.HMS00711}attP2; Wash (BDSC #62866) y[1] sc[*] v[1]; P{y[+t7.7] v[+t1.8]=TRiP.HMC05339}attP40; Scar (BDSC #31126) y[1]v[1];P{y[+t7.7] v[+t1.8]=TRiP.JF01599}attP2; Act5c-GAL4 (BDSC #4414) y[1] w[*]; P{w[+mC]=Act5C-GAL4}25FO1/CyO, y[+]; Unc45 (VDRC #v108868) P{KK101311}VIE-260B. Smc5 trans-heterozygous mutant in Fig. 4d and S4c was smc57/19 previously described in7. The WT control was w1118. To obtain 3rd instar larvae for karyotyping of neuroblast metaphase spread, RNAi lines were crossed to the Act5c-GAL4 line (rebalanced with CyO-GFP) and non-GFP larvae were picked for karyotyping as described in7.
Statistical analysis
All statistical analyses were performed using Prism6 (Graphpad Software).
Code availability
Custom scripts written in Matlab and R for image analysis are published24.
Data availability
All relevant data are included in the main manuscript and figures, Extended Data and Supplementary Information. Additional data are available from the corresponding author upon reasonable request.
Extended Data
Extended Data Figure 1. Actin nucleators mediate relocalization of heterochromatic DSBs.

(a) IF and quantification of Kc cells fixed 60 min after IR show γH2Av foci in DAPI-bright (dashed circle) or total focus number, after treatment with LatB (+) or control (Ctrl, −). ****P<0.0001, ***P=0.0008 vs Ctrl, n>300 cells/treatment. (b) Wb or qPCR analyses show RNAi depletion efficiencies for indicated proteins in Kc cells. Actin or a background band (*) are used as loading controls. (c) Quantification of total γH2Av foci for Fig. 1a. (d) IF and quantification show γH2Av foci at the nuclear periphery (Lamin), or total focus number, 60 min after IR after indicated RNAi depletions in Kc cells. Only middle Z-stacks were used for quantifications. ****P<0.0001, n>200 cells/RNAi. (e) As in a except cells treated with CK666. ****P<0.0001, *P=0.00293, n>300 cells/treatment. (f–g) Quantification of γH2Av foci in DAPI-bright or total focus number, after 60 min treatment with and release from LatB or CK666. ****P<0.0001, n>200 cells per condition. (h) Quantification of Kc cells fixed 60 min after IR shows γH2Av foci in DAPI-bright, or total focus number, after RNAi depletions of actin nucleators Spire70 or the formin Dia71. ****P<0.0001 vs Ctrl, n>300 cells/RNAi. (i) qPCR analysis shows Arp3 RNAi depletion efficiency in NIH3T3 cells. (j) Quantification of total γH2Av foci for Fig. 1b. (k) Quantification in NIH3T3 G2 cells treated with indicated chemicals, and fixed 60 min after IR, shows γH2AX foci in DAPI-bright or total focus number ****P<0.0001 vs Ctrl, n>37 cells/treatment. (l) Quantification of total γH2Av foci for Fig. 1c. Scale bars: 1 μm. Error bars: mean ± SEM in c, and ± SD of at least three independent experiments in a,d–h,k,l. P values calculated with two-tailed Mann-Whitney test.
Extended Data Figure 2. Actin nucleators mediate relocalization of heterochromatic DSBs.

(a) Images at 10 min after IR (+) and quantification before (−) and after IR of Mu2 and ATRIP foci in cells expressing GFP-Mu2 or GFP-ATRIP and mCh-HP1a, after indicated RNAi depletions. n>48 cells for ATRIP; n>21 cells for Mu2. (b) Quantification of Rad51 foci in cells fixed 60 min after IR and processed for IF with anti-Rad51 antibodies after indicated RNAi depletions, show the average number of foci relative to DAPI-bright or total foci. Smc5/6 RNAi results in abnormal formation of Rad51 foci in heterochromatin5,7,8, and is used as positive control. ****P<0.0001 vs Ctrl, unpaired t-test with Welch’s correction, n>300 cells/RNAi. (c) Images and quantifications of Smc6 and Nse2 colocalizing with the mCh-HP1a domain before (−) IR and forming foci before and 15 min after (+) IR in cells expressing GFP-Smc6 or GFP-Nse2 and mCh-HP1a after indicated RNAi depletions. n=35 cells for Nse2 and n≥23 cells for Smc6. (d) Quantification at 30 min after IR of γH2Av foci colocalizing with FHA-tagged Arp2 or with Arpc3B after indicated RNAi depletions. ****P<0.0001, two-tailed Mann-Whitney test, n≥31 cells/RNAi. (e) IF of γH2Av foci colocalizing with Arpc3B and quantification of total focus number for Fig. 1f. (f) Quantification at indicated times after IR of the percentage of γH2Av foci colocalizing with FHA-tagged Arp2 relative to H3K9me3. n=30. (g) Quantification of total foci for Fig. 1d. (h) Western blot analyses show RNAi depletion efficiency for Arpc3B. Tubulin is used as loading control. (i) qPCR analysis shows Mre11 RNAi efficiency. Scale bars: 1 μm. Error bars: mean ± SEM in a,c,d,f, and ± SD of at least three independent experiments in b,g.
Extended Data Figure 3. Nuclear F-actin is required for relocalization.

(a) Western blot showing nuclear vs cytoplasmic actin levels in cells stably transfected with F-actCB-GFP-NLS. HP1a and Tubulin were used as loading controls and to check for purity of the fractions. Consistent with previous studies, expression of F-actCB-GFP-NLS does not alter nuclear actin levels50,72 providing a non-invasive method for nuclear actin detection in vivo. (b) Frames of time-lapse experiments (Fig. 2a, Suppl. Videos 1,2) of cells expressing F-actCB-GFP-NLS and mCh-HP1a signals treated (+) or non-treated (−) with IR. Time points are from IR (+IR Video) or the start of imaging (-IR Video). (c) IF and quantification of cells stained with phalloidin show the formation of canonical nuclear actin filaments73 (highlighted in red) at indicated timepoints after IR. ****P<0.0001 for 10 min vs 0 min or 30 min, two-tailed Mann-Whitney test, n≥39 cells/timepoint. Error bars: SD of at least three independent experiments. (d) IF and staining for GFP, phalloidin, and γH2Av, of cells expressing F-actCB-GFP-NLS, show examples of actin filaments coated with damage foci in the absence (−) of triton extraction (TE), and actin puncta colocalizing with γH2Av foci after (+) TE. Zoomed details highlight colocalizations. (e) IF and staining for HA and phalloidin (Phall) of cells expressing FHA-Arp2 show enrichments of Arp2 along nuclear actin filaments, including at the base of actin branches (arrowheads). (f) Measurement of F-actin branch angles in response to IR, in time lapse experiments of cells expressing F-actCB-GFP-NLS. n=54 angles. (g) Quantification of the average duration of IR-induced actin filaments in time lapse experiments of cells expressing F-actCB-GFP-NLS. n=162 actin filaments. Dashed red vertical lines indicates median values in f,g. Scale bars: 1 μm.
Extended Data Figure 4. Nuclear F-actin is required for relocalization.

(a) Frames from time-lapse experiment show cells expressing F-actCB-GFP-NLS and Mu2-mCh (Fig. 2c, Suppl. Video 3) with an example of a Mu2 focus moving along an actin filament. Time indicates min from beginning of focus movement along the filament. Mu2 focus tracking (bottom panels) was done in Imaris. (b) Selected frames from cells expressing F-actCB-GFP-NLS and Mu2-mCh or HP1a-mCh show examples of filament directionality at indicated time points after IR, i.e., filaments emerging from the heterochromatin domain periphery (top), from repair foci (middle) or from the nuclear periphery (bottom). Percentages indicate the frequency at which each behavior is observed. n≥44 filaments. (c) Quantification of the length of actin filaments departing from the heterochromatin domain relative to the average distance between the HP1a domain periphery and the nuclear periphery. n>140 filaments. Dashed red vertical line: median value. (d) IF and staining for FLAG (actin-WT), phalloidin (Phall), and γH2Av, of cells expressing FLAG-actin-WT-NLS, show examples of actin signals in cells processed by triton extraction before fixation, 10 min after IR. Zoomed details highlight colocalizations. Scale bar: 1 μm. (e) IF of cells expressing FLAG+NLS-tagged versions of actin R62D and S14C as indicated shows colocalizations with γH2Av foci. Quantification shows total γH2Av foci for Fig. 2d. (f) Quantification of γH2Av foci colocalizing with FLAG-actin-WT-NLS 10 min after IR, or total number of foci, after indicated RNAi depletions. ****P<0.0001, n≥14 cells and n≥158 foci/RNAi. (g) qPCR analysis shows Ipo9 RNAi depletion efficiency. Ipo9 depletion specifically blocks the transfer of actin monomers to the nucleus14,74. (h) Quantification of total γH2Av foci for Fig. 2e. (i) Quantification of cells fixed 60 min after IR shows γH2Av foci at the nuclear periphery (lamin), or total focus number, after indicated RNAi depletions. Only the middle Z-stack was used for quantifications. ****P<0.0001, n≥215 cells/experiment. Error bars: SEM in e,h and SD of three independent experiments in f,i. P values calculated with two-tailed Mann-Whitney test.
Extended Data Figure 5. Relocalization relies on nuclear myosins.

(a) Western blot analysis of cells expressing FHA-tagged components as indicated, shows RNAi depletion efficiency for indicated proteins. (*) Background bands used as loading controls. (b) Quantification shows total γH2Av foci for Fig. 3a. (c) Quantification of cells fixed 60 min after IR shows γH2Av foci at the nuclear periphery (lamin), or total focus number, after indicated RNAi depletions. ****P<0.0001 vs Ctrl, Only the middle Z-stack was used for quantifications. Ctrl RNAi as in Extended Data Fig. 1d. (d) Quantification of cells fixed 60 min after IR shows γH2Av foci in DAPI-bright, or total focus number, after indicated RNAi depletions. ****P<0.0001, ***P=0.003, **P≤0.0022, *P=0.0402 vs Ctrl, n>200 cells/RNAi. (e) Quantification of total γH2Av foci for Fig. 3b. (f) Images at 10 min after IR and quantification at 0 and 10 min after IR of Mu2, and ATRIP foci in cells expressing GFP-Mu2 or GFP-ATRIP and mCh-HP1a, after indicated RNAi depletions. n≥75 cells for ATRIP and n≥17 cells for Mu2. (g) Images and quantifications of Smc6 and Nse2 colocalizing with the mCh-HP1a domain before (−) IR and forming foci at 0 and 15 min after (+) IR in cells expressing GFP-Smc6 or GFP-Nse2 and mCh-HP1a after indicated RNAi depletions. n≥31 cells for Nse2 and n≥21 cells for Smc6. In f,g, Myo indicates RNAi depletion of Myo1A+Myo1B+MyoV. Scale bars: 1 μm. Error bars: mean ± SEM in b,f,g and ± SD of at least three independent experiments in c,d,e. All P values calculated with two-tailed Mann-Whitney test except one-tailed Mann-Whitney test was used for Myo1B RNAi in d.
Extended Data Figure 6. Relocalization relies on nuclear myosins.

(a) Quantification of Rad51 foci in cells fixed 60 min after IR after indicated RNAi depletions show the average number of foci relative to DAPI-bright or total foci. ****P=0.0001 vs Ctrl, n>300 cells/RNAi. Ctrl and Smc5/6 RNAi as in Extended Data Fig. 2b. (b) Western blot validation of the antibodies used in c and in Fig. 3c shows loss of Rad50, TopBP1 and dPIAS bands after corresponding RNAi depletions. (c) Wb analysis of the same Ip shown in Fig. 3c probed with antibodies for dPIAS or TopBP1, with actin as the loading control. (d) Quantification at 30 min after IR of γH2Av foci colocalizing with FHA-Myo1A, GFP-Myo1B, MyoV, or Unc45 after indicated RNAi depletions. ****P<0.0001, n>21/cells/RNAi. (e) IF at 10 min after IR and quantification at indicated time points after IR of γH2Av foci colocalizing with FHA-Myo1A, GFP-Myo1B, MyoV, or Unc45. (f) Quantification at indicated times after IR of the percentage of γH2Av+FHA-Myo1A, GFP-Myo1B, MyoV, or Unc45, relative to H3K9me3. n=30 cells/experiment/timepoint. (g) Quantification of Kc cells fixed 60 min after IR shows γH2Av foci in DAPI-bright, or total focus number, after treatment with BDM, MyoVin or controls. ****P<0.0001, **P<0.008, n≥300 cells/treatment. (h) Quantification of γH2Av foci in DAPI-bright or total foci, after 60 min treatment with and release from BDM or MyoVin. ****P<0.0001, n≥200 cells/treatment. (i) As in g, except NIH3T3 cells were used and γH2AX foci were quantified. Ctrl RNAi as Extended Data Fig. 1k. ****P<0.0001, n≥37 cells and n≥2524 foci/treatment. Error bars: mean ± SEM in d–f and ± SD of at least three independent experiments in a,g–i. All P values calculated with two-tailed Mann-Whitney test.
Extended Data Figure 7. Actin nucleators and myosin drive directed motions of heterochromatic DSBs.

(a) Selected images and quantification at indicated time points of Mu2 foci in GFP-Mdc1/Mu2 and mCh-HP1a expressing cells show no effect of the imaging conditions used in Fig. 4 on the ability of cells to divide or the total number of repair foci. Only representative time points are shown. n=82 cells. Scale bar: 1 μm. (b) Left and middle: Quantification and violin plot display of the frequency of heterochromatic (HC) Mu2/Mdc1 foci moving relative to the HP1a domain during the time lapse experiments shown in Fig. 5a,b, after indicated RNAi depletions. White box: median. Red line: mean. Vertical black lines: values that occur 95% and 50% of the time. ‘Dynamic HC foci’ include foci moving from inside the HP1a domain to: the nuclear periphery (imNP); outside the HP1a domain (imo); or the periphery of the HP1a domain (imp). ‘Static HC foci’ include foci remaining inside (isi) or at the periphery of the HP1a domain (psp) throughout the 1 h timecourse. Colors reflect the categories analyzed in Fig. 5b. Right: Quantification of the average number of Mu2 foci from Fig. 5a,b and b, after indicated RNAi depletions. *P<0.05,**P<0.006, ***P=0.0003; ****P<0.0001, two-tailed Mann-Whitney test, n≥217 foci/RNAi. (c) Quantification of the percentage of heterochromatic (HC) and euchromatic (EU) Mu2/Mdc1 foci moving to the nuclear periphery in time lapse experiments from Fig. 5a,b. ****P<0.0003; two-tailed Mann-Whitney test, n=162 foci. (d) LDM analysis of Mu2/Mdc1 foci that reach the nuclear periphery from Fig. 4b. Each colored horizontal bar represents a focus and its duration in each nuclear compartment, as indicated. The black segments under each bar are LDMs for each focus. (e) MSD curves generated from the positional data corresponding to the time points that contain LDMs in d. Longer (left) and shorter (right) LDMs are presented as independent graphs for clarity. (f) Quantification of the analysis shown in Fig. 4d and d shows the average duration of directed motions (LDMs) or non-directed motions in the nuclear positions defined in d. P<0.0001 for directed motions in 3 vs 1,2,4, unpaired t-test. (g) Quantification of LDM durations for euchromatic foci shown in Fig. 4d, after indicated RNAi depletions. (h) Quantification and violin plot of Mu2 focus clustering events in time-lapse experiments for Fig. 4d. Graphical display as in b. An example of clustering is highlighted in Suppl. Video 4. ***P=0.0003, two-tailed Mann-Whitney test, n≥20 cells/RNAi. Error bars: SEM.
Extended Data Figure 8. Actin nucleators and myosins promote heterochromatin repair and stability.

(a) Wb and qPCR analysis show RNAi depletion efficiency for Rad21 and Slmb as indicated. Tubulin is a loading control for Wb. (b) FISH analysis and quantification show the effect of indicated RNAi on the number of cells with ≥3 AACAC or 359bp satellites, reflecting disruption of homologous and/or sister pairing75. **P=0.0472; ****P<0.0001 two-tailed Mann-Whitney test, n>120 cells/RNAi. (c) Quantification shows γH2Av foci associated (+) or non-associated (−) with H3K9me2 signals 20 h after IR following indicated RNAi depletions. **P<0.02; ****P<0.0001 two-tailed Mann-Whitney test, n>400 cells/RNAi. (d) Quantification of Kc cells from the experiment in Fig. 5a shows γH2Av foci non-associated (−) with H3K9me2 signals 20 h after IR and following indicated RNAi depletions. (e) Quantification of NIH3T3 cells from the experiment in Fig. 5b shows γH2AX foci non-associated (−) with DAPI-bright signals 16 and 24 h after IR and following indicated RNAi depletions. (f) Quantification of micronuclei in non-irradiated Kc cells from Fig. 4d. (g) Quantification of micronuclei in non-irradiated NIH3T3 cells from Fig. 4e. (h) qPCR and Wb analyses show RNAi depletion efficiency of indicated components in 3rd instar larvae for i and Fig. 5f. (i) Images and quantification of chromosome aberrations in karyotypes from Fig. 5f. Images show extra satellites (arrows), chromosome fusions (arrowhead), chromosome arm losses (dashed circles). The diagram of Drosophila chromosomes indicates the position of the main satellites detected by FISH. Aneuploidies and chromosome fusions from Fig. 5f were further categorized to highlight rearrangements involving centromeric regions or chromosomes that are predominantly heterochromatic (4th or Y). Error bars: mean ± SEM in a(RNAi),b,f and ± SD of at least three independent experiments in a(actin),c–e.
Supplementary Material
Acknowledgments
Work supported by USC Gold Family and Research Enhancement Fellowships to T.R.; R01GM117376, Mallinckrodt Foundation Award, and NSF Career 1751197 to I.C.; We thank S. Keagy, O. Aparicio and the Chiolo Lab for insightful comments; O. Aparicio, M. Michael and V. Longo for reagents and cells; B. Mellone, G. Posern and S. Celniker for plasmids; L. Cooley, A. Eprussi, H. Ohkura, M. Gatti, S. Bernstein, G. Karpen for antibodies; F. Cuturale, C. Artesano, S. Fraser and the TIC for imaging and analyses; H. Hopp, B. Spatola, P. Palagani and A. Holcom for experimental help; BDSC (P40OD018537), VDRC, DGRC (P40OD010949) for flies and plasmids.
Footnotes
Author Contributions
C.P.C. and C.D. performed most experiments; T.R. performed experiments for Fig.1e,3a,c–e and Extended Data Fig. 1f,g,2i,4i,6h,8c; G.Z. for Fig.1b,3a,5b,e and Extended Data Fig. 1k,2h,5a,6i; L.D. for Extended Data Fig. 3e,8h and complementary studies; X.L. for Fig. 5f; V.Y.K for Fig. 3a and Extended Data Fig. 1g,6b,h,8a–c,f; N.A. for Fig. 2a,d; E.L. for Fig. 5c; and A.R. for Extended Data Fig. 8h. I.C. conceived and supervised the project, contributed to experiments, and wrote the manuscript.
The authors declare no competing interests.
References
- 1.Amaral N, Ryu T, Li X, Chiolo I. Nuclear Dynamics of Heterochromatin Repair. Trends Genet. 2017;33:86–100. doi: 10.1016/j.tig.2016.12.004. [DOI] [PMC free article] [PubMed] [Google Scholar]
- 2.Caridi PC, Delabaere L, Zapotoczny G, Chiolo I. And yet, it moves: nuclear and chromatin dynamics of a heterochromatic double-strand break. Philos Trans R Soc Lond B Biol Sci. 2017;372 doi: 10.1098/rstb.2016.0291. [DOI] [PMC free article] [PubMed] [Google Scholar]
- 3.Ho JW, et al. Comparative analysis of metazoan chromatin organization. Nature. 2014;512:449–452. doi: 10.1038/nature13415. nature13415 [pii] [DOI] [PMC free article] [PubMed] [Google Scholar]
- 4.Hoskins RA, et al. The Release 6 reference sequence of the Drosophila melanogaster genome. Genome Res. 2015;25:445–458. doi: 10.1101/gr.185579.114. [DOI] [PMC free article] [PubMed] [Google Scholar]
- 5.Chiolo I, et al. Double-strand breaks in heterochromatin move outside of a dynamic HP1a domain to complete recombinational repair. Cell. 2011;144:732–744. doi: 10.1016/j.cell.2011.02.012. [DOI] [PMC free article] [PubMed] [Google Scholar]
- 6.Chiolo I, Tang J, Georgescu W, Costes SV. Nuclear dynamics of radiation-induced foci in euchromatin and heterochromatin. Mutat Res. 2013;750:56–66. doi: 10.1016/j.mrfmmm.2013.08.001. [DOI] [PMC free article] [PubMed] [Google Scholar]
- 7.Ryu T, et al. Heterochromatic breaks move to the nuclear periphery to continue recombinational repair. Nat Cell Biol. 2015;17:1401–1411. doi: 10.1038/ncb3258. [DOI] [PMC free article] [PubMed] [Google Scholar]
- 8.Ryu T, Bonner MR, Chiolo I. Cervantes and Quijote protect heterochromatin from aberrant recombination and lead the way to the nuclear periphery. Nucleus. 2016;7:485–497. doi: 10.1080/19491034.2016.1239683. [DOI] [PMC free article] [PubMed] [Google Scholar]
- 9.Li Q, et al. The three-dimensional genome organization of Drosophila melanogaster through data integration. Genome Biol. 2017;18:145. doi: 10.1186/s13059-017-1264-5. [DOI] [PMC free article] [PubMed] [Google Scholar]
- 10.Janssen A, et al. A single double-strand break system reveals repair dynamics and mechanisms in heterochromatin and euchromatin. Genes Dev. 2016;30:1645–1657. doi: 10.1101/gad.283028.116. [DOI] [PMC free article] [PubMed] [Google Scholar]
- 11.Jakob B, et al. DNA double-strand breaks in heterochromatin elicit fast repair protein recruitment, histone H2AX phosphorylation and relocation to euchromatin. Nucleic Acids Res. 2011;39:6489–6499. doi: 10.1093/nar/gkr230. gkr230 [pii] [DOI] [PMC free article] [PubMed] [Google Scholar]
- 12.Tsouroula K, et al. Temporal and Spatial Uncoupling of DNA Double Strand Break Repair Pathways within Mammalian Heterochromatin. Mol Cell. 2016;63:293–305. doi: 10.1016/j.molcel.2016.06.002. [DOI] [PubMed] [Google Scholar]
- 13.Andrin C, et al. A requirement for polymerized actin in DNA double-strand break repair. Nucleus. 2012;3:384–395. doi: 10.4161/nucl.21055. [DOI] [PubMed] [Google Scholar]
- 14.Belin BJ, Lee T, Mullins RD. DNA damage induces nuclear actin filament assembly by Formin −2 and Spire-(1/2) that promotes efficient DNA repair. [corrected] Elife. 2015;4:e07735. doi: 10.7554/eLife.07735. [DOI] [PMC free article] [PubMed] [Google Scholar]
- 15.Sun MH, et al. DNA Double-Strand Breaks Induce the Nuclear Actin Filaments Formation in Cumulus-Enclosed Oocytes but Not in Denuded Oocytes. PLoS ONE. 2017;12:e0170308. doi: 10.1371/journal.pone.0170308. [DOI] [PMC free article] [PubMed] [Google Scholar]
- 16.Svitkina TM, Borisy GG. Arp2/3 complex and actin depolymerizing factor/cofilin in dendritic organization and treadmilling of actin filament array in lamellipodia. J Cell Biol. 1999;145:1009–1026. doi: 10.1083/jcb.145.5.1009. [DOI] [PMC free article] [PubMed] [Google Scholar]
- 17.Goley ED, Welch MD. The ARP2/3 complex: an actin nucleator comes of age. Nat Rev Mol Cell Biol. 2006;7:713–726. doi: 10.1038/nrm2026. [DOI] [PubMed] [Google Scholar]
- 18.Chuang C-H, et al. Long-range directional movement of an interphase chromosome site. Curr Biol. 2006;16:825–831. doi: 10.1016/j.cub.2006.03.059. [DOI] [PubMed] [Google Scholar]
- 19.Dundr M, et al. Actin-dependent intranuclear repositioning of an active gene locus in vivo. J Cell Biol. 2007;179:1095–1103. doi: 10.1083/jcb.200710058. [DOI] [PMC free article] [PubMed] [Google Scholar]
- 20.Mehta IS, Amira M, Harvey AJ, Bridger JM. Rapid chromosome territory relocation by nuclear motor activity in response to serum removal in primary human fibroblasts. Genome Biol. 2010;11:R5. doi: 10.1186/gb-2010-11-1-r5. gb-2010-11-1-r5 [pii] [DOI] [PMC free article] [PubMed] [Google Scholar]
- 21.Roberts KL, Baines JD. Actin in herpesvirus infection. Viruses. 2011;3:336–346. doi: 10.3390/v3040336. [DOI] [PMC free article] [PubMed] [Google Scholar]
- 22.Hatakeyama H, Nakahata Y, Yarimizu H, Kanzaki M. Live-cell single-molecule labeling and analysis of myosin motors with quantum dots. Mol Biol Cell. 2017;28:173–181. doi: 10.1091/mbc.E16-06-0413. [DOI] [PMC free article] [PubMed] [Google Scholar]
- 23.Amitai A, Seeber A, Gasser SM, Holcman D. Visualization of Chromatin Decompaction and Break Site Extrusion as Predicted by Statistical Polymer Modeling of Single-Locus Trajectories. Cell Rep. 2017;18:1200–1214. doi: 10.1016/j.celrep.2017.01.018. [DOI] [PubMed] [Google Scholar]
- 24.Caridi CP, et al. Quantitative Methods to Investigate the 4D Dynamics of Heterochromatic Repair Sites in Drosophila Cells. Methods Enzymol. 2018;601:359–389. doi: 10.1016/bs.mie.2017.11.033. [DOI] [PMC free article] [PubMed] [Google Scholar]
- 25.Li H, Guo F, Rubinstein B, Li R. Actin-driven chromosomal motility leads to symmetry breaking in mammalian meiotic oocytes. Nat Cell Biol. 2008;10:1301–1308. doi: 10.1038/ncb1788. [DOI] [PubMed] [Google Scholar]
- 26.Schrank BR, et al. Nuclear Arp2/3 drives DNA break clustering for homology-directed repair. Nature. 2018 doi: 10.1038/s41586-018-0237-5. this issue. [DOI] [PMC free article] [PubMed] [Google Scholar]
- 27.Goodarzi AA, et al. ATM signaling facilitates repair of DNA double-strand breaks associated with heterochromatin. Mol Cell. 2008;31:167–177. doi: 10.1016/j.molcel.2008.05.017. S1097-2765(08)00395-X [pii] [DOI] [PubMed] [Google Scholar]
- 28.Torres-Rosell J, et al. The Smc5-Smc6 complex and SUMO modification of Rad52 regulates recombinational repair at the ribosomal gene locus. Nat Cell Biol. 2007;9:923–931. doi: 10.1038/ncb1619. [DOI] [PubMed] [Google Scholar]
- 29.van Sluis M, McStay B. A localized nucleolar DNA damage response facilitates recruitment of the homology-directed repair machinery independent of cell cycle stage. Genes Dev. 2015;29:1151–1163. doi: 10.1101/gad.260703.115. [DOI] [PMC free article] [PubMed] [Google Scholar]
- 30.Therizols P, et al. Telomere tethering at the nuclear periphery is essential for efficient DNA double strand break repair in subtelomeric region. J Cell Biol. 2006;172:189–199. doi: 10.1083/jcb.200505159. [DOI] [PMC free article] [PubMed] [Google Scholar]
- 31.Khadaroo B, et al. The DNA damage response at eroded telomeres and tethering to the nuclear pore complex. Nat Cell Biol. 2009;11:980–987. doi: 10.1038/ncb1910. [DOI] [PubMed] [Google Scholar]
- 32.Cho NW, Dilley RL, Lampson MA, Greenberg RA. Interchromosomal homology searches drive directional ALT telomere movement and synapsis. Cell. 2014;159:108–121. doi: 10.1016/j.cell.2014.08.030. [DOI] [PMC free article] [PubMed] [Google Scholar]
- 33.Chung DK, et al. Perinuclear tethers license telomeric DSBs for a broad kinesin- and NPC-dependent DNA repair process. Nat Commun. 2015;6:7742. doi: 10.1038/ncomms8742. [DOI] [PubMed] [Google Scholar]
- 34.Churikov D, et al. SUMO-Dependent Relocalization of Eroded Telomeres to Nuclear Pore Complexes Controls Telomere Recombination. Cell Rep. 2016;15:1242–1253. doi: 10.1016/j.celrep.2016.04.008. [DOI] [PubMed] [Google Scholar]
- 35.Nagai S, et al. Functional targeting of DNA damage to a nuclear pore-associated SUMO-dependent ubiquitin ligase. Science. 2008;322:597–602. doi: 10.1126/science.1162790. [DOI] [PMC free article] [PubMed] [Google Scholar]
- 36.Su XA, Dion V, Gasser SM, Freudenreich CH. Regulation of recombination at yeast nuclear pores controls repair and triplet repeat stability. Genes Dev. 2015;29:1006–1017. doi: 10.1101/gad.256404.114. [DOI] [PMC free article] [PubMed] [Google Scholar]
- 37.Kalocsay M, Hiller NJ, Jentsch S. Chromosome-wide Rad51 spreading and SUMO-H2A.Z-dependent chromosome fixation in response to a persistent DNA double-strand break. Mol Cell. 2009;33:335–343. doi: 10.1016/j.molcel.2009.01.016. S1097-2765(09)00060-4 [pii] [DOI] [PubMed] [Google Scholar]
- 38.Oza P, Jaspersen SL, Miele A, Dekker J, Peterson CL. Mechanisms that regulate localization of a DNA double-strand break to the nuclear periphery. Genes Dev. 2009;23:912–927. doi: 10.1101/gad.1782209. [DOI] [PMC free article] [PubMed] [Google Scholar]
- 39.Swartz RK, Rodriguez EC, King MC. A role for nuclear envelope-bridging complexes in homology-directed repair. Mol Biol Cell. 2014;25:2461–2471. doi: 10.1091/mbc.E13-10-0569. [DOI] [PMC free article] [PubMed] [Google Scholar]
- 40.Dion V, Kalck V, Horigome C, Towbin BD, Gasser SM. Increased mobility of double-strand breaks requires Mec1, Rad9 and the homologous recombination machinery. Nat Cell Biol. 2012;14:502–509. doi: 10.1038/ncb2465. [DOI] [PubMed] [Google Scholar]
- 41.Mine-Hattab J, Rothstein R. Increased chromosome mobility facilitates homology search during recombination. Nat Cell Biol. 2012;14:510–517. doi: 10.1038/ncb2472. [DOI] [PubMed] [Google Scholar]
- 42.Lottersberger F, Karssemeijer RA, Dimitrova N, de Lange T. 53BP1 and the LINC Complex Promote Microtubule-Dependent DSB Mobility and DNA Repair. Cell. 2015;163:880–893. doi: 10.1016/j.cell.2015.09.057. [DOI] [PMC free article] [PubMed] [Google Scholar]
- 43.Cherbas L, Gong L. Cell lines. Methods. 2014;68:74–81. doi: 10.1016/j.ymeth.2014.01.006. [DOI] [PMC free article] [PubMed] [Google Scholar]
- 44.Goodarzi AA, Noon AT, Jeggo PA. The impact of heterochromatin on DSB repair. Biochem Soc Trans. 2009;37:569–576. doi: 10.1042/BST0370569. [DOI] [PubMed] [Google Scholar]
- 45.Noon AT, et al. 53BP1-dependent robust localized KAP-1 phosphorylation is essential for heterochromatic DNA double-strand break repair. Nat Cell Biol. 2010;12:177–184. doi: 10.1038/ncb2017. ncb2017 [pii] [DOI] [PubMed] [Google Scholar]
- 46.Erhardt S, et al. Genome-wide analysis reveals a cell cycle-dependent mechanism controlling centromere propagation. J Cell Biol. 2008;183:805–818. doi: 10.1083/jcb.200806038. [DOI] [PMC free article] [PubMed] [Google Scholar]
- 47.Hudson AM, Cooley L. A subset of dynamic actin rearrangements in Drosophila requires the Arp2/3 complex. J Cell Biol. 2002;156:677–687. doi: 10.1083/jcb.200109065. [DOI] [PMC free article] [PubMed] [Google Scholar]
- 48.Lee CF, Melkani GC, Bernstein SI. The UNC-45 myosin chaperone: from worms to flies to vertebrates. Int Rev Cell Mol Biol. 2014;313:103–144. doi: 10.1016/B978-0-12-800177-6.00004-9. [DOI] [PMC free article] [PubMed] [Google Scholar]
- 49.Kokai E, et al. Analysis of nuclear actin by overexpression of wild-type and actin mutant proteins. Histochem Cell Biol. 2014;141:123–135. doi: 10.1007/s00418-013-1151-4. [DOI] [PubMed] [Google Scholar]
- 50.Plessner M, Melak M, Chinchilla P, Baarlink C, Grosse R. Nuclear F-actin formation and reorganization upon cell spreading. J Biol Chem. 2015;290:11209–11216. doi: 10.1074/jbc.M114.627166. [DOI] [PMC free article] [PubMed] [Google Scholar]
- 51.Krauss J, Lopez de Quinto S, Nusslein-Volhard C, Ephrussi A. Myosin-V regulates oskar mRNA localization in the Drosophila oocyte. Curr Biol. 2009;19:1058–1063. doi: 10.1016/j.cub.2009.04.062. [DOI] [PubMed] [Google Scholar]
- 52.Cheeseman IM, Desai A. A combined approach for the localization and tandem affinity purification of protein complexes from metazoans. Sci STKE. 2005;2005:pl1. doi: 10.1126/stke.2662005pl1. [DOI] [PubMed] [Google Scholar]
- 53.Verboon JM, Sugumar B, Parkhurst SM. Wiskott-Aldrich syndrome proteins in the nucleus: aWASH with possibilities. Nucleus. 2015;6:349–359. doi: 10.1080/19491034.2015.1086051. [DOI] [PMC free article] [PubMed] [Google Scholar]
- 54.Verboon JM, et al. Wash interacts with lamin and affects global nuclear organization. Curr Biol. 2015;25:804–810. doi: 10.1016/j.cub.2015.01.052. [DOI] [PMC free article] [PubMed] [Google Scholar]
- 55.Ryu T, Bonner M, Chiolo I. Cervantes and Quijote protect heterochromatin from aberrant recombination and lead the way to the nuclear periphery. Nucleus. 2016 doi: 10.1080/19491034.2016.1239683. [DOI] [PMC free article] [PubMed] [Google Scholar]
- 56.Larracuente AM, Ferree PM. Simple method for fluorescence DNA in situ hybridization to squashed chromosomes. Journal of visualized experiments : JoVE. 2015:52288. doi: 10.3791/52288. [DOI] [PMC free article] [PubMed] [Google Scholar]
- 57.Small JV, Herzog M, Anderson K. Actin filament organization in the fish keratocyte lamellipodium. J Cell Biol. 1995;129:1275–1286. doi: 10.1083/jcb.129.5.1275. [DOI] [PMC free article] [PubMed] [Google Scholar]
- 58.Sawasdichai A, Chen HT, Abdul Hamid N, Jayaraman PS, Gaston K. In situ subcellular fractionation of adherent and non-adherent mammalian cells. Journal of visualized experiments : JoVE. 2010 doi: 10.3791/1958. [DOI] [PMC free article] [PubMed] [Google Scholar]
- 59.Whelan DR, Bell TD. Image artifacts in single molecule localization microscopy: why optimization of sample preparation protocols matters. Sci Rep. 2015;5:7924. doi: 10.1038/srep07924. [DOI] [PMC free article] [PubMed] [Google Scholar]
- 60.Pierobon P, et al. Velocity, processivity, and individual steps of single myosin V molecules in live cells. Biophys J. 2009;96:4268–4275. doi: 10.1016/j.bpj.2009.02.045. [DOI] [PMC free article] [PubMed] [Google Scholar]
- 61.Leyton Puig D, et al. Tips and tricks for artifact-free PFA-based fixation of the actin cytoskeleton and its regulatory proteins for single molecule localization super-resolution microscopy. 2016 [Google Scholar]
- 62.Baarlink C, Wang H, Grosse R. Nuclear actin network assembly by formins regulates the SRF coactivator MAL. Science. 2013;340:864–867. doi: 10.1126/science.1235038. science.1235038 [pii] [DOI] [PubMed] [Google Scholar]
- 63.Yarrow JC, Lechler T, Li R, Mitchison TJ. Rapid de-localization of actin leading edge components with BDM treatment. BMC Cell Biol. 2003;4:5. doi: 10.1186/1471-2121-4-5. [DOI] [PMC free article] [PubMed] [Google Scholar]
- 64.Islam K, et al. A myosin V inhibitor based on privileged chemical scaffolds. Angewandte Chemie. 2010;49:8484–8488. doi: 10.1002/anie.201004026. [DOI] [PMC free article] [PubMed] [Google Scholar]
- 65.Nolen BJ, et al. Characterization of two classes of small molecule inhibitors of Arp2/3 complex. Nature. 2009;460:1031–1034. doi: 10.1038/nature08231. [DOI] [PMC free article] [PubMed] [Google Scholar]
- 66.Belin BJ, Cimini BA, Blackburn EH, Mullins RD. Visualization of actin filaments and monomers in somatic cell nuclei. Mol Biol Cell. 2013;24:982–994. doi: 10.1091/mbc.E12-09-0685. [DOI] [PMC free article] [PubMed] [Google Scholar]
- 67.Strober W. Trypan Blue Exclusion Test of Cell Viability. Curr Protoc Immunol. 2015;111:A3B1–3. doi: 10.1002/0471142735.ima03bs111. [DOI] [PMC free article] [PubMed] [Google Scholar]
- 68.Van Hatten RA, et al. The Xenopus Xmus101 protein is required for the recruitment of Cdc45 to origins of DNA replication. J Cell Biol. 2002;159:541–547. doi: 10.1083/jcb.200207090. [DOI] [PMC free article] [PubMed] [Google Scholar]
- 69.Ren C, Webster P, Finkel SE, Tower J. Increased internal and external bacterial load during Drosophila aging without life-span trade-off. Cell Metab. 2007;6:144–152. doi: 10.1016/j.cmet.2007.06.006. [DOI] [PubMed] [Google Scholar]
- 70.Quinlan ME, Heuser JE, Kerkhoff E, Mullins RD. Drosophila Spire is an actin nucleation factor. Nature. 2005;433:382–388. doi: 10.1038/nature03241. [DOI] [PubMed] [Google Scholar]
- 71.Afshar K, Stuart B, Wasserman SA. Functional analysis of the Drosophila diaphanous FH protein in early embryonic development. Development. 2000;127:1887–1897. doi: 10.1242/dev.127.9.1887. [DOI] [PubMed] [Google Scholar]
- 72.Melak M, Plessner M, Grosse R. Actin visualization at a glance. J Cell Sci. 2017;130:525–530. doi: 10.1242/jcs.189068. [DOI] [PubMed] [Google Scholar]
- 73.Schoenenberger CA, et al. Conformation-specific antibodies reveal distinct actin structures in the nucleus and the cytoplasm. J Struct Biol. 2005;152:157–168. doi: 10.1016/j.jsb.2005.09.003. [DOI] [PubMed] [Google Scholar]
- 74.Dopie J, Skarp KP, Rajakyla EK, Tanhuanpaa K, Vartiainen MK. Active maintenance of nuclear actin by importin 9 supports transcription. Proc Natl Acad Sci U S A. 2012;109:E544–552. doi: 10.1073/pnas.1118880109. [DOI] [PMC free article] [PubMed] [Google Scholar]
- 75.Senaratne TN, Joyce EF, Nguyen SC, Wu CT. Investigating the Interplay between Sister Chromatid Cohesion and Homolog Pairing in Drosophila Nuclei. PLoS Genet. 2016;12:e1006169. doi: 10.1371/journal.pgen.1006169. [DOI] [PMC free article] [PubMed] [Google Scholar]
Associated Data
This section collects any data citations, data availability statements, or supplementary materials included in this article.
Supplementary Materials
Data Availability Statement
All relevant data are included in the main manuscript and figures, Extended Data and Supplementary Information. Additional data are available from the corresponding author upon reasonable request.