

After significant increases in livestock productivity, China now needs to improve efficiency and environmental performance.
Abstract
China’s livestock industry has experienced a vast transition during the last three decades, with profound effects on domestic and global food provision, resource use, nitrogen and phosphorus losses, and greenhouse gas (GHG) emissions. We provide a comprehensive analysis of the driving forces around this transition and its national and global consequences. The number of livestock units (LUs) tripled in China in less than 30 years, mainly through the growth of landless industrial livestock production systems and the increase in monogastric livestock (from 62 to 74% of total LUs). Changes were fueled through increases in demand as well as, supply of new breeds, new technology, and government support. Production of animal source protein increased 4.9 times, nitrogen use efficiency at herd level tripled, and average feed use and GHG emissions per gram protein produced decreased by a factor of 2 between 1980 and 2010. In the same period, animal feed imports have increased 49 times, total ammonia and GHG emissions to the atmosphere doubled, and nitrogen losses to watercourses tripled. As a consequence, China’s livestock transition has significant global impact. Forecasts for 2050, using the Shared Socio-economic Pathways scenarios, indicate major further changes in livestock production and impacts. On the basis of these possible trajectories, we suggest an alternative transition, which should be implemented by government, processing industries, consumers, and retailers. This new transition is targeted to increase production efficiency and environmental performance at system level, with coupling of crop-livestock production, whole chain manure management, and spatial planning as major components.
INTRODUCTION
Global food security and the sustainability of food production and consumption greatly depend on how to manage livestock production and animal source food consumption (1, 2). Livestock production systems use a great proportion of the world’s crucial resources, such as land and water (3–5), and are a main source of non-CO2 greenhouse gas (GHG) emissions and ammonia (NH3) in air, as well as of nitrogen (N) and phosphorus in surface waters (3, 6). Recent global assessments have provided a systematic quantification of the biomass use, feed conversion ratio, and productivity of different livestock production systems (7). The changes in livestock production, to more efficient monogastric animals and landless production systems (where animals are housed, feed is imported from other farms and countries, and manure is only partly returned to crop land), have contributed to significant resources and emission savings at the animal level. However, the overall impact of livestock production has greatly increased, through increased production level (2, 8, 9) and decoupling of feed and animal production on farm, with a greater reliance on purchased cereal and pulse-based feeds, the human edible feeds (10). Other studies have emphasized the large differences between farms in production efficiency and environmental performance and the scope for improvement (11).
The term “livestock revolution” was first coined by Delgado et al. (12) to describe the rapid changes in production structure and efficiency and to advise governments and industries to prepare for this continuing revolution. The market value of the global increases in meat and milk consumption between 1970 and 1990 was two times higher than the market value of the increase in cereal consumption through the better-known “Green Revolution,” more specifically wheat, rice, and corn. The livestock revolution or transition has been characterized as “demand-driven” and the green revolution as supply- or technology-driven, but there are regional differences (5), especially for countries with strong central governments.
China is an interesting case of the livestock revolution or transition. The average meat, milk, and egg consumption per capita increased by 3.9, 10, and 6.9 times, respectively, between 1980 and 2010, which was by far the largest increase during this period in the world (13). In the early nineties, China exceeded the United States and Europe as the world’s biggest livestock producer (10). Mean livestock productivity was low, and nutrient losses and GHG emissions per unit of animal protein produced were relatively high compared with those of the United States and European Union (EU) (11, 14, 15). Moreover, the demand for animal products is projected to increase further in China (16). As a result, livestock production will nearly double during the next few decades, which may have huge environmental and socioeconomic impacts, as recently discussed for China’s increasing demand for milk on the global dairy sector (17) and likewise on the pig production sector (18). These changes question the sustainability of future global livestock production.
The causes and effects of past changes in livestock production for different livestock categories and the perspectives of future livestock production in China are not clear. Livestock production changes are in response to phase shift changes in food demand, but, in addition, there are profound changes in livestock functions and categories, systems, actors, and impacts, that are poorly understood. Moreover, there is a need for insight into more sustainable livestock production pathways.
The overall aims of this study are to increase the understanding of the drivers and impacts of the livestock transition in China and to explore possible solutions to achieve sustainable livestock production in the near future. We selected a range of indicators, following the Driver-Pressure-State-Impact-Response framework (19), and used these indicators to comprehensively analyze changes and impacts in the three main livestock production systems: mixed, grazing, and landless/industrial systems. We focused on the period 1980–2010 because the most rapid changes took place in this period and because of data availability. Scenarios for 2050 explore the effects of a range of development pathways.
RESULTS
Characterization of the livestock transition
China’s livestock population almost tripled between 1980 and 2010, from 142 to 441 million livestock units (LUs). Functions of livestock also changed. Before the transition, livestock had multiple functions; it provided draft power, used household wastes, and provided manure to fertilize cropland, next to supplying animal protein. Between 1980 and 2010, supplying animal protein became much more important, facilitated by animal breeding programs and the increased availability of high-quality animal feed, increasingly through import (Fig. 1). The increased availability of subsidized synthetic fertilizers made animal manure redundant for fertilizing cropland, while small machines replaced animal draft power.
Fig. 1. Concept of the livestock transition in China between 1980 and 2010.
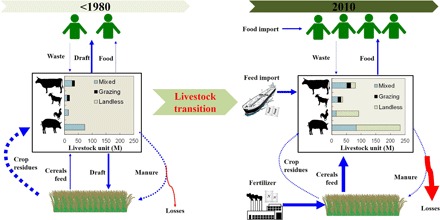
The left- and right-hand graphs show the crop production (bottom), livestock production (middle), and the consumption of food (top). Solid arrows represent nutrient inputs and outputs; the dotted arrows represent nutrient recycling flows. The thickness of the arrows reflects the size of the flows. Draft is the draft power provided by the draft animals.
Systems also changed. Traditional backyard and mixed crop-livestock systems were in part replaced by landless systems. In 1980, 2.5% of the total number of livestock (expressed in LUs) was in landless systems (3.6 million LUs in landless systems compared to the whole 142 million LUs) and, in 2010, it was 56% (247 million LUs in landless systems compared to the whole 441 million LUs) (Fig. 2A). At the same time, there was a shift from ruminant livestock (dairy cattle, other cattle, and sheep and goat) to monogastric livestock (pigs, layers, and broilers); the proportion of monogastric livestock to total LUs increased from 62% (88 million LUs in landless systems to the whole 142 million LUs) in 1980 to 74% (325 million LUs in landless systems compared to the whole 441 million LUs) in 2010 (Fig. 2B). Total animal protein production increased from 3.0 Tg in 1980 to 18 Tg in 2010. Landless systems produced 0.2 Tg of protein in 1980 and 12 Tg in 2010 (Fig. 2C). Meanwhile, the annual gross economic value of livestock production increased from 35 to 2100 billion Yuan, a 58-fold increase (Fig. 2E).
Fig. 2. Changes of livestock production structure, resources demand, and environmental performance from 1980 to 2010.
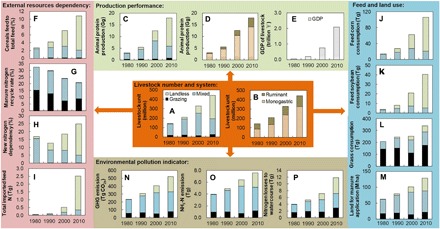
(A and B) Livestock number and systems (in LUs). (C to E) Production performance: animal protein production and economic value. Nutrient use and recycling: external resources dependency indicator expressed in cereals feed dependency (F), manure nitrogen recycle rate (G), new nitrogen dependency (H), and imported feed nitrogen (I). Feed and land use: corn (J), soybean (K), grass (L), and land requirement for manure application (M). Environmental pollution: GHG emissions (N), NH3-N emissions (O), and N losses to watercourses (P). Soybean includes soybean and soybean cakes. Feed is expressed as DM. Land for manure application is defined as the area of land needed to apply the manure at an application rate of 170 kg N ha−1 per year.
Driving forces of the livestock transition
Increases in human population, economic growth [changes in gross domestic production (GDP)], and urbanization are commonly seen as main driving forces of the livestock transition, although research and technology development and food chain actors (suppliers, processing industry, and retail) also played an important role. Changes in livestock number were positively related with changes in human population and degree of urbanization (Fig. 3). Livestock numbers were, however, not clearly related to GDP per capita; when the average GDP increased above 750 to 1500 US$ per capita, livestock number and percentage of monogastric livestock did not increase much further (Fig. 3B). The ratio of monogastric to total livestock number will likely not increase, as recent findings indicate that the consumption of beef, mutton, and dairy products is increasing much faster than the consumption of pork and poultry meat (table S1).
Fig. 3. Driving forces of livestock transition in China.
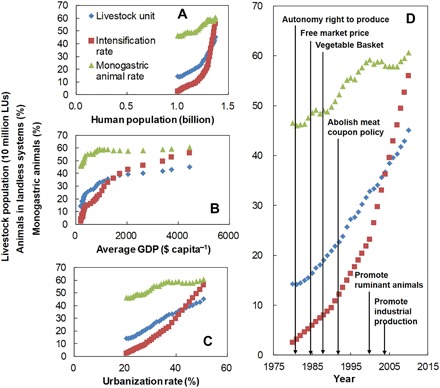
Relationships between livestock number (in LUs), the percentage of monogastric animals (in LUs) to total number of animals (in LUs), and the percentage of livestock in landless systems (percentage of landless) versus human population (A), average GDP value per capita (B), urbanization (C), and years of the introduction of governmental support policies (D). For details about the livestock production support policies, see table S2.
Governmental policies and subsidies also stimulated livestock production and transition, and three types of policies played a role (Fig. 3 and table S2). First is the liberation of markets and removal of barriers, such as the autonomy right to produce in 1980 and the free market price policy in 1985 (table S2). The supply of animal source food was controlled by the central government until the early 1990s. Meat coupons were essential for people to buy animal source food (table S2). Most people could only eat meat during the Spring Festival, when there was additional meat supply. In the early 1990s, meat coupons were abolished, and farmers were allowed and encouraged to set up new livestock production farms. Between 1980 and 2010, the consumption of animal products per capita increased 2-fold for pork and 13-fold for beef products (table S1). Second, economic incentives were provided for livestock producers, processing industry, and retail. The Vegetable Basket program of the government promoted industrial livestock farms around cities, and the Green Channeling policy facilitated the processing and transport of animal products (table S2). More than 10 billion Yuan of subsidies were directed annually to the livestock sector since 2007. Third, there were no or only loose environmental protection regulations (table S2). The few environmental regulations issued between 1980 and 2010 required only modest investments in manure storage, treatment, and application facilities. This lax environmental policy indirectly boosted large-scale and landless livestock production with poor manure management. These landless systems were economically much more profitable than the small traditional systems, which had relatively good manure management through a more coupled crop-livestock production system.
Pressures of livestock transition on resource use and the environment
The rapid increase in the number of livestock greatly enhanced the demand for feed and hence cropland. Consumption of corn (Zea mays) as livestock feed increased from 15 to 107 Tg dry matter (DM) between 1980 and 2010 (Fig. 2J), and that of soybean (Glycine max) increased from 4.0 to 41 Tg (including soybean cakes) (Fig. 2K). Most of these increases were driven by landless industrial systems; they were responsible for more than 80% of the consumption of feed corn and soybean in 2010, respectively (Fig. 2, J and K).
The increasing competition between plant source food production and livestock feed production affected cultivated areas and the prices of commodities. The demand for livestock feed increased beyond domestic feed production capacity, and increasing amounts of soybean, corn, and alfalfa (Medicago sativa; forage for cattle) had to be imported (fig. S2). Livestock production in China became dependent on feed import, while some traditional sources of animal feed (kitchen wastes, food losses, and crop residues) were left unused and have become a burden for the environment (see the changes in the thickness of the arrows between 1980 and 2010 in Fig. 1). Consumption of forages (grass) increased from 209 to 341 Tg (Fig. 2L). An increased land area was also needed for livestock manure disposal (Fig. 2M).
Changes in livestock production also increased emissions of GHG and NH3 to air and of N to water. Total GHG emissions from the livestock production chain increased from 233 to 520 Tg CO2e between 1980 and 2010. The contribution of landless systems to total GHG emissions increased from 1.5% in 1980 to 37% in 2010 (Fig. 2N). Total NH3-N emissions increased from 3.9 Tg in 1980 to 7.6 Tg in 2010. Most of the NH3 emission was from traditional, mixed production systems, but the contribution from landless systems increased rapidly (Fig. 2O). Losses of N and phosphorus to surface water increased more than proportionally with livestock numbers, because of the decoupling of crop and livestock production. An increasing shortage of land near livestock farms led in turn to increasing difficulty in recycling manure back to cropland. As a result, a significant fraction of the manure was discharged to evaporation ponds and other water bodies, instead of being recycled to cropland/grassland, and substituting for synthetic fertilizer. Discharge of manure N to water courses increased from 4.0 to 12 Tg between 1980 and 2010 and posed an increasing threat to water pollution. Landless systems became the biggest contributor (Fig. 2P). For the resources requirement and environmental performance of poultry, pig, cattle, sheep, and goat production, see fig. S3.
Impacts of the livestock transition on productivity, efficiency, and manure recycling
The productivity and resource use efficiency of the livestock production sector greatly improved per LU (Fig. 4A) and per unit of animal protein produced. Animal protein production increased from 3.0 Tg in 1980 to 18 Tg in 2010, much faster than the increases in the number of livestock (Fig. 2, A and B). The amount of feed needed to produce 1 g of edible animal protein decreased from 357 g in 1980 to 116 g in 2010. Similarly, the requirement for arable land decreased by about 46% per unit of edible animal protein produced (Fig. 4, A and B). Average nitrogen use efficiency (NUE) at herd level increased from 4.4% in 1980 to 11.5% in 2010. At the crop/feed-livestock system level, NUE increased from 9.1% in 1980 to 13.5% in 2010. A decrease of system-level NUE was observed between 2000 and 2010, likely because of the increased decoupling of crop and livestock production and the associated decrease in the utilization of manure nutrients (Fig. 4, F and G). Mean reactive nitrogen (Nr) losses from livestock production were decreased from 3.4 g in 1980 to 1.4 g (g animal protein−1). Mean GHG emission decreased from 99 g CO2e in 1980 to 36 g CO2e (g animal protein−1) in 2010 (Fig. 4, C and D).
Fig. 4. Changes of production efficiency in terms of animal protein produced.
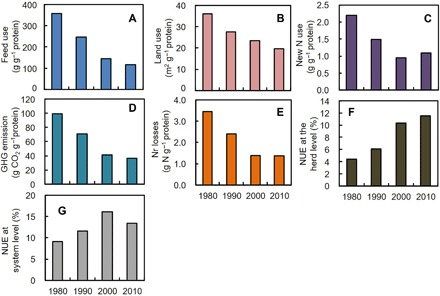
Changes in livestock production efficiency between 1980 and 2010: feed use per unit protein produced (A), land use per unit protein produced (B), new nitrogen (N) use per unit protein produced (C), GHG emission per unit protein produced (D), reactive N (Nr) losses per unit protein produced (E), NUE (nitrogen use efficiency) at herd level (F), and NUE at the whole system level (G). NUE was calculated at herd level, including all main livestock categories, breeding animals, and replacement animals (cattle, pig, poultry, and sheep and goat) and at system level, including the whole soil-feed-livestock production chain.
Through the decoupling of livestock production and crop production, and the limited areas of cropland around large livestock production farms, the manure N recycling rate (percentage of manure N returned to crop land) decreased from 33% in 1980 to 21% in 2010, a decrease of 36% (Fig. 2G). The remainder (79% in 2010) was emitted to air as NH3 and N2, dropped by livestock in grassland, dumped in landfill, and/or discharged to watercourses without much pretreatment. As a consequence, many rivers, lakes and coastal waters, and air have become polluted by manure nutrients, while the use of synthetic fertilizer N, in percentage of total N use, increased from 17 to 25% (Fig. 2H).
Further, animal production became unevenly distributed between regions (Fig. 5). In 1980, the livestock density was below 1 LU ha−1 in most regions; only four provinces and cities (Beijing, Jiangsu, Zhejiang, and Guangdong) had a livestock density >1 LU ha−1. In 2010, many provinces in the southeast had a high livestock density (>2 LU ha−1), and most provinces in the north and west still had a low density (<1 LU ha−1) (Fig. 5). This highly uneven distribution of livestock production contributed to a decreased effective manure recycling.
Fig. 5. Response of China’s livestock transition in 2050 under different scenarios.
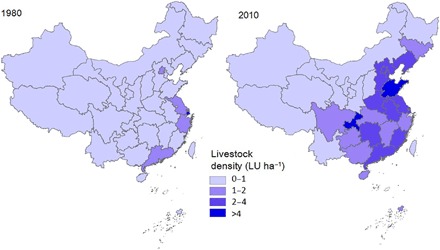
Livestock density at province level in China in 1980 and 2010.
Exploring solutions: Responses to different pathways for 2050
We explored livestock production in China in 2050 using two contrasting Shared Socio-economic Pathways (SSPs) scenarios as basis, that is, a SSP2 route, which is a business-as-usual (BAU) scenario, and a SSP1 route (a set of scenarios). The SSP1 route emphasizes technology development, environmental concerns, and system redesign but without a reduction of animal source food consumption. The scenarios followed the main structure of the SSPs, however, with details regarding animal food consumption and livestock production structure predicted in this study. In SSP2, the consumption of animal protein per capita and the total demand for livestock products are projected to increase from 47 to 165%, depending on animal product (table S1 and fig. S4). The gap between domestic demand and domestic production of livestock products in 2050 will have widened (table S3), and the import of animal source food and/or the import of livestock feed will have increased. In case of import of animal source food only, China would import in 2050 0.5 to 8.4 times the total global trade of livestock products of 2010, depending on animal product (table S3). In case of import of livestock feed only, China would import in 2050 0.7 to 1.4 times the total global trade of livestock feed in 2010 (table S3). The choice for either import of animal source food or livestock feed has impact on the development of the livestock production sector and the associated global environmental burdens. The production of all animal source food domestically will increase GHG emissions in SSP2 from 520 Tg CO2e in 2010 to 805 Tg CO2e in 2050 (Fig. 6C). Similarly, NH3 emission will increase from 7.6 to 11 Tg in SSP2, and N losses to watercourse will increase to 18 Tg (Fig. 6D).
Fig. 6.
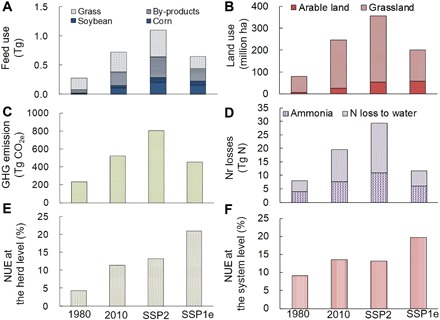
Changes in livestock production performance between 1980 and 2010 and forecasts for 2050 following the SSPs SSP2 and SSP1e: total feed use (A), total land use (B), total GHG emissions (C), total reactive N (Nr) losses (D), NUE at herd level (E), and NUE at whole system level (F). Soybean includes both soybean and processed (for example, soybean cake).
SSP1 offers the potential of an environmentally more sustainable path toward 2050 through improved feed and herd management (SSP1a), whole chain manure management to couple crop production with livestock production (SSP1b), production structure change toward more intensification (SSP1c), production structure change toward more monogastric animals (SSP1d), and combined technologies (SSP1e). Combined technologies showed overwhelming superiority compared to the single options (fig. S5). The combined technology SSP1e pathway leads to improvements in both crop (feed) and livestock production efficiencies, while a reconnect of crop and livestock production will allow improved utilization of manure nutrients and a reduction in competition for human edible food as livestock feed. As a result, the corn consumption in 2050 will decrease from 207 Tg in SSP2 to 160 Tg in SSP1e. Similarly, the need for soybean decreases by 11 Tg and that of forage (grass) by 248 Tg in SSP1e relative to SSP2. Further, GHG emissions will decrease from 805 Tg CO2e in SSP2 to 451 Tg CO2e in SSP1e, and Nr losses from 30 Tg N in SSP2 to 12 Tg N in SSP1e (Fig. 6, C and D). The herd- and system-level NUE will increase in SSP1e by 58 and 49% relative to SSP2, respectively (Fig. 6, E and F). Hence, the prospect of combined technologies and systems redesign in SSP1e is large, relative to the BAU of SSP2.
DISCUSSION
China’s livestock transition between 1980 and 2010 has been unprecedented in the world in terms of scale, speed, and global impact. It has changed the consumption of animal source food from a luxury for the few and a delicacy during the Spring Festival to a common food for almost a billion people. The system change increased livestock productivity, in terms of feed and land use per unit of produced animal protein, and at the same time its environmental burden. The transition was both demand- and supply-driven and as yet without much regulation of its environmental impact. The livestock transition in China is part of the global livestock revolution but unique in terms of scale, speed, impact, and driving forces. Within 30 years, total LU number tripled, and the number of LUs in landless industrial-scale systems increased 70-fold. These relative increases have occurred, for example, for dairy cattle in some Arabic countries (through import of high-genetic merit cattle) (13), but these increases have not been reported across all main livestock categories (cattle, pigs, and poultry) and combined with profound system changes, from mixed and backyard systems to landless industrial systems.
Driving forces of China’s livestock transition
Diet change has contributed more to the rapid increase in livestock number than the increase of the human population (fig. S3). Developments in livestock sciences and technology, including breeding, molecular genetics, and precision feeding have further contributed to the livestock transition (20). Direct subsidy policies from the central government have also strongly supported modernization and industrialization of the livestock sector and have stimulated the start-up of livestock production farms (table S2). The livestock transition has furthermore benefited from loose and ineffective environmental regulations. Construction of large livestock farms near cities was, for example, facilitated even in the case where these farms did not have sufficient arable land nearby for the recycling of manure. Instead, the manure was landfilled or partially treated and then discharged into water bodies (21). In summary, the livestock transition in China is propelled by demand and wealth, as described by Delgado et al. (12), but is also strongly facilitated through subsidies, deregulation policies, and weak environmental regulations.
Impacts on resource use and the environment
The impacts of the livestock transition were profound and large, in terms of livestock productivity, international trade of feed, and environmental pollution. The livestock transition also enhanced competition for agricultural land. Increasing demand of agricultural land may further unbalance land use choices between human needs and ecosystem function (22). The area cropped with corn increased at the expense of the area devoted to wheat and rice in China, due to the increasing demand for livestock feed (23). This change was facilitated also by (indirect) subsidies to farmers growing corn during the livestock transition. However, the increase in domestic feed production was not sufficient. As a consequence, feed import increased greatly. In 2010, feed import was equivalent to 16 million ha of arable land, which is equal to 45% of China’s arable land used for feed production (fig. S6). The massive import of livestock feeds affects the world market, and through changes in commodity prices, it also affects countries in Africa, which also depend on the import of soybean and/or cereals (13). Massive imports also induce large-scale changes in land use in exporting countries, including the deforestation of Amazon in Brazil (24).
Emissions of GHG and Nr per unit of animal produce in 2010 were still much higher in China than in the United States and EU (11, 25). NH3 emission from livestock production amounted to 7.6 Tg in 2010, which was 62% of the total NH3 emission in China (26). These emissions substantially contributed to the formation of PM2.5 (atmospheric particular matter less than 2.5 μm in diameter) and are in part responsible for the air quality problems in China; an additional factor is the concentration of livestock production near urban areas. Further, livestock farms negatively affect water quality; a significant fraction of the manure N and phosphorus (P) ends up in watercourses. Manure N and P are implicated for their role in the severe eutrophication of major rivers, lakes, and coastal waters (27). Forecasts following the SSP2 route suggest that NH3 emissions from livestock production will have increased to 11 Tg NH3-N and N losses to watercourses to 18 Tg N by 2050. These losses significantly contribute to the suggested global maximum losses to be able to stay within planetary boundaries (28). Hence, China’s livestock transition has local, regional, and global dimensions.
Manure is a main resource of soil organic matter and nutrients that may improve soil quality and replace mineral fertilizer. However, manure is a source of pollution when not managed properly. During the transition, manure N recycling rate decreased greatly because of the disconnection between crop and livestock production at the national and global level. As a result, use of new N (synthetic fertilizer and feed import) increased in livestock production (Fig. 2H). Similar results can be found at the global level because of the trade of agricultural products (29).
A new livestock transition for sustainable livestock production
Forecasts for 2050 following the SSP2 scenario suggest that the pressures on the environment, resulting from China’s increased animal source food demand, will greatly increase and may even threaten the sustainability of global livestock production. If China chose to feed the livestock domestically (no importation of animal source food), then livestock production will exert huge pressure on its scarce resources (for example, land and fresh water) and the environment. China will need to import about 97 to 100% of the current global traded corn and soybean, respectively, if there is no improvement of domestic feed production. This may also affect animal feed use in EU, since it imported around 20% of global traded soybean in 2010 (13). These increases in corn and soybean demand may tempt feed exporting countries to increase the acreage of corn and soybean at the expense of wheat production or at the expense of grassland and forest, as has happened in the past 30 years in Brazil and Argentina (13). Conversely, if all additional needed animal source food will be imported from abroad in the SSP2 scenario, then exporting countries may face similar challenges, as recently discussed for the dairy sector (17). Although the efficiency of production is much higher in most exporting countries than in China, exporting countries will also face (biophysical and/or regulatory) limits (11, 15, 17, 25).
Managing animal source food demand can be also an effective strategy to reduce N and P losses from the whole food production and consumption chain (30). We did not consider this option in the SSP1 scenarios because managing demand seems less realistic during the first few decades; half of the population still has a relatively low consumption of animal source food, and current governmental incentives and dietary guidelines promote balanced diets with modest portions of animal source food, as adopted in the SSP1 scenarios currently.
Our results show compelling differences between SSP2 and SSP1e (Fig. 6), with SSP1e as the environmentally preferred and most challenging pathway. This pathway would require another livestock transition built on the current transition with further intensification, improving feed quality, improving herd management and breeding, but with emphasis on improving the agronomic and environmental performance of the whole livestock production sector, and including recoupling of feed-livestock production. Such a livestock transition is difficult to manage without the joint efforts of the livestock sector, suppliers, and the government. Locations of livestock farms have to be planned strategically away from watercourses and other sensitive areas and with sufficient cropland in the vicinity. For proper recycling of manure nutrients, approximately 0.3 to 0.6 ha of agricultural land per LU is needed, depending on soil fertility level and environmental conditions (31). The importance of location of livestock farms was reiterated recently by the Chinese government; pig farmers were expelled from areas near eutrophication-sensitive lakes, following the implementation of the water protection law. Through coupling of crop and livestock production with manure nutrient recycling, large amounts of synthetic fertilizer can be saved (21), which is a main policy objective (32). At the same time, NUEs at the system level can be increased, and eutrophication of lakes, coastal seas, and other sensitive areas can be diminished. The additional requirement of land for feed production will be 31 million ha (Fig. 6B), which is nearly as large as the area of crop land in 2010 (fig. S6). However, the total area of grassland covers more than three times the area of arable land in China, and part of this area has the potential to increase production through better nutrient and water management. Further, closing the crop yield gap through integrated soil-crop management has been shown to be effective for most regions in China; it can increase cereals yield without increasing N input (33) and can also contribute to covering the increased feed demand.
The promise of the SSP1e scenario can only be realized through the implementation of advanced designs and technologies in breeding, animal feeding, and manure management, without sacrifice of animal welfare. Key to realizing the promise of SSP1e are as follows: (i) targeted spatial planning of livestock production, (ii) coupling of crop and livestock production, and (iii) improved grassland management and concentrate feed production, with reduced competition with human-edible food. Achieving the SSP1e requires targeted socioeconomic policies, environmental regulations, and large investments in improving livestock feed production and quality, livestock housing, and manure management.
CONCLUSIONS
The livestock transition in China between 1980 and 2010 has had a significant impact on the livestock production sector itself, food consumption patterns of consumers, and the environment and on the international trade of feed. The number of livestock has tripled, the number of livestock in landless industrial systems increased 70-fold, and the proportion of monogastric animal units increased further from 62 to 74% of total LUs. The changes have been driven by demand and supply factors, including subsidy policies and loose environmental regulations. Though GHG and reactive N losses per unit of animal protein decreased significantly, total GHG and Nr losses increased greatly. The loss of N and P contributed seriously to eutrophication of rivers and lakes. Domestic feed production was insufficient, and increasing amounts of soybean, corn, and, more recently, alfalfa had to be imported, which affected global markets. Forecasts for 2050 reveal that yet another livestock transition will be needed, with again a clear role for the central government, retailers, consumers, and the industry itself. The management of the new transition should focus equally on the spatial planning of livestock farms, the improvement of livestock production efficiency, animal feed production (including forage and grasslands), and manure management.
MATERIALS AND METHODS
This section contains a description of the research system and boundary, a definition of livestock production systems, an introduction to the NUFER (NUtrient flow in Food chains, Environment and Resources use) animal model, and a description of scenarios for 2050, which explores a more sustainable crop-livestock production future.
Research boundary
Figure S7 shows the system concept of this study (livestock production and feed production in China). Inputs [synthetic fertilizers, biological N fixation (BNF), atmospheric deposition, and feed import] are listed on the left-hand side. These inputs are considered “new” inputs. Outputs (livestock products, manure export to other systems, and nutrient losses) are listed on the right hand of the figure. Internal flows between the feed production compartment and the livestock production compartment are shown by dotted arrows. Nutrient accumulated/depletion may occur in the crop or grassland systems.
Definitions of livestock production systems
Here, three main livestock production systems were distinguished, according to the feed regime and manure recycling and on the basis of statistical data: (i) so-called mixed crop-livestock production systems, (ii) grazing production systems, and (iii) landless industrial production systems. In addition, 20 subsystems were distinguished related to the main six livestock categories. The definitions of different livestock production systems are briefly described by Bai et al. (21). Traditional and backyard systems were classified as mixed production systems, and medium and large size industrial production systems were classified as landless production systems. The livestock production structure for the years 2000 and 2010 was derived from Ministry of Agriculture and Food and Agriculture Organization of the United Nations (FAO) databases (13, 34) and for the years 1980 and 1990 from expert consultations.
Overview of the calculation method and NUFER animal model
Total feed DM intake
The method used in this study allows the partitioning of the feed consumption, land use, GHG emission, nutrient use, and losses to the six main livestock categories (pigs, layers, broilers, dairy, beef and draught cattle, and sheep and goat) and to the three main livestock production systems. We began with the estimation of total biomass required by livestock production. The feed intake prediction module was based on the energy requirements for maintenance, body weight gain, lactation, and reproduction. The calculation method was described in detail by Bai et al. (14, 18, 21) for the year 2010. We assumed that there were no big changes in coefficients between 1980 and 2010. However, mean body weight, live weight gain (LWG), milk yield, and egg yield changed over time, and these changes were taken into account; for pig production, see Bai et al. (18); for dairy production, see Zhang et al. (35); and for other animal categories, see Bai et al. (21).
Partitioning of the feed ingredients to different livestock categories
The feed ingredients consumed by each livestock category were calculated by feed compositions and the total feed intake per round.
| (1) |
Iafeed consumption (kilograms) is the consumption of a specific feed ingredient (DM) by a specific livestock category in a specific production system per year. In total, there were 15 feed ingredients, 6 livestock categories, and 3 production systems. IaDM intake is the total feed intake (sum of all 15 feed ingredients) consumed by a specific livestock category in a specific system; Iafeed composition is the percentage of the total feed intake of a specific feed ingredient, including corn, rice, wheat, soybean, rice, wheat, vegetables, by-products of food processing (chaff, bran, and some main products), straw, grass, tubers, kitchen waste, leafs and green straws, animal by-products, residues of vegetables, and other unknown feeds.
The feed compositions of landless production systems of each livestock category were collected from published literatures. For traditional production systems, the feed compositions were based on literature, expert judgments, and model calculations. We applied the mass balance (total feed intake = total feed supply) at national level to be able to check for inconsistencies in the feed balance. Available feed ingredients were allocated over livestock categories assuming that high-quality feeds (corn, soybean, rice, and wheat) were used in the order (i) large-scale industrial systems > medium-scale industrial systems > traditional systems > backyard systems and in the order (ii) poultry > pigs > dairy cattle > beef and draught cattle > sheep and goat. Further, landless systems used more concentrate feeds than traditional and grazing systems. Finally, we assumed that the feed composition per system did not change much over time. Detailed information about feed compositions for pigs are presented by Bai et al. (18) and for dairy cattle by Zhang et al. (35); the other animal categories are presented in the Supplementary Materials.
Land requirement for feed production
Land requirement for feed production was calculated by the required amount of feed and the mean crop yield of the various feed ingredients. Imported feed and by-products were assumed to require no domestic land resources. The import of corn, soybean, rice, and wheat was derived from the FAO database (13). Grains from corn, wheat and rice, soybean and cakes, and grass (forage, including alfalfa) were seen as main products, which demanded land and new nutrients. The remainder of the feed ingredients were seen as by-products feed.
| (2) |
Ocland is the area of land used for feed production based on land areas of corn, wheat, rice, soybean and cakes, and forage used for feed; feed import [in percent (%) of the total feed use of corn, wheat, rice, soybean and cakes, and forage] was derived from FAO (13); and CY is the crop (forage) yield (kilograms per hectare) for the various crops, derived from FAO database (13). The virtual land requirement was derived from the feed import (corn, soybean, rice, wheat, and forage) and the global average productivity of these feeds (13).
BNF and atmospheric N deposition
The inputs of N via BNF and atmospheric deposition to domestic feed production were calculated as follows
| (3) |
IcBNF is the N input through biological N2 fixation (in kilograms), Ocland is the area of land with N2-fixing crops (in hectares), and BNF is the mean biological N2 fixation of specific crops (in kilograms of N per hectare) (14).
| (4) |
Icdeposition is the wet N deposition (in kilograms), and deposition is the atmospheric N deposition (in kilograms of N per hectare) (14).
Fertilizer application
The fertilizer application was calculated as follows
| (5) |
Icfertilizer is the amount of fertilizer applied to certain crops, such as corn, soybean, wheat, and rice (in kilograms) and Ocfeed is the nutrient content of the main feed species (in kilograms). New “N/P” efficiency is the use efficiency of the applied fertilizers (in kilogram of N uptake per kilogram of fertilizer N applied and in kilogram of P uptake per kilogram of fertilizer P applied). The use efficiencies are presented in the Supplementary Materials.
Nutrient intake by livestock
The total nutrient consumption by livestock was calculated from the nutrient content of the feed and the feed consumption (21).
| (6) |
Ianutrient intake (kilogram of N or P) is the nutrient intake by different animal categories, Iafeed intake is the feed ingredient intake by an animal category, and feednutrient content (grams kg−1) is the nutrient content of specific feed ingredients (21).
Livestock product output
The main output of animal products was meat, milk, and eggs. The mean carcass fraction (%) was used to convert live weight to carcass weight. The average carcass fraction for pigs, chicken, beef cattle, and sheep and goat were set at 75, 80, 60, and 50%, respectively.
| (7) |
Oaproducts is the total amount of animal products (in kilograms); animalyield is the yield of meat, milk, or eggs (in kilogram head−1 year−1); animalnumber is the number of animals per animal category. The protein output of animal products was calculated as follows
| (8) |
Oaprotein of products is the total protein output of animal products (in kilograms of protein), and proteincontent is the protein content of animal products (in grams per kilogram). The protein content was derived from the N content of different animal products (21).
Nutrient retention by livestock
Nutrient output from animal products was calculated from the animal products output and nutrient content of the animal products.
| (9) |
Oanutrient in products is the amount of nutrient retained in the animal products (in kilograms), and products nutrient content is the nutrient content of animal products (in grams per kilogram) (21).
Manure nutrient production
The mass balance method was adapted to calculate the production of manure nutrients
| (10) |
Oanutrient excretion is the amount of nutrient excreted per animal category (in kilograms) (21).
Nutrient losses from the manure management chain
The partitioning of manure nutrients and losses followed the description by Bai et al. (21). Reactive N losses include N losses via NH3 and N2O emissions to air, direct discharge of manure to the water bodies and/or landfill, and leaching, runoff, and erosion of N from the manure management chain. The following four sources of GHG emissions were considered: (i) N fertilizer production, (ii) feed production, (iii) livestock production, and (iv) manure management (excluding the GHG emissions of imported feed). Both direct and indirect (from NH3 emissions, nitrate leaching, and discharge of manure to water bodies) N2O emissions were calculated. The non-CO2 emission from the manufacture and use of chemical N fertilizers was set at 13.5 kg of CO2e per kg of N (36). The indirect N2O-N emissions from NH3 volatilization and NO3 leaching were set at 1 and 0.75%, respectively. Emissions of N2O-N from discharged manure N were also set at 1% (37). The average CH4 emissions from enteric sources and manure management were derived from FAO (13), which was based on the IPCC (Intergovernmental Panel on Climate Change) Tier 1 default factors. The global warming potential was 25 and 298 CO2e for CH4 and N2O, respectively. Total GHG emissions were calculated as follows
| (11) |
Scenarios for 2050
We designed and analyzed six scenarios to explore the possible impacts of livestock production in 2050, including a BAU scenario.
BAU scenario (SSP2)
This scenario followed the SSP2 storyline, and the prediction of livestock food demand was based on a FAO report (16), SSPs studies in China (38), and other information sources (table S1). Further, we assumed that the increase in animal production between 2010 and 2050 will take place in landless systems (as was mainly the case between 2000 and 2010) and that the production in mixed crop-livestock systems (including traditional and backyard systems) and grazing systems will remain as in 2010. Also, we assume that the feeding practices and manure management remain as in 2010 (conservative estimate).
Scenario SSP1e
This scenario followed the SSP1 storyline, but the forecast of livestock food demand was as in SSP2. Four major technological changes were considered, in separate SSP1 variants, and a combined option was considered. SSP1a: improved feed and herd management; SSP1b: improved manure management and connected crop and livestock production; SSP1c: accelerated transformation of mixed systems to landless systems; SSP1d: structural adjustment; all additional required animal source food provided by monogastric animals; and SSP1e: combination of SSP1a and SSP1b. Detailed characteristics of these scenarios are shown in the Supplementary Materials.
Supplementary Material
Acknowledgments
Funding: This work was financially supported by the National Natural Science Foundation of China (31572210 and 31272247), Program of International S&T Cooperation (2015DFG91990), the Hundred Talent Program of the Chinese Academy of Sciences (CAS), President’s International Fellowship Initiative of CAS (2016DE008 and 2016VBA073), Sustainable Development Solutions Network, and Distinguished Young Scientists Project of Natural Science Foundation of Hebei (D2017503023). Author contributions: Z.B., L.M., O.O., and G.L.V. designed the research; Z.B., Z.W., and L.M. performed the research and analyzed data; and Z.B., W.M., L.M., O.O., G.L.V., P.H., M.R.F.L., and F.Z. wrote the paper. All authors contributed to analysis of the results. All authors read and commented on the paper. Competing interests: The authors declare that they have no competing interests. Data and materials availability: All data needed to evaluate the conclusions in the paper are present in the paper and/or the Supplementary Materials. Additional data related to this paper may be requested from the authors.
SUPPLEMENTARY MATERIALS
Supplementary material for this article is available at http://advances.sciencemag.org/cgi/content/full/4/7/eaar8534/DC1
Supplementary Text
Fig. S1. Changes of livestock population structure of different livestock categories in China between 1980 and 2010.
Fig. S2. Changes of feed import and contributions to livestock transition.
Fig. S3. Changes of livestock performances in terms of animal protein production.
Fig. S4. Production of animal source food products in 2010 and demand for animal source food in 2050.
Fig. S5. Response of livestock transition under different sub-scenarios in 2050.
Fig. S6. Changes in the areas of domestic arable land used for feed production and virtual land via trade of feed products between 1980 and 2010.
Fig. S7. System boundary and calculation compartment of livestock transition.
Fig. S8. Relationships between urbanization and livestock product consumption per capita in China.
Fig. S9. Relationship between per capita GDP and livestock product consumption per capita in China.
Fig. S10. Changes over time in livestock product consumption per capita in China.
Table S1. Animal source food consumption in 2010, and projections of animal source food demand in 2050, according to different literature sources. (kg capita−1 year−1).
Table S2. List of livestock production related policies and subsidies in China.
Table S3. Consumption, production, and import of animal food and livestock feed in China in 2010, their global trade in 2010, and their demands in 2050.
Table S4. The egg yield of layers production systems at different growing stages in 1980, 1990, 2000, and 2010.
Table S5. The LWG and metabolic weight (MW) of broiler production systems at different growing stages in 1980, 1990, 2000, and 2010.
Table S6. The LWG and MW of beef and draught, and sheep and goat production systems in 1980, 1990, 2000, and 2010.
Table S7. Feed compositions used in layer production systems at different growing stages (%).
Table S8. Feed compositions used in broiler production systems at different growing stages (%).
Table S9. Feed compositions used in beef and draught production systems and sheep and goat production systems (%).
REFERENCES AND NOTES
- 1.Godfray H. C. J., Beddington J. R., Crute I. R., Haddad L., Lawrence D., Muir J. F., Pretty J., Robinson S., Thomas S. M., Toulmin C., Food security: The challenge of feeding 9 billion people. Science 327, 812–818 (2010). [DOI] [PubMed] [Google Scholar]
- 2.Herrero M., Thornton P. K., Livestock and global change: Emerging issues for sustainable food systems. Proc. Natl. Acad. Sci. U.S.A. 110, 20878–20881 (2013). [DOI] [PMC free article] [PubMed] [Google Scholar]
- 3.L. Deutsch, M. Falkenmark, L. Gordon, J. Rockström, C. Folke, Water-mediated ecological consequences of intensification and expansion of livestock production, in Livestock in a Changing Landscape: Drivers, Consequences and Responses, H. Steinfeld, H. Mooney, F. Schneider, L. Neville, Eds. (Island Press, 2010), vol. 1, pp. 97–111. [Google Scholar]
- 4.H. Steinfeld, P. Gerber, T. Wassenaar, V. Castel, M. Rosales, C. de Haan. Livestock’s Long Shadow: Environmental Issues and Options (Food and Agriculture Organization of the United Nations, 2006). [Google Scholar]
- 5.H. Steinfeld, H. A. Mooney, F. Schneider, L. E. Neville, Livestock in a Changing Landscape, Volume 1: Drivers, Consequences, and Responses (Island Press, 2013). [Google Scholar]
- 6.Bouwman L., Goldewijk K. K., Van Der Hoek K. W., Beusen A. H. W., Van Vuuren D. P., Willems J., Rufino M. C., Stehfest E., Exploring global changes in nitrogen and phosphorus cycles in agriculture induced by livestock production over the 1900–2050 period. Proc. Natl. Acad. Sci. U.S.A. 110, 20882–20887 (2013). [DOI] [PMC free article] [PubMed] [Google Scholar]
- 7.Herrero M., Havlík P., Valin H., Notenbaert A., Rufino M. C., Thornton P. K., Blümmel M., Weiss F., Grace D., Obersteiner M., Biomass use, production, feed efficiencies, and greenhouse gas emissions from global livestock systems. Proc. Natl. Acad. Sci. U.S.A. 110, 20888–20893 (2013). [DOI] [PMC free article] [PubMed] [Google Scholar]
- 8.Havlík P., Valin H., Herrero M., Obersteiner M., Schmid E., Rufino M. C., Mosnier A., Thornton P. K., Böttcher H., Conant R. T., Frank S., Fritz S., Fuss S., Kraxner F., Notenbaert A., Climate change mitigation through livestock system transitions. Proc. Natl. Acad. Sci. U.S.A. 111, 3709–3714 (2014). [DOI] [PMC free article] [PubMed] [Google Scholar]
- 9.Garnett T., Appleby M. C., Balmford A., Bateman I. J., Benton T. G., Bloomer P., Burlingame B., Dawkins M., Dolan L., Fraser D., Herrero M., Hoffmann I., Smith P., Thornton P. K., Toulmin C., Vermeulen S. J., Godfray H. C., Sustainable intensification in agriculture: Premises and policies. Science 341, 33–34 (2013). [DOI] [PubMed] [Google Scholar]
- 10.Wilkinson J. M., Lee M. R. F., Review: Use of human-edible animal feeds by ruminant livestock. Animal, 1–9 (2017). doi: 10.1017/S175173111700218X [DOI] [PubMed] [Google Scholar]
- 11.Eshel G., Shepon A., Makov T., Milo R., Land, irrigation water, greenhouse gas, and reactive nitrogen burdens of meat, eggs, and dairy production in the United States. Proc. Natl. Acad. Sci. U.S.A. 111, 11996–12001 (2014). [DOI] [PMC free article] [PubMed] [Google Scholar]
- 12.CL Delgado, M. W. Rosegrant, H. Steinfeld, S. Ehui, C. Courbois, The coming livestock revolution. Background paper n. 6, Department of Economic and Social Affairs, Commission of Sustainable Development, Eighth Session (1999).
- 13.Food and Agriculture Organization of the United Nations, Statistical Database (FAO, 2017). [Google Scholar]
- 14.Bai Z., Ma L., Oenema O., Chen Q., Zhang F. S., Nitrogen and phosphorus use efficiencies in dairy production in China. J. Environ. Qual. 42, 990–1001 (2013). [DOI] [PubMed] [Google Scholar]
- 15.Guo M., Chen X., Bai Z., Jiang R., Galloway J. N., Leach A. M., Cattaneo L. R., Oenema O., Ma L., Zhang F., How China’s nitrogen footprint of food has changed from 1961 to 2010. Environ. Res. Lett. 12, 104006 (2017). [Google Scholar]
- 16.N. Alexandratos, J. Bruinsma, World Agriculture Towards 2030/2050: The 2012 Revision (Food and Agriculture Organization of the United Nations, 2012). [Google Scholar]
- 17.Bai Z., Lee M. R. F., Ma L., Ledgard S., Oenema O., Velthof G. L., Ma W., Guo M., Zhao Z., Wei S., Li S., Liu X., Havlík P., Luo J., Hu C., Zhang F., Global environmental costs of China’s thirst for milk. Glob. Chang. Biol 24, 2198–2211 (2018). [DOI] [PubMed] [Google Scholar]
- 18.Bai Z., Ma L., Qin W., Chen Q., Oenema O., Zhang F. S., Changes in pig production in China and their effects on nitrogen and phosphorus use and losses. Environ. Sci. Technol. 48, 12742–12749 (2014). [DOI] [PubMed] [Google Scholar]
- 19.P. Kristensen, The DPSIR Framework (National Environmental Research Institute, Denmark, 2004). [Google Scholar]
- 20.Li X. L., Yuan Q. H., Wan L. Q., He F., Perspectives on livestock production systems in China. Rangeland J. 30 211–220 (2008). [Google Scholar]
- 21.Bai Z., Ma L., Jin S., Ma W., Velthof G. L., Oenema O., Liu L., Chadwick D., Zhang F., Nitrogen, phosphorus and potassium flows through the manure management chain in China. Environ. Sci. Technol. 50, 13409–13418 (2016). [DOI] [PubMed] [Google Scholar]
- 22.DeFries R. S., Foley J. A., Asner G. P., Land-use choices: Balancing human needs and ecosystem function. Front. Ecol. Environ. 2, 249–257 (2004). [Google Scholar]
- 23.National Statistical Bureau of China (NSBC), China Statistical Yearbook (In Chinese) (China Statistics Press, 2017). [Google Scholar]
- 24.DeFries R. S., Rudel T., Uriarte M., Hansen M., Deforestation driven by urban population growth and agricultural trade in the twenty-first century. Nat. Geosci. 3, 178–181 (2010). [Google Scholar]
- 25.Leip A., Billen G., Garnier J., Grizzetti B., Lassaletta L., Reis S., Simpson D., Sutton M. A., de Vries W., Weiss F., Westhoek H., Impacts of European livestock production: Nitrogen, sulphur, phosphorus and greenhouse gas emissions, land-use, water eutrophication and biodiversity. Environ. Res. Lett. 10, 115004 (2015). [Google Scholar]
- 26.Gu B., Ju X., Chang J., Ge Y., Vitousek P. M., Integrated reactive nitrogen budgets and future trends in China. Proc. Natl. Acad. Sci. U.S.A. 112, 8792–8797 (2015). [DOI] [PMC free article] [PubMed] [Google Scholar]
- 27.Strokal M., Ma L., Bai Z., Luan S., Kroeze C., Oenema O., Velthof G., Zhang F., Alarming nutrient pollution of Chinese rivers as a result of agricultural transitions. Environ. Res. Lett. 11, 024014 (2016). [Google Scholar]
- 28.Steffen W., Richardson K., Rockström J., Cornell S. E., Fetzer I., Bennett E. M., Biggs R., Carpenter S. R., de Vries W., de Wit C. A., Folke C., Gerten D., Heinke J., Mace G. M., Persson L. M., Ramanathan V., Reyers B., Sörlin S., Planetary boundaries: Guiding human development on a changing planet. Science 347, 1259855 (2015). [DOI] [PubMed] [Google Scholar]
- 29.Lassaletta L., Billen G., Grizzetti B., Garnier J., Leach A. M., Galloway J. N., Food and feed trade as a driver in the global nitrogen cycle: 50-year trends. Biogeochemistry 118, 225–241 (2014). [Google Scholar]
- 30.Ma L., Wang F., Zhang W., Ma W., Velthof G., Qin W., Oenema O., Zhang F., Environmental assessment of management options for nutrient flows in the food chain in China. Environ. Sci. Technol. 47, 7260–7268 (2013). [DOI] [PubMed] [Google Scholar]
- 31.Liu Q., Wang J., Bai Z., Ma L., Oenema O., Global animal production and nitrogen and phosphorus flows. Soil Res. 55, 451–462 (2017). [Google Scholar]
- 32.Ministry of Agricultural in China (MOA) (2014); www.moa.gov.cn/govpublic/XMYS/201604/t20160420_5101912.htm.
- 33.Chen X., Cui Z., Fan M., Vitousek P., Zhao M., Ma W., Wang Z., Zhang W., Yan X., Yang J., Deng X., Gao Q., Zhang Q., Guo S., Ren J., Li S., Ye Y., Wang Z., Huang J., Tang Q., Sun Y., Peng X., Zhang J., He M., Zhu Y., Xue J., Wang G., Wu L., An N., Wu L., Ma L., Zhang W., Zhang F., Producing more grain with lower environmental costs. Nature 514, 486–489 (2014). [DOI] [PubMed] [Google Scholar]
- 34.Ministry of Agriculture (MOA), The Husbandry Yearbook (In Chinese) (MOA, 2016). [Google Scholar]
- 35.Zhang N., Bai Z., Luo J., Ledgard S., Wu Z., Ma L., Nutrient losses and greenhouse gas emissions from dairy production in China: Lessons learned from historical changes and regional differences. Sci. Total Environ. 598, 1095–1105 (2017). [DOI] [PubMed] [Google Scholar]
- 36.Zhang W.-f., Dou Z.-x., He P., Ju X.-T., Powlson D., Chadwick D., Norse D., Lu Y.-L., Zhang Y., Wu L., Chen X.-P., Cassman K. G., Zhang F.-S., New technologies reduce greenhouse gas emissions from nitrogenous fertilizer in China. Proc. Natl. Acad. Sci. U.S.A. 110, 8375–8380 (2013). [DOI] [PMC free article] [PubMed] [Google Scholar]
- 37.Strokal M., Kroeze C., Nitrous oxide (N2O) emissions from human waste in 1970–2050. Curr. Opin. Environ. Sustain. 9, 108–121 (2014). [Google Scholar]
- 38.Wang M., Kroeze C., Strokal M., Ma L., Reactive nitrogen losses from China’s food system for the shared socioeconomic pathways (SSPs). Sci. Total Environ. 605–606, 884–893 (2017). [DOI] [PubMed] [Google Scholar]
- 39.O. Oenema, A. Bleeker, N. A. Braathen, M. Budňáková, K. Bull, P. Čermák, M. Geupel, K. Hicks, R. Hoft, N. Kozlova, A. Leip, T. Spranger, L. Valli, G. Velthof, W. Winiwarter, Nitrogen in current European policies, in The European Nitrogen Assessment: Sources, Effects and Policy Perspectives, M. A. Sutton, C. M. Howard, J. W. Erisman, G. Billen, A. Bleeker, P. Grennfelt, H. van Grinsven, B. Grizzetti, Eds. (Cambridge Univ. Press, 2011), pp. 62–81. [Google Scholar]
- 40.Minister of Agriculture (MOA), New China’s Agricultural Statistics for 60 Years (China Statistics Press, 2009). [Google Scholar]
- 41.C. Pomar, L. Hauschild, G. H. Zhang, J. Pomar, P. A. Lovatto, Precision feeding can significantly reduce feeding cost and nutrient excretion in growing animals, in Modelling Nutrient Digestion and Utilisation in Farm Animals, D. Sauvant, J. Van Milgen, P. Faverdin, N. Friggens, Eds. (Wageningen Academic Publishers, 2011), pp. 327–334. [Google Scholar]
- 42.Hill W. G., Is continued genetic improvement of livestock sustainable? Genetics 202, 877–881 (2016). [DOI] [PMC free article] [PubMed] [Google Scholar]
- 43.Duncan R. N., The 1972 convention on the prevention of marine pollution by dumping of wastes at sea. J. Marit. Law Commer. 5, 299–305 (1974). [Google Scholar]
- 44.L. S. Jensen, Animal manure fertiliser value, crop utilisation and soil quality impacts, in Animal Manure Recycling: Treatment and Management, S. G. Sommer, M. L. Christensen, T. Schmidt, L. S. Jensen, Eds. (Treatment and Management, John Wiley & Sons Ltd., 2013), 295–328 pp. [Google Scholar]
- 45.Ju X.-T., Xing G.-X., Chen X.-P., Zhang S.-L., Zhang L.-J., Liu X.-J., Cui Z.-L., Yin B., Christie P., Zhu Z.-L., Zhang F.-S., Reducing environmental risk by improving N management in intensive Chinese agricultural systems. Proc. Natl. Acad. Sci. U.S.A. 106, 3041–3046 (2009). [DOI] [PMC free article] [PubMed] [Google Scholar]
- 46.Velthof G. L., Oudendag D., Witzke H., Asman W. A. H., Klimont Z., Oenema O., Integrated assessment of nitrogen losses from agriculture in EU-27 using MITERRA-EUROPE. J. Environ. Qual. 38, 402–417 (2009). [DOI] [PubMed] [Google Scholar]
- 47.Bai X., Bai F., Zhang K., Lv X., Qin Y., Li Y., Bai S., Lin S., Tissue deposition and residue depletion in laying hens exposed to melamine-contaminated diets. J. Agric. Food Chem. 58, 5414–5420 (2010). [DOI] [PubMed] [Google Scholar]
- 48.Yang X., Jin L., Li J., Ren J., Guo X., Cao P., Gao Y., Effects of composite probiotics on production performance of layer breeders. Cereal Feed Industry 39, 105–108 (2012). [Google Scholar]
- 49.Qiu Z. Y., Sang G. J., Effect of feed crude protein level on layer growth performance. J. Anim. Sci. Vet. Med. 4, 005 (2011). [Google Scholar]
- 50.Shang X. G., Wang F. L., Li D. F., Yin J. D., Li J. Y., Effects of dietary conjugated linoleic acid on the productivity of laying hens and egg quality during refrigerated storage. Poultry Sci. 83, 1688–1695 (2004). [DOI] [PubMed] [Google Scholar]
- 51.Gao J., Zhang H. J., Yu S. H., Wu S. G., Yoon I., Quigley J., Gao Y. P., Qi G. H., Effects of yeast culture in broiler diets on performance and immunomodulatory functions. Poultry Sci. 87, 1377–1384 (2008). [DOI] [PubMed] [Google Scholar]
- 52.Hu Y., Ni Y., Ren L., Dai J., Zhao R., Leptin is involved in the effects of cysteamine on egg laying of hens, characteristics of eggs, and posthatch growth of broiler offspring. Poultry Sci. 87, 1810–1817 (2008). [DOI] [PubMed] [Google Scholar]
- 53.Liu N., Ru Y. J., Tang D. F., Xu T. S., Partridge G. G., Effects of corn distillers dried grains with solubles and xylanase on growth performance and digestibility of diet components in broilers. Anim. Feed Sci. Technol. 163, 260–266 (2011). [Google Scholar]
- 54.Du J., Liang Y., Xin H., Xue F., Zhao J., Ren L., Meng Q., Evaluation of dry matter intake and average daily gain predicted by the Cornell Net Carbohydrate and Protein System in crossbred growing bulls kept in a traditionally confined feeding system in China. Asian-Aust. J. Anim. Sci. 23, 1445–1454 (2010). [Google Scholar]
- 55.L. Q. Liu, The analysis of circular economy for large-scaled scaled livestock production in Xinjiang—A case study of a beef cattle project in Fukang. Master thesis. Xinjiang Agriculture University (2013). [Google Scholar]
- 56.G. L. Wang, Draft animals in China. Technology Transfer: Multi-purpose Cows for Milk, Meat and Traction in Smallholder Farming Systems, 123 (1995).
- 57.Zou S. G., Wu Y. Z., Effect of supplemental fat on performance of laying hens. Int. J. Poultry Sci. 4, 998–1000 (2005). [Google Scholar]
- 58.Hao X., Benke M. B., Gibb D. J., Stronks A., Travis G., McAllister T. A., Effects of dried distillers’ grains with solubles (wheat-based) in feedlot cattle diets on feces and manure composition. J. Environ. Qual. 38, 1709–1718 (2009). [DOI] [PubMed] [Google Scholar]
- 59.Li Y. L., McAllister T. A., Beauchemin K. A., He M. L., McKinnon J. J., Yang W. Z., Substitution of wheat dried distillers grains with solubles for barley grain or barley silage in feedlot cattle diets: Intake, digestibility, and ruminal fermentation. J. Animal Sci. 89, 2491–2501 (2011). [DOI] [PubMed] [Google Scholar]
- 60.Liu X., Wang Z., Lee F., Influence of concentrate level on dry matter intake, N balance, nutrient digestibility, ruminal outflow rate, and nutrient degradability in sheep. Small Ruminant Res. 58, 55–62 (2005). [Google Scholar]
- 61.Pi Z. K., Wu Y. M., Liu J. X., Effect of pretreatment and pelletization on nutritive value of rice straw-based total mixed ration, and growth performance and meat quality of growing Boer goats fed on TMR. Small Ruminant Res. 56, 81–88 (2005). [Google Scholar]
- 62.Qin F., Zhu X., Zhang W., Zhou J., Zhang S., Jia Z., Effects of dietary iodine and selenium on nutrient digestibility, serum thyroid hormones, and antioxidant status of Liaoning cashmere goats. Biol. Trace Elem. Res. 143, 1480–1488 (2011). [DOI] [PubMed] [Google Scholar]
- 63.Wang Y. H., Xu M., Wang F. N., Yu Z. P., Yao J. H., Zan L. S., Yang F. X., Effect of dietary starch on rumen and small intestine morphology and digesta pH in goats. Livest. Sci. 122, 48–52 (2009). [Google Scholar]
- 64.Zhang W., Wang R., Zhu X., Kleemann D. O., Yue C., Jia Z., Effects of dietary copper on ruminal fermentation, nutrient digestibility and fibre characteristics in cashmere goats. Asian-Austral. J. Anim. Sci. 20, 1843–1848 (2007). [Google Scholar]
- 65.Zhao J. S., Zhou Z. M., Ren L. P., Xiong Y. Q., Du J. P., Meng Q. X., Evaluation of dry matter intake and daily weight gain predictions of the Cornell Net Carbohydrate and Protein System with local breeds of beef cattle in China. Anim. Feed Sci. Tech. 142, 231–246 (2008). [Google Scholar]
Associated Data
This section collects any data citations, data availability statements, or supplementary materials included in this article.
Supplementary Materials
Supplementary material for this article is available at http://advances.sciencemag.org/cgi/content/full/4/7/eaar8534/DC1
Supplementary Text
Fig. S1. Changes of livestock population structure of different livestock categories in China between 1980 and 2010.
Fig. S2. Changes of feed import and contributions to livestock transition.
Fig. S3. Changes of livestock performances in terms of animal protein production.
Fig. S4. Production of animal source food products in 2010 and demand for animal source food in 2050.
Fig. S5. Response of livestock transition under different sub-scenarios in 2050.
Fig. S6. Changes in the areas of domestic arable land used for feed production and virtual land via trade of feed products between 1980 and 2010.
Fig. S7. System boundary and calculation compartment of livestock transition.
Fig. S8. Relationships between urbanization and livestock product consumption per capita in China.
Fig. S9. Relationship between per capita GDP and livestock product consumption per capita in China.
Fig. S10. Changes over time in livestock product consumption per capita in China.
Table S1. Animal source food consumption in 2010, and projections of animal source food demand in 2050, according to different literature sources. (kg capita−1 year−1).
Table S2. List of livestock production related policies and subsidies in China.
Table S3. Consumption, production, and import of animal food and livestock feed in China in 2010, their global trade in 2010, and their demands in 2050.
Table S4. The egg yield of layers production systems at different growing stages in 1980, 1990, 2000, and 2010.
Table S5. The LWG and metabolic weight (MW) of broiler production systems at different growing stages in 1980, 1990, 2000, and 2010.
Table S6. The LWG and MW of beef and draught, and sheep and goat production systems in 1980, 1990, 2000, and 2010.
Table S7. Feed compositions used in layer production systems at different growing stages (%).
Table S8. Feed compositions used in broiler production systems at different growing stages (%).
Table S9. Feed compositions used in beef and draught production systems and sheep and goat production systems (%).