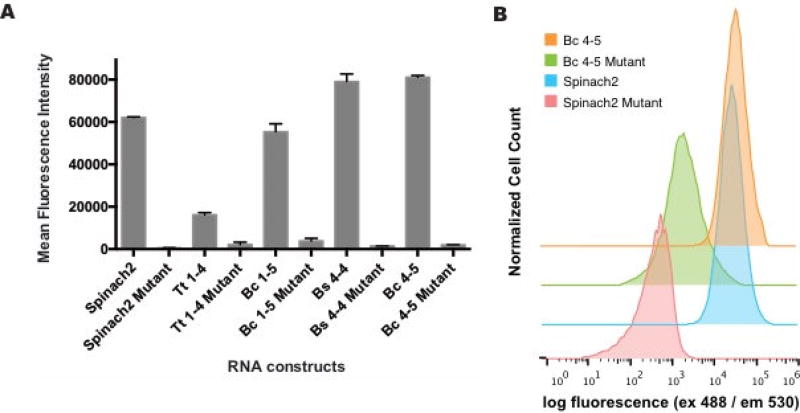
Figure 6.
In vivo performance of SAM cpRS-Sp biosensors. (a) Live cell fluorescence measured by flow cytometry for E. coli BL21* cells expressing plasmid encoding biosensors and incubated in media containing DFHBI. (b) Mean fluorescence intensity was determined by analyzing 30,000 cells per replicate. All error bars represent standard deviation between technical replicates. (b) Representative flow histograms for cells expressing biosensors or controls.

