

Abstract
A global loss of the fragile X mental retardation protein (FMRP; encoded by the Fmr1 gene) leads to sensory dysfunction and intellectual disabilities. One underlying mechanism of these phenotypes is structural and functional deficits in synapses. Here, we determined the autonomous function of postsynaptic FMRP in circuit formation, synaptogenesis, and synaptic maturation. In normal cochlea nucleus, presynaptic auditory axons form large axosomatic endbulb synapses on cell bodies of postsynaptic bushy neurons. In ovo electroporation of drug-inducible Fmr1-shRNA constructs produced a mosaicism of FMRP expression in chicken (either sex) bushy neurons, leading to reduced FMRP levels in transfected, but not neighboring nontransfected, neurons. Structural analyses revealed that postsynaptic FMRP reduction led to smaller size and abnormal morphology of individual presynaptic endbulbs at both early and later developmental stages. We further examined whether FMRP reduction affects dendritic development, as a potential mechanism underlying defective endbulb formation. Normally, chicken bushy neurons grow extensive dendrites at early stages and retract these dendrites when endbulbs begin to form. Neurons transfected with Fmr1 shRNA exhibited a remarkable delay in branch retraction, failing to provide necessary somatic surface for timely formation and growth of large endbulbs. Patch-clamp recording verified functional consequences of dendritic and synaptic deficits on neurotransmission, showing smaller amplitudes and slower kinetics of spontaneous and evoked EPSCs. Together, these data demonstrate that proper levels of postsynaptic FMRP are required for timely maturation of somatodendritic morphology, a delay of which may affect synaptogenesis and thus contribute to long-lasting deficits of excitatory synapses.
SIGNIFICANCE STATEMENT Fragile X mental retardation protein (FMRP) regulates a large variety of neuronal activities. A global loss of FMRP affects neural circuit development and synaptic function, leading to fragile X syndrome (FXS). Using temporally and spatially controlled genetic manipulations, this study provides the first in vivo report that autonomous FMRP regulates multiple stages of dendritic development, and that selective reduction of postsynaptic FMRP leads to abnormal development of excitatory presynaptic terminals and compromised neurotransmission. These observations demonstrate secondary influence of developmentally transient deficits in neuronal morphology and connectivity to the development of long-lasting synaptic pathology in FXS.
Keywords: auditory processing, dendritic maturation, endbulb synapse, fragile X mental retardation protein, trans-synaptic regulation
Introduction
Fragile X mental retardation protein (FMRP) is an mRNA-binding protein that is widely expressed in the brain and throughout development (Hinds et al., 1993; Zorio et al., 2017). Loss of FMRP, due to single-gene mutations of Fmr1, leads to abnormal synaptic function, resulting in lifelong cognitive and behavioral deficits in the fragile X syndrome (FXS; Hagerman et al., 2017). Animal models of global and constitutive Fmr1 knock-out exhibit abnormalities in neuronal differentiation, axonal projection, dendritic arborization, astrocyte–neuron interaction, as well as synaptic maturation and plasticity (Zarnescu et al., 2005; Jacobs et al., 2010; Deng et al., 2011, 2013; Pacey et al., 2013; Hodges et al., 2017; Jawaid et al., 2018). Given the intricate connectome of vertebrate brains, it is challenging to determine at what degree that synaptic abnormalities at a certain age is due to the absence of FMRP signal, or secondary influence of altered connectivity or local environment. Understanding cell-autonomous functions of FMRP has the potential to facilitate determination of key cellular locations and timing of synaptic development governed by FMRP mechanisms.
Although the majority of FMRP studies were performed using global Fmr1 KO mice, several approaches were developed to explore cell-autonomous function of FMRP by manipulating FMRP in cell-type-specific or otherwise more restricted manners. Astrocyte-specific FXS mice demonstrated the importance of both neuronal and astrocytic FMRP in synaptic development (Higashimori et al., 2016; Hodges et al., 2017). Studies with a Fmr1 mosaic KO mouse model reported that loss of presynaptic FMRP influences synaptic connectivity and neurotransmitter release (Hanson and Madison, 2007; Patel et al., 2013), whereas postsynaptic FMRP promotes the pruning of cell-to-cell connections (Patel et al., 2014). These approaches have lessened, but not eliminated, potential secondary influence from other brain regions, because cells with misexpressed FMRP are distributed throughout the brain. As alternative approaches, acute function of FMRP in regulating synaptic number and neural transmission was studied by intracellular infusion of an FMRP antibody and by reintroducing FMRP to Fmr1 KO neurons under in vitro or cultured conditions (Pfeiffer and Huber, 2007; Pfeiffer et al., 2010; Deng et al., 2013). These methods, however, are not readily to be applied to in vivo developmental studies. Cell-type-specific knockdown of FMRP expression in individual cell groups in Drosophila has been used to investigate the role of postsynaptic dFMRP in calcium signal dynamics (Doll and Broadie, 2016). No study with a comparable degree of cellular specificity has been performed in a vertebrate species.
Temporally and spatially controlled genetic editing in the chicken auditory brainstem via in ovo electroporation (Cramer et al., 2004; Schecterson et al., 2012) allows us to knockdown FMRP expression in a subset of neurons in the nucleus magnocellularis (NM), without altering FMRP level in presynaptic neurons that provide major excitatory or inhibitory inputs to NM. NM neurons are homologous to the bushy cells in the mammalian anteroventral cochlear nucleus (AVCN). NM and AVCN bushy cells receive giant excitatory synapses from the auditory nerve, so-called the endbulb of Held, and are specialized for high-frequency synaptic transmission and temporal processing (Rubel and Fritzsch, 2002). Auditory temporal processing deficits and hyperactivity are early-onset and persistent phenotypes of FXS (Rotschafer and Razak, 2014). At the brainstem level, auditory neurons normally express high levels of FMRP across vertebrate species (Beebe et al., 2014; Wang et al., 2014; Zorio et al., 2017) and display smaller cell bodies, altered ion channel regulation, abnormal synaptic morphology, and disrupted excitation-inhibition balance in FXS mouse (Brown and Kaczmarek, 2011; Rotschafer et al., 2015; Ruby et al., 2015; Garcia-Pino et al., 2017; Rotschafer and Cramer, 2017). Here, we selectively knockdown FMRP expression in chicken NM neurons to dissect out the contribution of autonomous FMRP to neuronal and synaptic development in vivo. As endbulb synapses are structurally and functionally conserved across vertebrates including human (O'Neil et al., 2011), this study has high potential for understanding FMRP neurobiology in the mammalian auditory brainstem.
Materials and Methods
Animals.
Fertilized White leghorn chicken eggs (Gallus gallus dometicus) of either sex were obtained from the Charles River Laboratories. Eggs used for anatomical studies were incubated at Florida State University (FSU), whereas eggs for electrophysiological studies were incubated at Northeast Ohio Medical University (NEOMED). All procedures were approved by FSU and NEOMED Institutional Animal Care and Use Committees, and performed in accordance with the National Institutes of Health Guide for the Care and Use of Laboratory Animals.
Plasmid cloning and in ovo electroporation.
To manipulate FMRP levels in NM neurons, we designed five shRNAs directed against specific sequences of chicken Fmr1 using siRNA Wizard v3.1 (InvivoGen) and the siDESIGN Center (ThermoFisher). One most effective shRNA (gaggatcaagatgcagtgaaata; nucleotides 951–973 of chicken Fmr1) was determined based on its knockdown effect in the developing brainstem (see Results) and used for subsequent experiments. A scrambled shRNA (attagaataagtgcgagagaata) was designed using the GenScript algorithm and confirmed by blasting this shRNA sequence against the chicken genome. Fmr1 and scrambled shRNAs were synthesized and cloned into a transposon-based vector system with a Tol2 vector containing doxycycline regulatory components (Fig. 1A; Schecterson et al., 2012). Tol2 transposable element sequences enable stable integration of the transposon into the chick genome, whereas doxycycline regulatory elements allow temporal control of gene expression. For electroporation, individual plasmids of the vector system were concentrated at 4–5 μg/μl and then mixed at an equal amount.
Figure 1.

In ovo electroporation and experimental design. A, Plasmid design for Fmr1 knockdown via in ovo electroporation. Electroporation was performed at HH12. Transcription was triggered by doxycycline administration at E8 and then every other day (data not shown for simplicity). Brainstems were harvested at E11, E15, and E19 for examination following in vitro dye labeling of neurons and auditory fibers. Note strong EGFP labeling only on one side of the brain. Dashed white line indicates the midline. B, Histogram distribution of the distance between the centers of two paired neurons for dendritic and synaptic analyses. C, An EGFP-labeled (green) transfected neuron was intracellularly filled with biocytin (magenta) through a whole-cell patch-recording pipette. Both staining patterns visualize the entire dendritic arborization. The far-right column shows a closer look of a double-labeled distal dendritic tip. The location of this dendritic tip is indicated by white arrows in the lower-magnification images. D, E, Glial cells are distinguished from neurons in NM based on cell body size. EGFP-labeled, transfected neurons and cells are in green, while all neurons and cells are counterstained with NeuroTrace (magenta). Transfected (yellow arrow) and nontransfected (yellow asterisks) glial cells display much smaller cell size than neurons (white arrow). F, Bar chart showing the comparison of somatic diameter between NM neurons and glial cells. ****p < 0.0001. Data are presented as mean ± SD with individual data point. Each data point represents one cell, and the number of cells is listed at the bottom of each bar. Dox, Doxycycline; NeuT, NeuroTrace. Scale bars: C, 10 μm; inset (of C), 2 μm; (in D) D, E, 10 μm.
In ovo electroporation was performed as described previously (Schecterson et al., 2012) with some modifications. Briefly, eggs were incubated at 38°C for 46–48 h until Hamburger and Hamilton (HH) stage 12 (Hamburger and Hamilton, 1951). The plasmid mixture tinted with fast green was injected into the lumen of neural tube at the rhombomere 5/6 level which contain NM neuron precursors (Cramer et al., 2000; Fig. 1A). A platinum bipolar electrode was placed to the two sides of the neural tube, delivering short electrical pulses (4 pulses at 20 V with 30 ms duration and 10 ms between pulses). Following electroporation, the eggs were sealed with Parafilm and returned to the incubator. At embryonic day (E)8, 50 μl of doxycycline (1 mg/ml in sterile 0.01 m PBS; Sigma-Aldrich) was added onto the chorioallantoic membrane using a syringe to trigger the transcription of shRNAs and EGFP. The administration was performed again every other day to maintain the expression before tissue dissection at desired developmental stages. All transfected cells were located on one side of the brain (Fig. 1A).
Immunocytochemistry.
The brainstem was dissected from normally developed or electroporated embryos at various stages and immersed in 4% paraformaldehyde in 0.1 m phosphate buffer (PB) overnight at 4°C. Following fixation, all brainstems were transferred to 30% sucrose in PB until they settled. Brainstems were sectioned in the coronal plane at 30 μm on a freezing sliding microtome. Each section was collected in PBS. Alternate sections were immunohistochemically stained for primary antibodies (Table 1; Wang et al., 2017). Briefly, free-floating sections were incubated with primary antibody solutions diluted in PBS with 0.3% Triton X-100 overnight at 4°C, followed by AlexaFluor secondary antibodies (Life Technologies) at 1:1000 overnight at 4°C. Some sections were counterstained with DAPI and/or NeuroTrace (Life Technologies), a fluorescent Nissl stain, at a concentration of 1:1000 and incubated together with secondary antibodies. Sections containing biocytin-filled neurons were probed with streptavidin (S11227, ThermoFisher; RRID:AB_2313574) at 1:1000 overnight at 4°C (Swietek et al., 2016). All sections were mounted on gelatin-coated slides and coverslipped with Fluoromount-G mounting medium (Southern Biotech) for imaging.
Table 1.
Primary antibodies used for immunocytochemistry
| Antibody | Manufacturer | RRID | Host species | Concentration |
|---|---|---|---|---|
| FMRP* | Pierce Biotechnology | N/A | Rabbit | 1:1000 |
| Gephyrin | Synaptic Systems; mAb7a | AB_2314591 | Mouse | 1:1000 |
| Parvalbumin | Sigma-Aldrich; P3088 | AB_477329 | Mouse | 1:10,000 |
| SNAP25 | Millipore; MAB331 | AB_94805 | Mouse | 1:1000 |
| VGAT | PhosphoSolutions; 2100-VGAT | AB_2492282 | Rabbit | 1:500 |
*Rabbit polyclonal anti-FMRP antibody was custom-made against the chicken FMRP by Pierce Biotechnology. All other primary antibodies were purchased commercially.
N/A, Not applicable.
Quantitative analyses of FMRP immunostaining.
To quantify FMRP immunostaining, sections from five to seven animals for each age containing transfected NM neurons were double labeled for FMRP immunoreactivity and NeuroTrace. Sections were then imaged at single focal plane with a 20× objective lens attached to an Olympus FV-1200 confocal microscope. All images from the same animal were captured using the same imaging parameters. Neurons were selected for analyses based on NeuroTrace staining if they display a well defined cell boundary and an identifiable nucleus. Cross-section somatic area and the integrated density of FMRP immunostaining were subsequently measured for selected neurons using the Fiji software (National Institute of Health), as well as the mean gray value of the background in FMRP immunostaining. The corrected total cell fluorescence (CTCF) of FMRP immunostaining was calculated as follows: CTCF = integrated density − (somatic area × mean gray value of the background) (Burgess et al., 2010; McCloy et al., 2014). For statistical analyses, the CTCF of each measured neuron was normalized to the average CTCF of all measured nontransfected neurons of the same animal. The normalized CTCFs of all measured neurons from all animals of the same age were grouped and compared between transfected and nontransfected neurons. Statistics was performed by unpaired t test, using the Prism software package (GraphPad Software). All data are shown as mean ± SD in the text and figures.
In vitro single-cell filling in brainstem slices.
Thirty-four embryos (9 at E11, 15 at E15, 10 at E19) that received in ovo electroporation were used for this procedure. Acute brainstem slices were prepared as previously described (Wang et al., 2017). Brainstems were dissected out in ice-cold oxygenated artificial CSF (ACSF), pH 7.2–7.4, containing the following (in mm): 130 NaCl, 2.5 KCl, 1.25 NaH2PO4, 26 NaHCO3, 1 MgCl2, 3 CaCl2, and 10 glucose. ACSF was continuously bubbled with a mixture of 95% O2 and 5% CO2. Coronal sections (300 μm) containing the NM were prepared with a vibratome (PELCO easiSlicer, Ted Pella) and collected into room temperature ACSF.
Nontransfected NM neurons located within 100 μm away from a transfected neuron were individually dye-filled using electroporation (Fig. 1B). A glass pipette filled with fixable AlexaFluor 568 dextran (Invitrogen) was driven to approach an identifiable cell body under a Zeiss V16 stereo-fluorescence microscope. The dye was introduced into the cell by a positive voltage (20 V, 30 ms pulse duration, 20 pulses/s, 1–5 s). After electroporation, slices were incubated for 1–2 min to allow dye diffusion to distal dendrites. In a number of slices, we also filled EGFP-labeled transfected neurons to verify that EGFP labeling reveals the entire dendritic arborization including distal dendritic tips (Fig. 1C). For quantitative analyses, we chose not to dye-fill each EGFP-labeled neuron so that we can isolate and thus compare dendritic arborization between neighboring cells with overlapping dendritic fields. Slices were then fixed with 4% paraformaldehyde for 15 min at room temperature. Following washing with PBS, sections were mounted on noncoated slides with Fluoromount-G mounting medium. To reduce tissue shrinkage, a nail polish spot was made at each corner of the coverslip to support the coverslip. Dye-filled and EGFP-labeled neurons were imaged using a confocal microscope (see 3D reconstruction of dendritic arborization and structural analyses.). Following imaging, the coverslip was removed in PBS, and the brainstem slice was freed from the slide and resectioned at 30 μm for additional immunostaining.
3D reconstruction of dendritic arborization and structural analyses.
NM neurons initially have extensive dendrites and then undergo dramatic dendritic pruning before they acquire their adendritic morphology (Jhaveri and Morest, 1982). As this process is topographically organized in a way that neurons in the rostral NM complete dendritic pruning earlier than the neurons located more caudally, our analyses focus on neurons in the rostral half of NM to simplify the description. Because the precursors transfected with Fmr1 shRNA also give rise to glial cells, we did observe EGFP-labeled glial cells in NM in some cases at E19, but not at E11 and E15. In NM, glial cells can be readily distinguished from neurons based on their tiny cell body size (Rubel and MacDonald, 1992; Lurie and Rubel, 1994). At E19, we further confirmed that the diameter of glial cell body (5.5 ± 0.9 μm, n = 56 cells from 4 animals) is significantly smaller than the diameter of neuronal cell body (13.9 ± 1.9 μm, n = 58 neurons from 4 animals; unpaired t test; p < 0.0001; Fig. 1D–F), based on NeuroTrace staining. To minimize the influence of affected glial cells, we only analyzed the region without substantial glial transfection. Additionally, all structural and subsequent functional comparisons were performed between the transfected NM neurons and their nontransfected neighbors, which are residing in the same microenvironment.
For 3D dendritic reconstruction, we collected image stacks of each dye-filled or EGFP-labeled neuron with a 60× oil-immersion lens at a resolution of 0.18 μm per pixel at XY dimensions and with a Z interval of 0.4 μm, using an Olympus FV-1200 confocal microscope. These imaging settings provide sufficient resolution for accurate reconstruction and identification of distal ending morphology. Only neurons with the entire dendritic arborization contained within one slice were used for 3D reconstruction. The entire dendritic arborization was traced with lines through the middle of each branch in Neurolucida v9.03 (MBF Bioscience) as previously described (Wang and Rubel, 2012). Some neurons have short protrusions on their cell body. We did not consider protrusions <3 μm in length as dendrites. Based on dendritic reconstruction, the number of primary dendritic trees and the total dendritic branch length (TDBL) were measured using Neurolucida Explorer v9.03 (MBF Bioscience). TDBL was calculated as the sum of the length of all dendritic branches of a neuron. No tissue shrinkage correction was applied. In addition, Sholl analysis was performed on E11 neurons with complicated dendritic patterning. All measured structural parameters were compared between dextran-filled nontransfected and neighboring transfected neurons by Wilcoxon paired t test in Prism. Detailed statistics results are listed in Table 2 and main conclusions are described in the Results.
Table 2.
Comparison of dendritic structure between transfected and nontransfected neurons
| Properties | Nontransfected (n) | Transfected (n) | p value (t(df) = value) |
|---|---|---|---|
| Fmr1 shRNA (E11) | |||
| TDBL, μm | 911.7 ± 78.6 (8) | 702.0 ± 163.7 (8) | 0.0114* (t(7) = 3.401) |
| Primary tree # | 18.6 ± 5.8 (8) | 13.6 ± 6.9 (8) | 0.1395 (t(7) = 1.667) |
| Cell body volume, μm3 | 1074 ± 173 (38) | 622 ± 167 (38) | <0.0001**** (t(65) = 1.135) |
| Fmr1 shRNA (E15) | |||
| TDBL, μm | 24.4 ± 19.1 (23) | 140.0 ± 168.9 (23) | 0.0018** (t(22) = 3.543) |
| Primary tree # | 5.3 ± 5.5 (23) | 10.5 ± 9.7 (23) | 0.0038** (t(22) = 3.236) |
| Cell body volume, μm3 | 1547 ± 388 (32) | 1189 ± 240 (32) | <0.0001**** (t(31) = 6.717) |
| ANF terminal coverage area, μm2 | 39.3 ± 18.0 (23) | 15.0 ± 12.8 (30) | <0.0001**** (t(51) = 5.749) |
| Gephyrin puncta density, per 100 μm | 9.7 ± 1.5 (49) | 0.059 ± 0.009 (53) | 0.0135* (t(97.82) = 2.517) |
| VGAT puncta density, per 100 μm | 6.7 ± 3.1 (49) | 6.7 ± 3.7 (39) | 0.9444 (t(86) = 0.06994) |
| Fmr1 shRNA (E19) | |||
| TDBL, μm | 2.3 ± 1.9 (8) | 10.1 ± 11.4 (8) | 0.0954 (t(7) = 1.926) |
| Primary tree # | 0.6 ± 0.5 (9) | 0.6 ± 0.5 (9) | 0.9999 (t(8) = 0) |
| Cell body volume, μm3 | 2182 ± 621 (10) | 1838 ± 404 (10) | 0.0653 (t(9) = 2.098) |
| SNAP25 coverage, % | 69 ± 11 (37) | 66 ± 12 (30) | 0.2604 (t(65) = 1.135) |
| ANF terminal coverage area, μm2 | 77.2 ± 28.0 (25) | 28.7 ± 16.5 (31) | <0.0001**** (t(36.98) = 7.633) |
| Gephyrin puncta density, per 100 μm | 22.3 ± 8.3 (80) | 24.6 ± 9.6 (63) | 0.1308 (t(65) = 1.135) |
| VGAT puncta density, per 100 μm | 12.8 ± 5.4 (77) | 14.3 ± 6.1 (45) | 0.1829 (t(83.22) = 1.343) |
| Scrambled shRNA (E11) | |||
| TDBL, μm | 547.2 ± 128.9 (13) | 431.2 ± 163.7 (13) | 0.0806 (t(12) = 1.908) |
| Primary tree # | 14.8 ± 3.1 (13) | 11.4 ± 4 (13) | 0.0774 (t(12) = 1.931) |
| Cell body volume, μm3 | 866 ± 217 (17) | 670 ± 113 (17) | <0.0001**** (t(16) = 6.006) |
| Scrambled shRNA (E15) | |||
| TDBL, μm | 15.3 ± 26.0 (11) | 32.8 ± 69.0 (11) | 0.2236 (t(10) = 1.297) |
| Primary tree # | 2.9 ± 3.9 (11) | 3.8 ± 3.9 (11) | 0.3866 (t(10) = 0.9054) |
| Cell body volume, μm3 | 2055 ± 424 (19) | 1843 ± 527 (19) | 0.0225* (t(18) = 2.495) |
| Scrambled shRNA (E19) | |||
| TDBL, μm | 0 ± 0 (7) | 0.9 ± 2.5 (7) | 0.3559 (t(6) = 1) |
| Primary tree # | 0 ± 0 (7) | 0.1 ± 0.4 (7) | 0.3559 (t(6) = 1) |
| Cell body volume, μm3 | 2461 ± 842 (9) | 2163 ± 671 (9) | 0.1007 (t(8) = 1.855) |
n, Number of neurons (number of terminals for ANF terminal coverage area); df, degree of freedom. Mean ± SD and p values of t test are reported.
*p < 0.05,
**p < 0.01, ***p < 0.001,
****p < 0.0001.
In vitro injection into the eighth nerve.
To visualize individual presynaptic terminals, E15 and E19 chicken embryos (n = 5 animals for each age) transfected with Fmr1 shRNA were used for this experiment. Brainstem blocks (3–4 mm in thickness) attached with the surrounding skull were prepared in oxygenated ACSF to expose the eighth cranial nerve. The nerve surface on the transfected side was briefly dried with low-pressure carbogen (95% O2/5% CO2) blown through a syringe and penetrated by a metal needle whose tip was covered with dextran AlexaFluor 568, 10,000 MW crystals (Invitrogen). After injection, the brainstem chunks were dissected out from the skull with special care to preserve the eighth nerve. The brainstem was incubated in oxygenated ACSF for additional 6 h at room temperature before immersion fixed in 4% paraformaldehyde overnight at 4°C. After cryoprotection with sucrose, brainstems were sectioned at 30 μm and mounted on gelatin-coated slides for imaging.
Quantitative analyses of excitatory presynaptic terminals.
Effect of FMRP knockdown on the development of presynaptic terminals was evaluated by two analyses. The first analysis was performed on E19 embryos (n = 5 animals) that were transfected with Fmr1 shRNA and immunostained for synaptosomal-associated protein 25 (SNAP25), an excitatory presynaptic marker. We first collected confocal image stacks from the sections containing the rostral half of NM, with a 60× oil-immersion lens at a resolution of 0.18 μm per pixel at XY dimensions and with a Z interval of 0.5 μm. Only the neurons whose entire cell body was contained within the same image stack was used for analyses. For each selected neuron, the somatic perimeter as well as the length of SNAP25-containing presynaptic structure along the cell boundary were measured in each focal plane. The somatic coverage ratio was calculated as the sum of the lengths of presynaptic structures divided by the sum of the somatic perimeters across all focal planes containing the particular neuron. The ratios of all measured neurons from all five animals were grouped and compared between nontransfected and transfected neurons by unpaired t test using Prism.
The second analysis was performed on E15 and E19 embryos (n = 5 animals for each age) that were transfected with Fmr1 shRNA and received an injection in the eighth nerve. Sections were also labeled with NeuroTrace for visualizing the cell bodies of nontransfected neurons. We collected confocal image stacks as described for SNAP25 analysis. Individual dextran-labeled auditory terminals were selected based on two criteria: (1) contained within the same image stack, and (2) associated with the cell body of a transfected neuron or neighboring nontransfected neurons. The length of each selected terminal along the cell boundary was measured in each focal plane. The size of individual terminals was evaluated as the sum of the lengths across all planes multiplying 0.5 μm (the z-interval between focus planes). The terminal sizes were compiled across all measured terminals for either transfected or nontransfected neurons and compared between two groups by unpaired t test using Prism. Detailed statistical results are listed in Table 2 and main conclusions are described in the Results.
Quantitative analyses of inhibitory synaptic proteins.
These analyses were performed on E15 and E19 embryos (n = 6–7 animals for each age) that were transfected with Fmr1 shRNA and immunostained for either gephyrin or vesicular GABA transporter (VGAT), two inhibitory synaptic markers. Sections were also double labeled with NeuroTrace for visualizing the cell bodies of nontransfected neurons. Similarly, only neurons whose entire cell body was contained within the same confocal image stack were used for analyses. For each selected neuron, the somatic perimeter was measured in each focal plane and then summed across all planes containing the particular neuron. Gephyrin or VGAT-immunoreactive puncta were counted using the cell counter plugin in Fiji. The density of gephyrin or VGAT was then calculated as the total number of puncta per cell body divided by the summed somatic perimeter. Detailed statistical results are listed in Table 2 and main conclusions are described in the Results.
In vitro whole-cell recordings in brain slices.
In ovo electroporation at E2 and drug induction at E8 were performed in the identical way as described in the previous section. Brainstem slices (300 μm in thickness) were prepared from E15 embryos following the procedure described by Tang et al. (2011). The ACSF used for dissecting (at ∼35°C) and slicing the brain tissue contained the following (in mm): 250 glycerol, 3 KCl, 1.2 KH2PO4, 20 NaHCO3, 3 HEPES, 1.2 CaCl2, 5 MgCl2, and 10 glucose, pH 7.4 when gassed with 95% O2 and 5% CO2. Slices were incubated at 34–36°C for >1 h in normal ACSF containing the following (in mm): 130 NaCl, 26 NaHCO3, 3 KCl, 3 CaCl2, 1 MgCl2, 1.25 NaH2PO4, and 10 glucose, pH 7.4. For recording, slices were transferred to a 0.5 ml chamber mounted on a Zeiss Axioskop 2 FS Plus microscope with a 40× water-immersion objective and infrared, differential interference contrast optics. EGFP-labeled cells were excited at a light wavelength of 470 nm with a one-channel LED Driver (Thorlabs), and visualized with appropriate filters (BP 450–490, FT 510, LP 515). The slice chamber was continuously superfused with ACSF (∼2 ml/min) by gravity. Recordings were performed at 34–36°C.
Patch pipettes were drawn on an Electrode Puller PP-830 (Narishige) to 1–2 μm tip diameter using borosilicate glass micropipettes (inner diameter, 0.84 mm; outer diameter, 1.5 mm; World Precision Instruments). The electrodes had resistances between 3 and 6 MΩ when filled with a solution containing the following (in mm): 105 K-gluconate, 35 KCl, 5 EGTA, 10 HEPES, 1 MgCl2, 4 ATP-Mg, and 0.3 GTP-Na, with pH of 7.2 (adjusted with KOH). The internal solution also contained QX 314 (5 mm) to block voltage-gated Na+ channels, and 0.1% biocytin to reveal cell morphology after the recordings. The Cl− concentration (37 mm) in the internal solution approximated the physiological Cl− concentration in NM neurons (Monsivais and Rubel, 2001). The liquid junction potential was 10 mV, and data were corrected accordingly. Voltage-clamp experiments were performed with an AxoPatch 200B (Molecular Devices). Voltage-clamp recordings were obtained at a holding potential of −70 mV. Series resistance was compensated at 80%. Data were low-pass filtered at 5 kHz, and digitized with a Data Acquisition Interface ITC-18 (Instrutech) at 20 kHz. Recording protocols were written and run using the acquisition and analysis software AxoGraph X (AxoGraph Scientific).
Extracellular stimulation was performed using concentric bipolar electrodes with a tip core diameter of 127 μm (World Precision Instruments). The stimulating electrodes were placed using a Micromanipulator NMN-25 (Narishige), and were positioned at an area lateral to the NM, where the auditory nerve fibers travel into the NM. Square electric pulses (duration of 200 μs) were delivered through a Stimulator A320RC (World Precision Instruments). Optimal stimulation parameters were selected for each cell to give reliable postsynaptic responses. EPSCs were recorded in the presence of GABAA receptors (GABAAR) antagonist SR95531 (10 μm) and glycinergic receptor antagonist strychnine (1 μm). All chemicals and drugs were obtained from Sigma-Aldrich.
Resting membrane potential (RMP) and the total membrane capacitance (Cm) were read from the amplifier. The input resistance (Rin) was calculated using Ohm's Law from the current response to a small (−5 mV) voltage step. Spontaneous EPSCs (sEPSCs) were detected by a template function using a function for product of exponentials:
where t stands for time and tau for time constant. The values of the parameters for the template used to detect sEPSCs are as follows: amplitude of −65 pA, rise time of 0.15 ms, decay tau of 0.3 ms, with a template baseline of 1 ms and a template length of 1 ms. These parameters were determined based on an average of visually detected synaptic events. The detection threshold is threefold the noise SD, which detects most of the events with the least number of false-positives. The average of detected events for each cell was obtained using AxoGraph to measure rise time, amplitude, and decay tau. Statistics were performed using Excel (Microsoft), and graphs were made in Igor (Wavemetrics). Means and SDs are reported. Statistical differences were determined by paired t test, with the number in parenthesis indicating the number of pairs of cells. Detailed statistics results are listed in Table 3 and main conclusions are described in the Results.
Table 3.
Comparison of neuronal properties between transfected and nontransfected neurons
| Properties | Nontransfected (n) | Transfected (n) | p value (t(df) = value) |
|---|---|---|---|
| Passive | |||
| RMP, mV | −65.5 ± 5.3 (13) | −65.8 ± 5.9 (13) | 0.7750 (t(12) = 0.2924) |
| Rin, MΩ | 511 ± 316 (13) | 411 ± 257 (13) | 0.3020 (t(12) = 1.078) |
| Cm, pF | 12.3 ± 6.2 (13) | 20.3 ± 9.2 (13) | 0.0006*** (t(12) = 4.58) |
| sEPSCs | |||
| Frequency, Hz | 1.7 ± 1.0 (12) | 1.5 ± 1.8 (12) | 0.7759 (t(11) = 0.2918) |
| Amplitude, pA | −74.8 ± 50 (12) | −51.7 ± 39.9 (12) | 0.0497* (t(11) = 2.205) |
| Rise time, ms | 0.17 ± 0.04 (12) | 0.22 ± 0.05 (12) | 0.0003*** (t(11) = 5.111) |
| Decay tau, ms | 0.23 ± 0.09 (12) | 0.39 ± 0.15 (12) | 0.0097** (t(11) = 3.121) |
| Evoked EPSCs | |||
| Max amplitude, nA | 12.13 ± 11.68 (7) | 7.29 ± 8.45 (7) | 0.0363* (t(6) = 2.686) |
| PPR | 0.47 ± 0.15 (7) | 0.61 ± 0.15 (7) | 0.0106* (t(6) = 3.655) |
n, Number of cells. Mean ± SD and p values of paired t test are reported.
*p < 0.05,
**p < 0.01,
***p < 0.001.
Imaging for illustration.
Images for illustration were captured either with the Zeiss LSM 880 or Olympus FV1200 confocal microscope. Image brightness, gamma, and contrast adjustments were performed in Adobe Photoshop. All adjustments were applied equally to all images of the same set of staining from the same animal.
Experimental design and statistical analysis.
All statistical analyses were performed using GraphPad Prism 7 software. p < 0.05 was considered as statistically significant. Two-tailed, paired t test was used to compare somatodendritic morphology and physiological features between neighboring transfected and nontransfected neurons. Each pair of neurons was considered as an individual data point, for the most biologically meaningful comparison. Common to all auditory cell groups, neuronal properties in NM vary largely in relationship to their location along the tonotopic axis. We define “neighboring” as the distance between the centers of two neuronal cell bodies <100 μm, as measured from the image stacks in Fiji. A frequency histogram of this distance was compiled across all pairs of neurons used for dendritic analyses and graphed in Figure 1B. Eighty-two percent of all analyzed pairs have a distance between the centers of two neurons within 50 μm. Ratio t test was used to compare the intensity of FMRP immunoreactivity. Two-tailed, unpaired t test was used to compare synaptic size and density as well as the distribution of synaptic proteins. Welch's correction was applied when the variances were different. Each neuron or terminal was considered as an individual data point. For all analyses, the sample size (n = number of pairs/neurons/terminals) along with exact p values were included in each figure and figure legend. Paired data were shown as symbols connected by lines. Unpaired data were displayed as mean ± SD with individual data points. Details of the statistical analyses are provided in tables. Significance is represented as asterisk(s) in both tables and figures.
Two-way ANOVA followed by Tukey's multiple-comparison tests were performed to determine the dependency of the effects on somatic size on the type of shRNA (Fmr1 vs scrambled), or the dependency of the effects on terminal size on the age examined, using the Prism. F (DFn, DFd) and p values were reported in the text.
Results
Fmr1 shRNA leads to persistent reduction of FMRP level in developing NM neurons
Using an antibody that specifically recognizes chicken FMRP, we demonstrated the presence of FMRP in NM neurons throughout development from E9 to post-hatch day (P)4 (Fig. 2A). To manipulate FMRP levels in NM neurons, in ovo electroporation was performed to introduce Fmr1 shRNA into NM neuron precursors at E2. Doxycycline administration to induce shRNA expression started at E8, the developmental milestone that NM neurons have migrated to their final destination in the dorsal brainstem and have separated from other neuronal cell types as an individual nucleus. This timing also mimics the human FXS disease condition in which FMRP expression is present in the first trimester before it completely stops (Willemsen et al., 2002). The effects of Fmr1 shRNA on knocking down the expression of endogenous chicken FMRP in vivo was verified by immunocytochemistry. At E9 (1 d after doxycycline administration), FMRP immunostaining was notably lower in neurons transfected with Fmr1 shRNA (Fig. 2B), but not with the scrambled shRNA (Fig. 2C) compared with neighboring nontransfected neurons. Notable reduction was continuously observed at E19 following Fmr1 shRNA transfection (Fig. 2D). We measured the CTCF of FMRP immunostaining of individual neurons and normalized that to the mean of nontransfected neurons measured from the same animals (Fig. 2E). Normalized FMRP CTCF was significantly smaller in neurons transfected with Fmr1 shRNA (transfected: 0.69 ± 0.30, n = 52 neurons; nontransfected: 1.00 ± 0.19, n = 84 neurons; t(65.07) = 7.058; p < 0.0001), but not in neurons transfected with scrambled shRNA (transfected: 0.90 ± 0.32, n = 35 neurons; nontransfected: 1.00 ± 0.18, n = 57 neurons; t(48.62) = 1.738; p = 0.0886). In addition, FMRP reduction was persistent in NM neurons at E15 (transfected: 0.76 ± 0.25, n = 90 neurons; nontransfected: 1.00 ± 0.21, n = 147 neurons; t(134) = 7.264; p < 0.0001) and E19 (transfected: 0.65 ± 0.21, n = 51 neurons; nontransfected: 1.00 ± 0.17, n = 57 neurons; t(71.4) = 8.766; p < 0.0001). Similar to E9, scrambled shRNA did not affect FMRP immunostaining intensity at E15 and E19. As the otocyst, which gives rise to the inner ear is located near rhombomeres 5/6, it is important to clarify that our manipulations of FMRP expression in NM neurons did not affect FMRP level in spiral ganglion neurons (Fig. 3), whose axons provide the primary excitatory inputs to NM neurons. The precursors of spiral ganglion are located outside of neural tube, therefore, both the cell bodies and axons (the auditory nerve) of ganglion neurons were not transfected, and thus EGFP-negative in all 124 chicken embryos examined. Immunostaining further verified strong FMRP expression in ganglion cell bodies following Fmr1 shRNA transfection in NM. In summary, Fmr1 shRNA effectively reduced FMRP level in NM neurons from E9 to E19, although the exact amount of FMRP reduction cannot be determined due to the nonlinear relationship of immunostaining intensity to protein level.
Figure 2.

Persistent reduction of FMRP in NM neurons following Fmr1 shRNA transfection. A, FMRP immunostaining of NM neurons at E9, E11, E15, and P4. FMRP is expressed throughout this developmental period, although at differential levels. B, C, Verification of knockdown effect by immunostaining at E9. Note reduced FMRP staining intensity in Fmr1 shRNA transfected neurons (B, dashed line) compared with neighboring nontransfected neurons as well as neurons transfected with scrambled shRNA (C, dashed line). D, Verification of knockdown effect by immunostaining at E19. Note reduced FMRP staining intensity in Fmr1 shRNA transfected neurons (dashed line) compared with neighboring nontransfected neurons. E, Quantification of FMRP immunostaining reduction at E9, E15, and E19. The y-axis is the ratio of FMRP CTCF relative to averaged CTCF of nontransfected neurons. The shaded area indicates the total effect of Fmr1 knockdown on FMRP level during the development. ****p < 0.0001. Data are presented as mean ± SD. Scale bars: A, 20 μm; B (for B, C), 10 μm; D, 10 μm.
Figure 3.
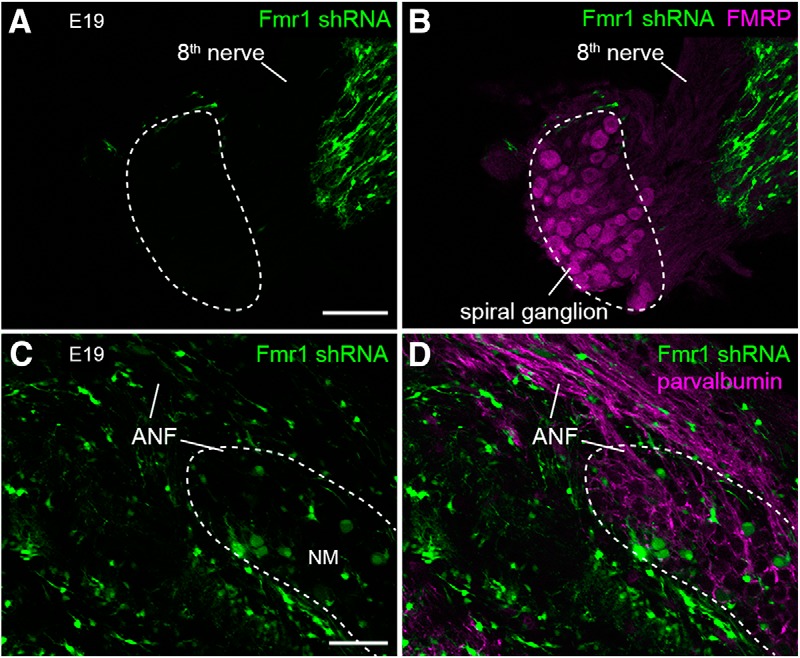
Fmr1 knockdown in NM did not transfect spiral ganglion neurons. A, B, Spiral ganglion neurons, the cell bodies of the auditory nerve, were EGFP-negative following in ovo electroporation into the rhombomeres 5/6. Spiral ganglion neurons (outlined with dashed lines) express high levels of FMRP. C, D, Axons in the ANF, as indicated by parvalbumin immunoreactivity (magenta), were EGFP-negative following the electroporation. All images were taken from the same side of electroporation. The eighth nerve contains both ANF and the vestibular nerve. Scale bars: A (for A, B), 100 μm; C (for C, D), 50 μm.
Fmr1 knockdown in NM neurons leads to significant delay in dendritic pruning
NM neurons initially have extensive dendrites and then undergo dramatic dendritic pruning before they acquire their adendritic morphology and form endbulbs of Held with auditory nerve terminals (Jhaveri and Morest, 1982). Following Fmr1 shRNA electroporation, we first examined NM dendritic morphology at E15 when rostral NM neurons normally have lost all or the majority of their dendrites. As expected, nontransfected neurons displayed the typical adendritic morphology of a round cell body with no or very short dendrites (Fig. 4A, gray neurons). In contrast, neighboring transfected neurons showed substantial dendritic arborization (green neuron). Among 23 pairs of analyzed neurons from 5 animals, 14 transfected neurons had a >2.8-fold of the TDBL compared with their neighboring nontransfected neurons. On average across all 23 pairs, the TDBL of transfected neurons was 5.7-fold of nontransfected neurons (Table 2). Statistical analyses with paired t tests confirmed that Fmr1 shRNA transfected neurons had significantly larger TDBL compared with neighboring nontransfected neurons (Fig. 4B). In addition, TDBL increase was accompanied by significantly more dendritic trees in transfected neurons (Table 2). In contrast, neurons transfected with scrambled shRNA showed few dendrites, similar to nontransfected neurons (Fig. 4C). Statistical analyses revealed no significant effect of this manipulation on either TDBL or the number of trees (Table 2; Fig. 4D). These observations demonstrate that excess dendrites of NM neurons induced by Fmr1 shRNA transfection are specific to FMRP reduction.
Figure 4.

Significant delay in dendritic pruning of NM neurons following Fmr1 knockdown. A, A dextran-filled nontransfected neuron (gray) and a neighboring transfected neuron (green) at E15 following Fmr1 shRNA transfection. White arrows indicate the dendrites of transfected neuron. B, Paired comparisons of the TDBL at E15 following Fmr1 shRNA transfection. C, Dextran-filled nontransfected neurons (gray) and a neighboring transfected neuron (green) at E15 following scrambled shRNA transfection. All neurons show adendritic morphology. D, Paired comparisons of TDBL at E15 following scrambled shRNA transfection. E, A dextran-filled nontransfected neuron (gray) and a neighboring transfected neuron (green) at E19 following Fmr1 shRNA transfection. White arrows indicate short protrusions on the cell membrane of the transfected neuron. A–C, Yellow arrows point to passing axons or occasionally labeled astrocytes and their processes. F, Paired comparisons of TDBL at E19 following Fmr1 shRNA transfection. Inset, The comparison at a smaller scale. B, D, F, Each data point represents one cell. Each pair of EGFP-labeled transfected and neighboring dextran-filled nontransfected cells are connected by a line. The number of pairs is listed for each graph. **p < 0.01. Scale bar: (in A) A, C, E, 10 μm.
To address the question whether this alteration in dendritic morphology is long-lasting or a temporal delay in dendritic pruning, we examined NM dendritic morphology at E19. Interestingly, both transfected and nontransfected neurons had no or only one to two short dendrites (Fig. 4E). Notably, some transfected neurons at this stage showed a rough cell body surface with short protrusions (white arrows). Many of these protrusions were <3 μm in length, and not considered as dendritic trees (see Materials and Methods). Quantitatively, transfected neurons were comparable to neighboring nontransfected neurons in TDBL (Table 2; Fig. 4F). More importantly, we did not observe changes in dendritic morphology at E19 following scrambled shRNA transfection (Table 2). Together, these observations demonstrate postsynaptic FMRP knockdown in NM neurons leads to a temporal delay in dendritic pruning.
Fmr1 knockdown in NM neurons leads to reduced dendritic growth during early development
The delay in completing dendritic pruning with less FMRP may be due to NM neurons had more dendrites initially to retract and/or that they retract dendrites at a slower speed. To clarify this question, we examined dendritic morphology of NM neurons at E11 following Fmr1 shRNA electroporation at E2 and doxycycline administration at E8. Both transfected and neighboring nontransfected neurons displayed extensive dendrites at E11, however, with distinct arborization patterns (Fig. 5A). Transfected neurons appeared to have less but longer dendritic processes compared with nontransfected neurons. To confirm this observation, we reconstructed the dendritic arborization of eight pairs of transfected and nontransfected neurons. Six of eight pairs of neurons (75%) showed a reduction in TDBL of the transfected neuron relative to a neighboring nontransfected neuron, while two other pairs showed comparable TDBLs (Fig. 5B). Statistical analyses among all pairs demonstrated a significant reduction in TDBL following FMRP knockdown (Table 2). In addition, there were no significant differences in the number of primary trees (Table 2).
Figure 5.

Reduced dendritic growth of NM neurons following Fmr1 knockdown. A, Transfected (green) and nontransfected (gray) neurons at E11 following Fmr1 shRNA transfection. Note the transfected neuron appears to have longer dendritic branches but fewer dendritic processes around the cell body. B, Paired comparisons (n = 13 pairs) of the TDBL between dextran-filled nontransfected and EGFP-labeled transfected neurons. Each data point represents one cell. C, D, Sholl analysis of 3D dendritic reconstruction of a transfected (C; indicated by yellow arrow in A) and a neighboring nontransfected neuron (D; indicated by white arrow in A). The TDBL is indicated for each cell. The Sholl circles are 5 μm interval, with the shaded one indicating the 25–30 μm range. Note more dendritic materials within 25 μm from the cell body in nontransfected neurons than transfected neurons. E, F, Sholl analyses of dendritic intersection (E) and branch length (F). Note significant reductions in the number and length of dendritic branches within 25 μm of the cell body, while these numbers show a trend of increase at 30 μm and further from the cell body as arrows indicated. ***p < 0.001, **p < 0.01, *p < 0.05. Scale bar: A, 20 μm.
Sholl analyses of dendritic intersection and branch length further revealed that neurons with less FMRP had significantly less dendritic processes within 25 μm distance from the center of the cell body (Fig. 5C,D). Notably, transfected neurons intended to have more dendritic processes further away, although these changes were not statistically significant (Fig. 5E,F, arrows). In contrast, no change in either TDBL or number of primary trees was observed following transfection with scrambled shRNA (Table 2). In summary, postsynaptic FMRP knockdown in NM neurons leads to reduced dendritic growth during early development, and this reduction is primarily contributed by sparser dendritic branching shortly after leaving the cell body. Therefore, the delay in dendritic pruning at E15 in neurons with less FMRP is attributed to a slower speed in dendrite retraction.
Fmr1 knockdown in NM neurons leads to persistent reduction in the cell body size
In addition to dendritic deficits, we found that the cell body volume of NM neurons significantly reduced in neurons transfected with Fmr1 shRNA at E11 and E15, but not at E19 (Table 2; Fig. 6A–C). Interestingly, the neurons transfected with scrambled shRNA also possessed smaller somatic volume than the nontransfected NM neurons at E11, but appeared at a smaller degree (23%) compared with Fmr1 shRNA transfection (42%; Table 2; Fig. 6D). The results of two-way ANOVA for the manipulation (transfected vs nontransfected) and the type of the shRNA electroporated (Fmr1 vs scrambled) indicated that the effect of transfection on somatic size depended upon the type of shRNA (F(1,106) = 13.17; p = 0.0004). A significantly larger change occurred following Fmr1 shRNA than following scrambled shRNA transfection, indicating FMRP reduction has a specific effect on somatic size at E11. The effect of scrambled shRNA was reduced at E15 (10%) and not significant at E19 (Fig. 6E,F).
Figure 6.
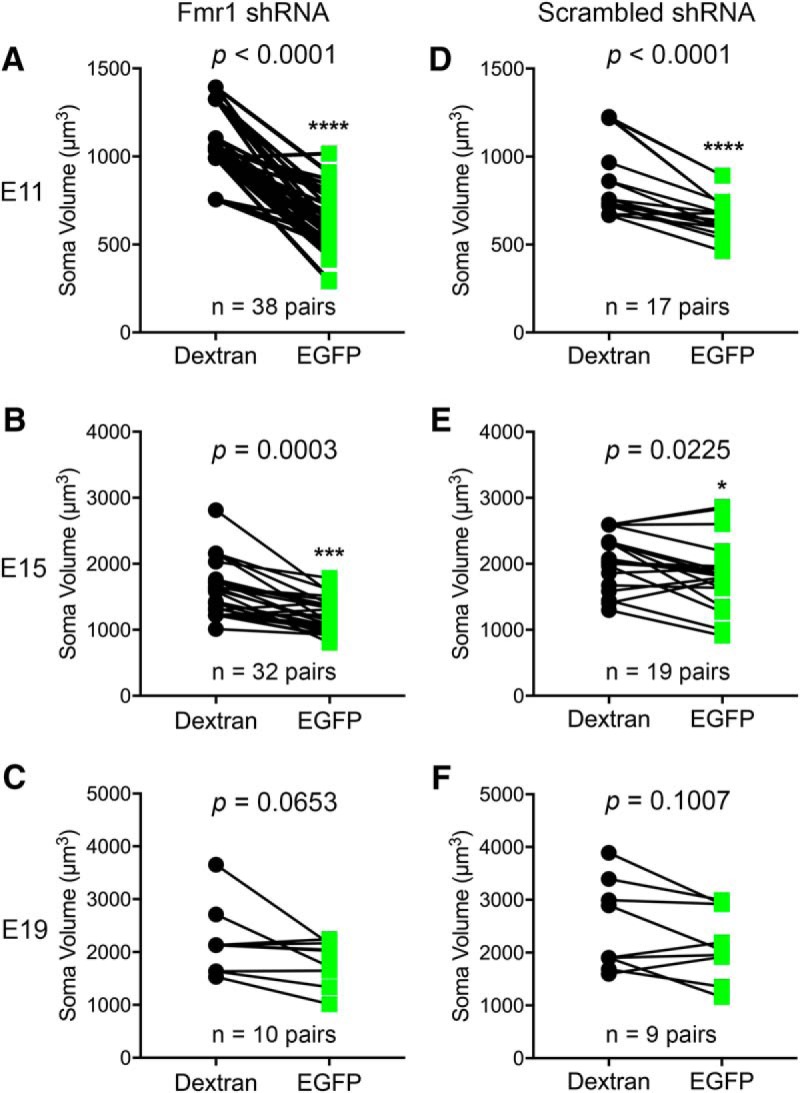
Fmr1 knockdown in NM neurons leads to smaller cell body size. Paired comparisons of the soma volume between nontransfected and EGFP-labeled transfected neurons at E11, E15 and E19, following Fmr1 (A–C) or scrambled (D–F) RNA transfection. Each data point represents one cell. The number of pairs is listed for each graph. ****p < 0.0001, ***p < 0.001, *p < 0.05.
Fmr1 knockdown in NM neurons leads to defective development of excitatory presynaptic terminals
The auditory nerve fibers (ANF) provide the primary excitatory input to NM neurons. In the rostral half of the NM, ANF axons terminate on NM cell body and dendrites as small bouton synapses before E15 when NM neurons have dendrites (Jhaveri and Morest, 1982). With the loss of dendrites at E15, ANF axons synapse on the cell body of NM neurons with relatively larger terminals. These terminals continue to grow and transform into the giant endbulb synapses at E19. As dendritic pruning of NM neurons proceeds and is structurally prerequisite for the proper maturation of presynaptic endbulb terminals, we asked the question whether FMRP knockdown alters the structure of developing presynaptic terminals.
We first examined the total coverage of excitatory synapses on NM neurons by SNAP25 immunostaining. Figure 7, A–D, shows a representative dextran-filled nontransfected NM neuron at E15. As expected, the cell body was surrounded by SNAP25-containing terminals (white arrows). A neighboring neuron transfected with Fmr1 shRNA displayed extensive dendrites and notably reduced perisomatic SNAP25 labeling (Fig. 7E–H). On the other hand, intense SNAP25 labeling was observed immediately adjacent to the dendrites (yellow arrows). At E19, labeled terminals circumscribed the bald cell bodies of both transfected and nontransfected neurons (Fig. 7I–K). Interestingly, SNAP25 labeling appeared more discontinued on some transfected neurons (yellow arrows), whereas nontransfected neurons contained fewer but larger SNAP25-containing terminals (white arrows). At the individual cell level, the percentage of the cell body surface area that was covered by SNAP25 labeling was comparable between transfected and neighboring nontransfected neurons (Table 2; Fig. 7L).
Figure 7.

Fmr1 knockdown does not alter total SNAP25 immunoreactivity per NM neuron. A–D, Dextran-filled nontransfected neuron at E15. Inset shows the z-projection of a pair of transfected (green) and nontransfected (gray) NM neurons double labeled with SNAP25 immunostaining. SNAP25 immunoreactivity is immediately apposite to the cell body of the nontransfected neuron (white arrows). D, A closer look of the box in C (with rotated orientation). E–H, EGFP-labeled transfected neuron at E15. This neuron is also shown in the inset in A. SNAP25 immunoreactivity was detected frequently surrounding the dendrites (yellow arrowheads), but less on the cell body. H, A closer look of the box in G. I–K, EGFP-labeled transfected neuron at E19. Both transfected (yellow arrow) and neighboring nontransfected (white arrow) neurons display perisomatic SNAP25 staining. L, Quantification of the cell body coverage at E19 by SNAP25-containing terminals. Each data point represents an individual neuron. Data are compiled from five animals with a total of 30 transfected and 37 nontransfected neurons, as indicated at the bottom of each bar. Data are presented as mean ± SD with individual data points. All images were at single focus planes (except for A, inset). Scale bars: (in K) A–C, E–G, I–K, 10 μm; inset (of A), 10 μm; (in H) D, H, 5 μm.
To better reveal the structure of individual presynaptic terminals, we injected a dextran fluorescent dye into the eighth nerve on the electroporated side with Fmr1 shRNA. As expected, dextran-labeled ANF terminals formed medium-size synapses on the cell body of nontransfected neurons at E15 (Fig. 8A,B). Transfected NM neurons, on the other hand, possessed substantial dendrites at E15 and received smaller ANF terminals on both the cell body (yellow arrows in Fig. 8C,D) and dendrites (open yellow arrowheads). At E19, ANF terminals on nontransfected cells grew notably larger and resembled the typical endbulb morphology with a number of finger-like branches (Fig. 8E, white arrows). ANF terminals on transfected cells also grew in size and generated finger terminal branches (Fig. 8F, yellow arrows). These finger terminal branches were often small and exhibited a pseudopodium-like morphology. To confirm these observations quantitatively, we measured the coverage area of individual terminals from 3D reconstructed ANF axons. The coverage area of individual branch terminals was significantly smaller on transfected neurons than neighboring nontransfected neurons (Table 2; Fig. 8G). Notably, the terminal size of both transfected and nontransfected neurons increased at a comparable fold (1.91 and 1.96) from E15 to E19, however, the absolute speed of growth reduced 2.8 times on average in neurons with less FMRP. The results of two-way ANOVA for the manipulation (transfected vs nontransfected) and the age (E15 vs E19) indicated that the effect of transfection on ANF terminal size depended upon the age (F(1,105) = 10.61; p = 0.0015). Larger changes occurred at E19 than at E15 indicate that the degree of changes in the absolute size of ANF terminals following postsynaptic FMRP reduction increases with age, at least during the period of E15–E19.
Figure 8.

Postsynaptic Fmr1 knockdown leads to reduced presynaptic terminal size of the auditory nerve. A, Dextran labeled presynaptic structures (gray) at E15. A transfected NM neuron (green) retained dendrites. Dashed circle indicates a neighboring nontransfected neuron. B–D, Closer looks of ANF terminals on the nontransfected (B) and transfected neuron (C, D) shown in A. Dashed lines circle the cell bodies. White and yellow arrows point to ANF terminals located adjacent to the cell bodies. Open arrowheads point to the terminals surrounding the dendrites. E, F, Dextran-labeled presynaptic structures at E19. Note the finger-like terminal branches of a normal endbulb (white arrows) on a nontransfected neuron, and small pseudopodium-like terminals (yellow arrows) on a transfected neuron. G, Bar charts of the coverage area of individual terminals on nontransfected (black bars with black circles; EGFP−) and transfected (gray bars with green squares; EGFP+) NM neurons. Data are presented as mean ± SD with individual data points. Each data point represents an individual terminal. At E15, data are compiled from five animals with a total of 30 terminals from 18 transfected neurons and 23 terminals from 19 nontransfected neurons. At E19, data are compiled from five animals with a total of 31 terminals from 13 transfected neurons and 25 terminals from 20 nontransfected neurons. ****p < 0.0001. All images were z-projections of confocal image stacks. Scale bars: (in A) A, E, F, 20 μm; (in B) B–D, 10 μm.
Together, postsynaptic FMRP reduction leads to long-lasting structural deficits of excitatory presynaptic terminals in NM, although the total innervation of the auditory axons per individual NM neurons is normal, at least at E19.
FMRP knockdown in NM neurons has transient effects on postsynaptic gephyrin clustering of inhibitory synapses
NM neurons begin to receive substantial inhibitory inputs ∼E15 with gradually increasing synaptic density until E19 (Code et al., 1989). We examined the effects of FMRP knockdown in NM neurons on the expression of gephyrin and VGAT, a postsynaptic and presynaptic marker for inhibitory synapses, respectively. The most notable difference between transfected and nontransfected neurons was observed for gephyrin staining at E15. As expected, punctate gephyrin staining circumscribed the cell body of nontransfected NM neurons (Fig. 9A,B, asterisks). Neighboring transfected neurons showed few gephyrin puncta surrounding the cell body (Fig. 9C, white circles), although some puncta appeared to be associated with their dendrites (yellow arrows). There was, however, no notable difference in the distribution pattern and density of gephyrin puncta at E19 (Fig. 9D–F). VGAT immunostaining did not show any notable difference between transfected and nontransfected neurons at both E15 (Fig. 9G–I) and E19 (Fig. 9J–L). Quantification analyses using unpaired t tests confirmed these observations, demonstrating a significantly lower density of gephyrin puncta on transfected neuronal cell bodies compared with neighboring nontransfected neurons, at E15 but not E19 (Table 2; Fig. 9M). The density of VGAT puncta was not statistically different between transfected and nontransfected cells at both E15 and E19 (Table 2; Fig. 9N). In summary, reduced FMRP in NM neurons does not affect the localization of presynaptic VGAT but leads to a transient deficit in the patterning of postsynaptic gephyrin clusters during early development.
Figure 9.

Postsynaptic Fmr1 knockdown leads to transient changes in gephyrin, but not VGAT, distribution. A–F, Gephyrin immunoreactivity at E15 (A–C) and E19 (D–F) following Fmr1 shRNA transfection. B, C, E, F, Closer looks of individual nontransfected (white asterisks) and transfected (white solid circles) neurons. The yellow arrows point to gephyrin staining that appears to be associated with NM dendrites. G–L, VGAT immunoreactivity at E15 (G–I) and E19 (J–L) following Fmr1 shRNA transfection. H, I, K, L, Closer looks of individual nontransfected (white asterisks) and transfected (white solid circles) neurons. M, N, Bar charts of the densities of gephyrin- (M) and VGAT- (N) immunoreactive puncta in nontransfected (black bars; EGFP−) and transfected (green bars; EGFP+) neurons. *p < 0.05. Data are presented as mean ± SD with individual data points. Each data point represents one neuron. Data are compiled from five to seven animals; the number of neurons is listed above each bar. All images were at single focus planes. Scale bars: (in A) A, D, G, J, 10 μm; (in B) B, C, E, F, H, I, K, L, 10 μm.
FMRP knockdown in NM neurons compromises excitatory neurotransmission
Using whole-cell recordings, we examined the effect of FMRP knockdown on NM neuronal properties including intrinsic properties and excitatory transmission. We chose to perform the electrophysiological experiments at E15, because at this age, NM neurons displayed dramatic differences in their morphology (especially the presence and the amount of dendrites) between transfected and nontransfected cells. To avoid complications introduced by topographical differences in neuronal properties (Fukui and Ohmori, 2004; Oline and Burger, 2014; Oline et al., 2016), we recorded paired NM neurons located in the middle and rostral regions of the NM, and compared the measured properties using paired t test (Table 3). First, we examined passive neuronal properties. We detected no differences in the RMP or Rin (Fig. 10A,B; n = 13 pairs of neurons). The total Cm of EGFP-labeled (EGFP+) neurons was significantly larger than that of control (EGFP−) neurons (Fig. 10C), consistent with our observation of morphological changes (Fig. 10C), with the EGFP+ neuron possessing more dendrites than the nearby EGFP− neuron recorded in the same brain slice.
Figure 10.

Effects of knockdown of FMRP on NM neuronal properties at E15. A–C, On passive neuronal properties. The Cm of EGFP+ neurons was significantly larger than that of control (EGFP−) neurons, whereas no differences were detected in the RMP or Rin (n = 13 pairs of cells). Biocytin staining after electrophysiological recordings revealed that a sample EGFP+ neuron (yellow arrow) possessed more dendrites than the nearby EGFP− neuron (white arrow) in the same brain slice. D–I, On sEPSCs. Representative sEPSC recordings from a paired EGFP− and EGFP+ NM neurons are shown in D, with the averaged traces (darker solid traces) overlapping with the detected individual events (gray traces). When normalized to the peak, the two averaged sEPSCs exhibit apparent differences in the rising and decay phase (E). In population data, EGFP+ neurons show smaller sEPSC amplitude, and slower kinetics including increased 10–90% rise time as well as increased decay time constant (tau; n = 12 pairs). J–M, On evoked EPSCs. The maximal EPSC amplitude of EGFP+ neurons was smaller than that of EGFP− neurons. The PPR (measured at the pulse interval of 20 ms) of EGFP+ neurons was higher than that of EGFP− neurons, suggesting reduced release probability in FMRP knockdown neurons (n = 7 pairs). Cells were voltage-clamped at −70 mV. Bars represent mean ± SD. ***p < 0.001, **p < 0.01, *p < 0.05 (paired t test). Scale bar: (in C), 20 μm.
FMRP targets synaptic proteins involved in neurotransmission (for review, see Contractor et al., 2015). We examined the effects of FMRP knockdown on synaptic excitation by comparing both sEPSCs (Fig. 10D–I) and evoked EPSCs (Fig. 10J–M) between EGFP+ and EGFP− neurons (Table 3). For sEPSCs, the frequency was not altered (Fig. 10F; n = 12 pairs). EGFP+ neurons showed smaller sEPSC amplitude (Fig. 10G; n = 12 pairs), and slower kinetics including significantly increased 10–90% rise time (Fig. 10H; n = 12 pairs) as well as decay time constant (tau; Fig. 10I; n = 12 pairs). The evoked EPSCs in EGFP+ neurons appeared to be more graded than EGFP− neurons (Fig. 10J), with the sample EGFP− neuron responding with all-or-none EPSCs in response to gradually increasing stimulus intensities. The maximal EPSC amplitude of EGFP+ neurons is smaller than that of EGFP− neurons (Fig. 10K; n = 7 pairs), consistent with the change in sEPSC amplitudes. The pair-pulse ratio (PPR; measured at a pulse interval of 20 ms) of EGFP+ neurons was higher than that of EGFP− neurons (Fig. 10L,M; n = 7 pairs), suggesting altered release probability and short-term plasticity in FMRP knockdown neurons.
Discussion
In this study, we selectively manipulated postsynaptic FMRP levels and examined the effects on dendritic maturation and synaptogenesis. We provide the first in vivo evidence in vertebrate brains that (1) cell-autonomous FMRP influences both dendritic growth and pruning, (2) postsynaptic FMRP deficiency results in trans-synaptic structural changes in presynaptic terminals at excitatory synapses, and (3) postsynaptic FMRP deficiency leads to compromised neurotransmission. We also raise the possibility that developmentally transient dendritic deficits may account, at least partially, for abnormal formation and maturation of excitatory synapses.
Autonomous FMRP is important during multiple stages of dendritic development
Our finding that FMRP is important for early dendritic branch growth is consistent with previous culture studies that show fewer and less complex neurites of mouse Fmr1 KO neurons (Castrén et al., 2005). This importance also applies to adult newborn neurons in the dentate gyrus of Fmr1 KO mice (Guo et al., 2015). In contrast, neurons have more dendritic endings in dFmr1-null Drosophila larvae than in wild-type (Lee et al., 2003), probably due to dendritic assessment at distinct developmental stages or interspecies variation. This study provides the first in vivo evidence in vertebrate brains that FMRP deficiency leads to compromised dendritic growth before the onset of subsequent pruning processes. A role of FMRP in dendritic pruning was previously suggested based on observations of increased numbers of dendritic trees/branches in Fmr1 KO brains after mature (Zhang et al., 2001; Galvez et al., 2003, 2005; Pan et al., 2004). It is unknown whether the extra/longer dendrites in the mature brains result from compromised dendritic pruning or dendritic overgrowth at earlier stages. This study demonstrates that NM neurons with less FMRP actually have less TDBL at E11 before dendritic pruning begins and a delay in completing dendritic pruning from E15 to E19, indicating that FMRP reduction indeed negatively affects dendritic pruning process. Completion of dendritic pruning of NM neurons, although delayed, is probably due to compensatory mechanisms of neuronal self-repairing.
It is interesting to note that dendritic alterations in Fmr1 knock-out mice vary depending on a multitude of factors across studies. In contrast to enhanced dendritic arborization in somatosensory cortex and olfactory bulb (Galvez et al., 2003, 2005), pyramidal neurons in the visual cortex display reduced dendrite length and branching (Restivo et al., 2005). In spinal cord and somatosensory cortex, however, the number of dendritic arbors is normal but arbor patterning is altered (Thomas et al., 2008; Till et al., 2012). These cell-type-specific phenotypes in response to FMRP loss do not necessarily indicate that FMRP regulates dendritic branching under distinct mechanisms across cell types. It is equally possible that FMRP reduction affects dendritic branching with a common action, while distinct dendritic development profiles across cell types in normal brains account for various morphological phenotypes at specific developmental stages of FXS. One such common action could be that FMRP reduction generally slows down each step of dendritic structural changes, instead of preferentially influencing arbor pruning. In other words, neurons with FMRP deficiency may present either more or less dendritic arbors, depending on the age, species, strains, and cell types. Indeed, we have found that NM neurons with reduced FMRP have less TDBL at E11, more TDBL at E15, and no difference at E19 compared with normal neurons. This general “slowing down” action is also supported by the notion that FMRP influences axonal or dendritic structure by regulating cytoskeleton regulators including MAP1B (Zhang et al., 2001) and Ras-related C3 botulinum toxin substrate 1 (Lee et al., 2003). If this is a common mechanism across cell types, FMRP deficiency is expected to reduce cytoskeleton dynamics regardless if an arbor is growing or retracting.
Postsynaptic FMRP regulates synaptogenesis
A second finding of this study is that selective reduction of FMRP postsynaptically leads to long-lasting deficits in excitatory presynaptic terminals. This observation strongly implicates that presynaptic defects, as observed in global Fmr1 KO models, may be induced partially by the secondary influence of postsynaptic alterations. Consistent with our observations in endbulbs, FMRP deficiency also induces altered morphology of large excitatory presynaptic terminals, the calyx of Held in the medial nucleus of the trapezoid body. In Fmr1 knock-out mice, calyces show a higher density of small boutons in the knock-out mice than wild-type controls (Wang et al., 2015), resembling the pseudopodium-like terminals as observed in the chicken NM following FMRP knockdown.
One remaining question is whether the abnormal endbulb formation observed here is associated with the delay in dendritic pruning. It is logical to assume that a large adendritic cell body surface is required for the formation of giant-sized excitatory endbulb terminals. The induced extensive dendrites from NM cell bodies may prevent endbulb formation at E15. Intriguingly, upon the completion of delayed dendritic pruning, endbulb synapses remain to be abnormal at E19. One interpretation is that endbulb synaptic development has a more rigid critical period compared with dendritic pruning. Interestingly, we did not find detectable changes in inhibitory presynaptic VGAT clustering, suggesting that inhibitory inputs can, at least structurally, target NM cell bodies with dendrites. This targeting was not affected by the failure of postsynaptic protein (gephyrin) clustering on the cell membrane at E15. It is possible that postsynaptic FMRP reduction may affect other aspects or the function of inhibitory synapses. Alternatively, long-lasting deficits in inhibitory synapses following global FMRP loss may result from presynaptic and/or astrocyte-specific mechanisms (Korn et al., 2012; Braat et al., 2015; Wang et al., 2016; Rotschafer and Cramer, 2017).
Role of postsynaptic FMRP in neurotransmission
Following FMRP reduction, NM neurons displayed increased cell capacitance at E15, consistent with their larger volume of dendrites, even though their cell body volume was reduced. The accompany changes in glutamatergic neurotransmission can also be attributed partially to excess dendrites of FMRP-reduced neurons and the presence of terminals on these dendrites. Based on the cable properties of dendrites (Rall, 1967; Rall et al., 1967), synaptic inputs with distant loci from the spike initiation zone are attenuated and filtered when traveling along the dendritic membrane. FMRP-reduced neurons would have stronger dendritic filtering, resulting in smaller amplitudes and slower kinetics of the synaptic responses recorded at the soma. In addition, functional AMPA receptors (AMPAR) may play a part in altered EPSC amplitude and kinetic. In Fmr1 knock-out animal models, trafficking of AMPAR subunit GluR1 is impaired (Hu et al., 2008) and the expression of GluR1 is reduced in dendrites (Li et al., 2002). Finally, a presynaptic effect for the changes in EPSCs is implicated by the reduced terminal size and the increased PPR. However, the sEPSC frequency was not significantly reduced, raising the possibility that the inferred decrease in glutamate release may only occur under strong stimulus intensity, because the PPR was calculated with EPSCs elicited at the maximal stimulus intensity. It is worth noting that although FMRP targets many mRNAs of synaptic proteins, the effects of the loss-of-function of FMRP on neurotransmission are usually modest, possibly due to cellular compensatory mechanisms (for review, see Contractor et al., 2015). Therefore, the difference in input location, rather than the level of synaptic proteins, might be a major mechanism underlying the altered physiology in NM neurons with less FMRP.
The importance of postsynaptic FMRP in dendritic pruning and synaptogenesis during development is in line with previous observations that postsynaptic FMRP is acutely involved in these processes under in vitro and culture conditions (Pfeiffer and Huber, 2007; Pfeiffer et al., 2010; Deng et al., 2013). Although no significant difference was reported in functional connectivity attributable to postsynaptic Fmr1 genotype in the mosaic network (Hanson and Madison, 2007), regulation by FMRP on physiological properties is broad and the mechanisms diverse (Contractor et al., 2015). Future studies of selective manipulations of spiral ganglion cells and NM neurons, either alone or both, will help further clarify specific roles of presynaptic and postsynaptic FMRP, as well as their mutual influence, in synaptic and connectivity development.
Footnotes
This work was supported by the National Institute on Deafness and Other Communication Disorders (DC 13074 to Y.W. and DC 016054 to Y.L.), the United States–Israel Binational Science Foundation (Y.W.), and Genentech Grant (G-47608 to D.A.R.Z.). We thank David R. Morris (University of Washington) for help in DNA cloning and valuable comments to the paper.
The authors declare no competing financial interests.
References
- Beebe K, Wang Y, Kulesza R (2014) Distribution of fragile X mental retardation protein in the human auditory brainstem. Neuroscience 273:79–91. 10.1016/j.neuroscience.2014.05.006 [DOI] [PubMed] [Google Scholar]
- Braat S, D'Hulst C, Heulens I, De Rubeis S, Mientjes E, Nelson DL, Willemsen R, Bagni C, Van Dam D, De Deyn PP, Kooy RF (2015) The GABAA receptor is an FMRP target with therapeutic potential in fragile X syndrome. Cell Cycle 14:2985–2995. 10.4161/15384101.2014.989114 [DOI] [PMC free article] [PubMed] [Google Scholar]
- Brown MR, Kaczmarek LK (2011) Potassium channel modulation and auditory processing. Hear Res 279:32–42. 10.1016/j.heares.2011.03.004 [DOI] [PMC free article] [PubMed] [Google Scholar]
- Burgess A, Vigneron S, Brioudes E, Labbé JC, Lorca T, Castro A (2010) Loss of human greatwall results in G2 arrest and multiple mitotic defects due to deregulation of the cyclin B-Cdc2/PP2A balance. Proc Natl Acad Sci U S A 107:12564–12569. 10.1073/pnas.0914191107 [DOI] [PMC free article] [PubMed] [Google Scholar]
- Castrén M, Tervonen T, Kärkkäinen V, Heinonen S, Castrén E, Larsson K, Bakker CE, Oostra BA, Akerman K (2005) Altered differentiation of neural stem cells in fragile X syndrome. Proc Natl Acad Sci U S A 102:17834–17839. 10.1073/pnas.0508995102 [DOI] [PMC free article] [PubMed] [Google Scholar]
- Code RA, Burd GD, Rubel EW (1989) Development of GABA immunoreactivity in brainstem auditory nuclei of the chick: ontogeny of gradients in terminal staining. J Comp Neurol 284:504–518. 10.1002/cne.902840403 [DOI] [PubMed] [Google Scholar]
- Contractor A, Klyachko VA, Portera-Cailliau C (2015) Altered neuronal and circuit excitability in fragile X syndrome. Neuron 87:699–715. 10.1016/j.neuron.2015.06.017 [DOI] [PMC free article] [PubMed] [Google Scholar]
- Cramer KS, Fraser SE, Rubel EW (2000) Embryonic origins of auditory brain-stem nuclei in the chick hindbrain. Dev Biol 224:138–151. 10.1006/dbio.2000.9779 [DOI] [PubMed] [Google Scholar]
- Cramer KS, Bermingham-McDonogh O, Krull CE, Rubel EW (2004) EphA4 signaling promotes axon segregation in the developing auditory system. Dev Biol 269:26–35. 10.1016/j.ydbio.2004.01.002 [DOI] [PubMed] [Google Scholar]
- Deng PY, Sojka D, Klyachko VA (2011) Abnormal presynaptic short-term plasticity and information processing in a mouse model of fragile X syndrome. J Neurosci 31:10971–10982. 10.1523/JNEUROSCI.2021-11.2011 [DOI] [PMC free article] [PubMed] [Google Scholar]
- Deng PY, Rotman Z, Blundon JA, Cho Y, Cui J, Cavalli V, Zakharenko SS, Klyachko VA (2013) FMRP regulates neurotransmitter release and synaptic information transmission by modulating action potential duration via BK channels. Neuron 77:696–711. 10.1016/j.neuron.2012.12.018 [DOI] [PMC free article] [PubMed] [Google Scholar]
- Doll CA, Broadie K (2016) Neuron class-specific requirements for fragile X mental retardation protein in critical period development of calcium signaling in learning and memory circuitry. Neurobiol Dis 89:76–87. 10.1016/j.nbd.2016.02.006 [DOI] [PMC free article] [PubMed] [Google Scholar]
- Fukui I, Ohmori H (2004) Tonotopic gradients of membrane and synaptic properties for neurons of the chicken nucleus magnocellularis. J Neurosci 24:7514–7523. 10.1523/JNEUROSCI.0566-04.2004 [DOI] [PMC free article] [PubMed] [Google Scholar]
- Galvez R, Gopal AR, Greenough WT (2003) Somatosensory cortical barrel dendritic abnormalities in a mouse model of the fragile X mental retardation syndrome. Brain Res 971:83–89. 10.1016/S0006-8993(03)02363-1 [DOI] [PubMed] [Google Scholar]
- Galvez R, Smith RL, Greenough WT (2005) Olfactory bulb mitral cell dendritic pruning abnormalities in a mouse model of the fragile-X mental retardation syndrome: further support for FMRP's involvement in dendritic development. Brain Res Dev Brain Res 157:214–216. 10.1016/j.devbrainres.2005.03.010 [DOI] [PubMed] [Google Scholar]
- Garcia-Pino E, Gessele N, Koch U (2017) Enhanced excitatory connectivity and disturbed sound processing in the auditory brainstem of fragile X mice. J Neurosci 37:7403–7419. 10.1523/JNEUROSCI.2310-16.2017 [DOI] [PMC free article] [PubMed] [Google Scholar]
- Guo W, Polich ED, Su J, Gao Y, Christopher DM, Allan AM, Wang M, Wang F, Wang G, Zhao X (2015) Fragile X proteins FMRP and FXR2P control synaptic GluA1 expression and neuronal maturation via distinct mechanisms. Cell Rep 11:1651–1666. 10.1016/j.celrep.2015.05.013 [DOI] [PMC free article] [PubMed] [Google Scholar]
- Hagerman RJ, Berry-Kravis E, Hazlett HC, Bailey DB Jr, Moine H, Kooy RF, Tassone F, Gantois I, Sonenberg N, Mandel JL, Hagerman PJ (2017) Fragile X syndrome. Nat Rev Dis Primers 3:17065. 10.1038/nrdp.2017.65 [DOI] [PubMed] [Google Scholar]
- Hamburger V, Hamilton HL (1951) A series of normal stages in the development of the chick embryo. J Morphol 88:49–92. 10.1002/jmor.1050880104 [DOI] [PubMed] [Google Scholar]
- Hanson JE, Madison DV (2007) Presynaptic FMR1 genotype influences the degree of synaptic connectivity in a mosaic mouse model of fragile X syndrome. J Neurosci 27:4014–4018. 10.1523/JNEUROSCI.4717-06.2007 [DOI] [PMC free article] [PubMed] [Google Scholar]
- Higashimori H, Schin CS, Chiang MS, Morel L, Shoneye TA, Nelson DL, Yang Y (2016) Selective deletion of astroglial FMRP dysregulates glutamate transporter GLT1 and contributes to fragile X syndrome phenotypes in vivo. J Neurosci 36:7079–7094. 10.1523/JNEUROSCI.1069-16.2016 [DOI] [PMC free article] [PubMed] [Google Scholar]
- Hinds HL, Ashley CT, Sutcliffe JS, Nelson DL, Warren ST, Housman DE, Schalling M (1993) Tissue specific expression of FMR-1 provides evidence for a functional role in fragile X syndrome. Nat Genet 3:36–43. 10.1038/ng0193-36 [DOI] [PubMed] [Google Scholar]
- Hodges JL, Yu X, Gilmore A, Bennett H, Tjia M, Perna JF, Chen CC, Li X, Lu J, Zuo Y (2017) Astrocytic contributions to synaptic and learning abnormalities in a mouse model of fragile X syndrome. Biol Psychiatry 82:139–149. 10.1016/j.biopsych.2016.08.036 [DOI] [PMC free article] [PubMed] [Google Scholar]
- Hu H, Qin Y, Bochorishvili G, Zhu Y, van Aelst L, Zhu JJ (2008) Ras signaling mechanisms underlying impaired GluR1-dependent plasticity associated with fragile X syndrome. J Neurosci 28:7847–7862. 10.1523/JNEUROSCI.1496-08.2008 [DOI] [PMC free article] [PubMed] [Google Scholar]
- Jacobs S, Nathwani M, Doering LC (2010) Fragile X astrocytes induce developmental delays in dendrite maturation and synaptic protein expression. BMC Neurosci 11:132. 10.1186/1471-2202-11-132 [DOI] [PMC free article] [PubMed] [Google Scholar]
- Jawaid S, Kidd GJ, Wang J, Swetlik C, Dutta R, Trapp BD (2018) Alterations in CA1 hippocampal synapses in a mouse model of fragile X syndrome. Glia 66:789–800. 10.1002/glia.23284 [DOI] [PMC free article] [PubMed] [Google Scholar]
- Jhaveri S, Morest DK (1982) Sequential alterations of neuronal architecture in nucleus magnocellularis of the developing chicken: a Golgi study. Neuroscience 7:837–853. 10.1016/0306-4522(82)90046-X [DOI] [PubMed] [Google Scholar]
- Korn MJ, Koppel SJ, Li LH, Mehta D, Mehta SB, Seidl AH, Cramer KS (2012) Astrocyte-secreted factors modulate the developmental distribution of inhibitory synapses in nucleus laminaris of the avian auditory brainstem. J Comp Neurol 520:1262–1277. 10.1002/cne.22786 [DOI] [PMC free article] [PubMed] [Google Scholar]
- Lee A, Li W, Xu K, Bogert BA, Su K, Gao FB (2003) Control of dendritic development by the Drosophila fragile X-related gene involves the small GTPase Rac1. Development 130:5543–5552. 10.1242/dev.00792 [DOI] [PubMed] [Google Scholar]
- Li J, Pelletier MR, Perez Velazquez JL, Carlen PL (2002) Reduced cortical synaptic plasticity and GluR1 expression associated with fragile X mental retardation protein deficiency. Mol Cell Neurosci 19:138–151. 10.1006/mcne.2001.1085 [DOI] [PubMed] [Google Scholar]
- Lurie DI, Rubel EW (1994) Astrocyte proliferation in the chick auditory brainstem following cochlea removal. J Comp Neurol 346:276–288. 10.1002/cne.903460207 [DOI] [PubMed] [Google Scholar]
- McCloy RA, Rogers S, Caldon CE, Lorca T, Castro A, Burgess A (2014) Partial inhibition of Cdk1 in G 2 phase overrides the SAC and decouples mitotic events. Cell Cycle 13:1400–1412. 10.4161/cc.28401 [DOI] [PMC free article] [PubMed] [Google Scholar]
- Monsivais P, Rubel EW (2001) Accommodation enhances depolarizing inhibition in central neurons. J Neurosci 21:7823–7830. 10.1523/JNEUROSCI.21-19-07823.2001 [DOI] [PMC free article] [PubMed] [Google Scholar]
- Oline SN, Burger RM (2014) Short-term synaptic depression is topographically distributed in the cochlear nucleus of the chicken. J Neurosci 34:1314–1324. 10.1523/JNEUROSCI.3073-13.2014 [DOI] [PMC free article] [PubMed] [Google Scholar]
- Oline SN, Ashida G, Burger RM (2016) Tonotopic optimization for temporal processing in the cochlear nucleus. J Neurosci 36:8500–8515. 10.1523/JNEUROSCI.4449-15.2016 [DOI] [PMC free article] [PubMed] [Google Scholar]
- O'Neil JN, Connelly CJ, Limb CJ, Ryugo DK (2011) Synaptic morphology and the influence of auditory experience. Hear Res 279:118–130. 10.1016/j.heares.2011.01.019 [DOI] [PMC free article] [PubMed] [Google Scholar]
- Pacey LK, Xuan IC, Guan S, Sussman D, Henkelman RM, Chen Y, Thomsen C, Hampson DR (2013) Delayed myelination in a mouse model of fragile X syndrome. Hum Mol Genet 22:3920–3930. 10.1093/hmg/ddt246 [DOI] [PubMed] [Google Scholar]
- Pan L, Zhang YQ, Woodruff E, Broadie K (2004) The Drosophila fragile X gene negatively regulates neuronal elaboration and synaptic differentiation. Curr Biol 14:1863–1870. 10.1016/j.cub.2004.09.085 [DOI] [PubMed] [Google Scholar]
- Patel AB, Hays SA, Bureau I, Huber KM, Gibson JR (2013) A target cell-specific role for presynaptic Fmr1 in regulating glutamate release onto neocortical fast-spiking inhibitory neurons. J Neurosci 33:2593–2604. 10.1523/JNEUROSCI.2447-12.2013 [DOI] [PMC free article] [PubMed] [Google Scholar]
- Patel AB, Loerwald KW, Huber KM, Gibson JR (2014) Postsynaptic FMRP promotes the pruning of cell-to-cell connections among pyramidal neurons in the L5A neocortical network. J Neurosci 34:3413–3418. 10.1523/JNEUROSCI.2921-13.2014 [DOI] [PMC free article] [PubMed] [Google Scholar]
- Pfeiffer BE, Huber KM (2007) Fragile X mental retardation protein induces synapse loss through acute postsynaptic translational regulation. J Neurosci 27:3120–3130. 10.1523/JNEUROSCI.0054-07.2007 [DOI] [PMC free article] [PubMed] [Google Scholar]
- Pfeiffer BE, Zang T, Wilkerson JR, Taniguchi M, Maksimova MA, Smith LN, Cowan CW, Huber KM (2010) Fragile X mental retardation protein is required for synapse elimination by the activity-dependent transcription factor MEF2. Neuron 66:191–197. 10.1016/j.neuron.2010.03.017 [DOI] [PMC free article] [PubMed] [Google Scholar]
- Rall W. (1967) Distinguishing theoretical synaptic potentials computed for different soma-dendritic distributions of synaptic input. J Neurophysiol 30:1138–1168. 10.1152/jn.1967.30.5.1138 [DOI] [PubMed] [Google Scholar]
- Rall W, Burke RE, Smith TG, Nelson PG, Frank K (1967) Dendritic location of synapses and possible mechanisms for the monosynaptic EPSP in motoneurons. J Neurophysiol 30:1169–1193. 10.1152/jn.1967.30.5.1169 [DOI] [PubMed] [Google Scholar]
- Restivo L, Ferrari F, Passino E, Sgobio C, Bock J, Oostra BA, Bagni C, Ammassari-Teule M (2005) Enriched environment promotes behavioral and morphological recovery in a mouse model for the fragile X syndrome. Proc Natl Acad Sci U S A 102:11557–11562. 10.1073/pnas.0504984102 [DOI] [PMC free article] [PubMed] [Google Scholar]
- Rotschafer SE, Cramer KS (2017) Developmental emergence of phenotypes in the auditory brainstem nuclei of Fmr1 knockout mice. eNeuro 4:ENEURO.0264–17.2017. 10.1523/ENEURO.0264-17.2017 [DOI] [PMC free article] [PubMed] [Google Scholar]
- Rotschafer SE, Razak KA (2014) Auditory processing in fragile x syndrome. Front Cell Neurosci 8:19. 10.3389/fncel.2014.00019 [DOI] [PMC free article] [PubMed] [Google Scholar]
- Rotschafer SE, Marshak S, Cramer KS (2015) Deletion of Fmr1 alters function and synaptic inputs in the auditory brainstem. PLoS One 10:e0117266. 10.1371/journal.pone.0117266 [DOI] [PMC free article] [PubMed] [Google Scholar]
- Rubel EW, Fritzsch B (2002) Auditory system development: primary auditory neurons and their targets. Annu Rev Neurosci 25:51–101. 10.1146/annurev.neuro.25.112701.142849 [DOI] [PubMed] [Google Scholar]
- Rubel EW, MacDonald GH (1992) Rapid growth of astrocytic processes in N. magnocellularis following cochlea removal. J Comp Neurol 318:415–425. 10.1002/cne.903180406 [DOI] [PubMed] [Google Scholar]
- Ruby K, Falvey K, Kulesza RJ (2015) Abnormal neuronal morphology and neurochemistry in the auditory brainstem of Fmr1 knockout rats. Neuroscience 303:285–298. 10.1016/j.neuroscience.2015.06.061 [DOI] [PubMed] [Google Scholar]
- Schecterson LC, Sanchez JT, Rubel EW, Bothwell M (2012) TrkB downregulation is required for dendrite retraction in developing neurons of chicken nucleus magnocellularis. J Neurosci 32:14000–14009. 10.1523/JNEUROSCI.2274-12.2012 [DOI] [PMC free article] [PubMed] [Google Scholar]
- Swietek B, Gupta A, Proddutur A, Santhakumar V (2016) Immunostaining of biocytin-filled and processed sections for neurochemical markers. J Vis Exp 118:e54880. 10.3791/54880 [DOI] [PMC free article] [PubMed] [Google Scholar]
- Tang ZQ, Dinh EH, Shi W, Lu Y (2011) Ambient GABA-activated tonic inhibition sharpens auditory coincidence detection via a depolarizing shunting mechanism. J Neurosci 31:6121–6131. 10.1523/JNEUROSCI.4733-10.2011 [DOI] [PMC free article] [PubMed] [Google Scholar]
- Thomas CC, Combe CL, Dyar KA, Inglis FM (2008) Modest alterations in patterns of motor neuron dendrite morphology in the Fmr1 knockout mouse model for fragile X. Int J Dev Neurosci 26:805–811. 10.1016/j.ijdevneu.2008.06.003 [DOI] [PMC free article] [PubMed] [Google Scholar]
- Till SM, Wijetunge LS, Seidel VG, Harlow E, Wright AK, Bagni C, Contractor A, Gillingwater TH, Kind PC (2012) Altered maturation of the primary somatosensory cortex in a mouse model of fragile X syndrome. Hum Mol Genet 21:2143–2156. 10.1093/hmg/dds030 [DOI] [PubMed] [Google Scholar]
- Wang L, Wang Y, Zhou S, Yang L, Shi Q, Li Y, Zhang K, Yang L, Zhao M, Yang Q (2016) Imbalance between glutamate and GABA in Fmr1 knockout astrocytes influences neuronal development. Genes 7:e45. 10.3390/genes7080045 [DOI] [PMC free article] [PubMed] [Google Scholar]
- Wang T, de Kok L, Willemsen R, Elgersma Y, Borst JG (2015) In vivo synaptic transmission and morphology in mouse models of tuberous sclerosis, fragile X syndrome, neurofibromatosis type 1, and Costello syndrome. Front Cell Neurosci 9:234. 10.3389/fncel.2015.00234 [DOI] [PMC free article] [PubMed] [Google Scholar]
- Wang X, Hong H, Brown DH, Sanchez JT, Wang Y (2017) Distinct neural properties in the low-frequency region of the chicken cochlear nucleus magnocellularis. eNeuro 4:ENEURO.0016–17.2017. 10.1523/ENEURO.0016-17.2017 [DOI] [PMC free article] [PubMed] [Google Scholar]
- Wang Y, Rubel EW (2012) In vivo reversible regulation of dendritic patterning by afferent input in bipolar auditory neurons. J Neurosci 32:11495–11504. 10.1523/JNEUROSCI.1737-12.2012 [DOI] [PMC free article] [PubMed] [Google Scholar]
- Wang Y, Sakano H, Beebe K, Brown MR, de Laat R, Bothwell M, Kulesza RJ Jr, Rubel EW (2014) Intense and specialized dendritic localization of the fragile X mental retardation protein in binaural brainstem neurons: a comparative study in the alligator, chicken, gerbil, and human. J Comp Neurol 522:2107–2128. 10.1002/cne.23520 [DOI] [PMC free article] [PubMed] [Google Scholar]
- Willemsen R, Bontekoe CJ, Severijnen LA, Oostra BA (2002) Timing of the absence of FMR1 expression in full mutation chorionic villi. Hum Genet 110:601–605. 10.1007/s00439-002-0723-5 [DOI] [PubMed] [Google Scholar]
- Zarnescu DC, Shan G, Warren ST, Jin P (2005) Come FLY with us: toward understanding fragile X syndrome. Genes Brain Behav 4:385–392. 10.1111/j.1601-183X.2005.00136.x [DOI] [PubMed] [Google Scholar]
- Zhang YQ, Bailey AM, Matthies HJ, Renden RB, Smith MA, Speese SD, Rubin GM, Broadie K (2001) Drosophila fragile X-related gene regulates the MAP1B homolog futsch to control synaptic structure and function. Cell 107:591–603. 10.1016/S0092-8674(01)00589-X [DOI] [PubMed] [Google Scholar]
- Zorio DA, Jackson CM, Liu Y, Rubel EW, Wang Y (2017) Cellular distribution of the fragile X mental retardation protein in the mouse brain. J Comp Neurol 525:818–849. 10.1002/cne.24100 [DOI] [PMC free article] [PubMed] [Google Scholar]