

Airway epithelium is both the primary target of and the first defense against respiratory syncytial virus (RSV). Whether RSV replicates and spreads to adjacent epithelial cells depends on the quality of their innate immune responses. A549 and BEAS-2B are alveolar and bronchial epithelial cell lines, respectively, that are often used to study RSV infection. We show that A549 cells are permissive to RSV infection and express genes characteristic of a proinflammatory response. In contrast, BEAS-2B cells restrict infection and express genes characteristic of an antiviral response associated with expression of type I and III interferons. Transcriptome analysis of constitutive gene expression revealed patterns that may predict the response of each cell line to infection. This study suggests that restrictive and permissive cell lines may provide a model for identifying critical mediators of local control of infection and stresses the importance of the constitutive antiviral state for the response to viral challenge.
KEYWORDS: respiratory epithelial cells, interferon, interferon regulatory factor (IRF), respiratory syncytial virus, interferon-stimulated genes, cytokine, cytokines, interferons
ABSTRACT
Respiratory syncytial virus (RSV) infects small foci of respiratory epithelial cells via infected droplets. Infection induces expression of type I and III interferons (IFNs) and proinflammatory cytokines, the balance of which may restrict viral replication and affect disease severity. We explored this balance by infecting two respiratory epithelial cell lines with low doses of recombinant RSV expressing green fluorescent protein (rgRSV). A549 cells were highly permissive, whereas BEAS-2B cells restricted infection to individual cells or small foci. After infection, A549 cells expressed higher levels of IFN-β-, IFN-λ-, and NF-κB-inducible proinflammatory cytokines. In contrast, BEAS-2B cells expressed higher levels of antiviral interferon-stimulated genes, pattern recognition receptors, and other signaling intermediaries constitutively and after infection. Transcriptome analysis revealed that constitutive expression of antiviral and proinflammatory genes predicted responses by each cell line. These two cell lines provide a model for elucidating critical mediators of local control of viral infection in respiratory epithelial cells.
IMPORTANCE Airway epithelium is both the primary target of and the first defense against respiratory syncytial virus (RSV). Whether RSV replicates and spreads to adjacent epithelial cells depends on the quality of their innate immune responses. A549 and BEAS-2B are alveolar and bronchial epithelial cell lines, respectively, that are often used to study RSV infection. We show that A549 cells are permissive to RSV infection and express genes characteristic of a proinflammatory response. In contrast, BEAS-2B cells restrict infection and express genes characteristic of an antiviral response associated with expression of type I and III interferons. Transcriptome analysis of constitutive gene expression revealed patterns that may predict the response of each cell line to infection. This study suggests that restrictive and permissive cell lines may provide a model for identifying critical mediators of local control of infection and stresses the importance of the constitutive antiviral state for the response to viral challenge.
INTRODUCTION
Respiratory syncytial virus (RSV) causes a wide spectrum of disease ranging from mild upper respiratory tract infections to severe bronchiolitis and pneumonia. Most infants have experienced at least one RSV infection by their second birthday, and RSV is a major cause of hospitalization and death worldwide in this age group (1). Infants that experience a severe lower respiratory tract infection with RSV are at greater risk for developing childhood wheezing and asthma (2, 3), depending on cofactors, such as young age, premature birth, host genetics, the infecting viral strain, and the quality of the host innate immune response.
Respiratory epithelial cells (REC) are both the primary target for RSV and the first line of defense against the virus. Natural infection occurs after self-inoculation or inhalation of aerosolized droplets that contain viral particles, resulting in infection of small foci of apical REC (4). Upon infection, RSV stimulates pattern recognition receptors (PRRs), primarily RIG-I, but also Toll-like receptor 3 (TLR3) (5), MDA-5, TLR2, and TLR4 (which binds to the RSV F protein) (6–8). Activation of these PRRs by RSV infection initiates the host innate immune response through activation of multiple transcriptional networks, including those mediated by IRF3 and NF-κB. The downstream consequences include expression of type I and III interferons (IFNs), antiviral IFN-stimulated genes (ISGs), and a variety of proinflammatory cytokines and chemokines (9).
The roles of proinflammatory mediators in RSV infection have been explored in mouse models and clinical studies. Tumor necrosis factor alpha (TNF-α), interleukin 1 (IL-1), and IL-6 have all been associated with more severe clinical illness (10); however, each has both beneficial and pathogenic effects in RSV infection. For example, TNF-α suppresses viral replication (11, 12) but was also recently reported to be a biomarker for recurrent wheezing after infection with RSV in children (13), while IL-1β has been reported both as indicating an effective innate response and as a mediator of severe RSV pathology (14, 15). Similarly, chemokines such as CCL5 recruit leukocytes that participate in local protection against RSV (16), while CXCL8 attracts neutrophils that are associated with high pathogenicity and severe disease that requires hospitalization or assisted ventilation (17). The divergent functional roles of these mediators, however, are dependent on their levels of expression and the context of the infection.
The type I (IFN-αs, IFN-β, IFN-ω, and others) and type III (IFN-λ1 to -λ3) IFNs are produced in response to many viruses and induce an antiviral state (18). Each IFN type signals through its own heterodimeric receptor: type I IFNs through IFNAR1/2 and type III IFNs through IFNLR1 and IL10R2. Each receptor activates the same STAT1/2 signaling pathway, leading to expression of many antiviral ISGs. Whether type I and III IFNs defend against natural RSV infection is unclear, in part because they are not consistently detected in studies of RSV-infected infants and children (19, 20). It is also possible, however, that IRF3 and NF-κB activation directly induces expression of well-characterized (e.g., viperin) or unidentified critical antiviral mediators, including many ISGs. Alternatively, IFNs may be most highly expressed early in infection prior to diagnosis and measurement or at levels below the limits of detection by standard enzyme-linked immunosorbent assays (ELISAs) (21). Finally, mouse models indicated that expression of these IFNs is associated with viral strains that exhibit milder disease and less wheezing illness (22).
Because primary REC are difficult to obtain, have a short life span in vitro, and may vary among donors, immortalized REC lines are often used to model the innate response to RSV infection. Among the available cell lines, the A549 type II alveolar epithelial carcinoma cell line and the BEAS-2B simian virus 40 (SV40)-transformed bronchial epithelial cell line are commonly used, and data are often extrapolated from one cell line to another and to primary REC. We demonstrate here that A549 cells are highly susceptible to RSV infection, whereas BEAS-2B cells are resistant to infection. Furthermore, we explore whether differences in host innate responses between BEAS-2B and A549 cells can be used to model restrictive and permissive local infections by RSV. We treated each cell line with low multiplicities of infection (MOIs) of a recombinant A2 strain of RSV that expresses green fluorescent protein (rgRSV) to simulate inhalation of infected microdroplets and then examined the spread of infection and expression of various innate mediators at multiple time points. We show that BEAS-2B cells dynamically restricted rgRSV to confined foci and expressed high basal and virus-induced levels of antiviral ISGs; transcription factors, such as IRF1, IRF7, and IRF9; and signaling intermediates, such as RIG-I. In contrast, A549 cells were permissive to rgRSV, which spread throughout the culture, and expressed high basal or virus-induced levels of proinflammatory mediators. To further examine the differences in basal gene expression, we performed RNA sequencing of the two cell lines. Our data revealed that, in addition to the ISGs, a number of other genes, including transcription factor genes, are differentially expressed between the two cell lines. Taken together, our results suggest that high basal expression of ISGs in BEAS-2B cells may provide the first line of defense against incoming viral pathogens, and thus, these cells are better oriented to restrict viral infection than A549 cells.
RESULTS
Spread of RSV infection in BEAS-2B cells is restricted compared to A549 cells.
Typical of respiratory pathogens, RSV often infects small foci of the nasal and bronchial epithelium after self-inoculation or inhalation of small droplets that contain viral particles (4). We explored how respiratory epithelia contain these foci by infecting A549 type II alveolar epithelial cells and BEAS-2B bronchial epithelial cells with increasing MOIs of a recombinant A2 strain of RSV that expresses enhanced GFP (rgRSV). This version of rgRSV contains the GFP gene placed in the 5th gene position, between the RSV P and M genes: thus, there was no change in sequence or position for the viral promoter and the first four RSV genes, including the first and second genes (NS1 and NS2), which encode IFN antagonists (23). As shown by confocal imaging in Fig. 1A, at MOIs of 0.1 and 0.3, rgRSV spread to infect 50% or more of the A549 cells at 48 h postinfection (hpi) but was limited to small foci of infected BEAS-2B cells. At higher MOIs (1 and 3) at this time point, however, each cell line was highly infected, and as expected, infection levels increased with increased inoculation doses. Measurement of RSV M mRNA by real-time (RT)-qPCR at 24 and 48 hpi in the same experiments (Fig. 1B) confirmed these differences. At low MOIs (0.1 and 0.3), these differences persisted through 96 hpi (Fig. 1C and D) and were similar for the NS1, G, F, and L genes (not shown). We then explored the differences further with hourly image capture using a live-cell analysis system that permits sequential images of the same field over time. Figures 1E and F and Movies S1 and S2 in the supplemental material confirm widespread infection of the A549 cells compared to the small foci of infected BEAS-2B cells and demonstrate divergence between the cell types as early as 8 hpi. Taken together, the cell imaging in Fig. 1C and Movies S1 and S2, the quantification of infection from the live-cell images (Fig. 1E and F), and mRNA from similar experiments (Fig. 1D) demonstrate that, although there appears to be little initial difference in infectivity between the cell types with low doses of RSV, at later time points BEAS-2B cells are significantly less infected than A549 cells.
FIG 1.

rgRSV spreads in A549 cells, but not BEAS-2B cells. A549 and BEAS-2B cells were grown on coverslips and infected with rgRSV (mock infection was medium only), incubated for the indicated times, and stained with Hoechst 33258 for confocal imaging. RNA and supernatants were harvested from parallel cultures. (A and B) Dose response of rgRSV at 48 hpi. The confocal images represent the results of one of three experiments (A) and were supported by RT-qPCR of the RSV M gene at 24 (n = 3) and 48 (n = 5) hpi (B). (C and D) (C) Time course of rgRSV infection at an MOI of 0.1. The data represent the results of one of three experiments. (D) Differences between the cell lines were supported by RT-qPCR of the RSV M gene in A549 or BEAS-2B cells (n = 8) at MOIs of 0.1 and 0.3. The boxes and black line indicate the range and geometric mean. Statistical differences between infected cell lines at each time point were calculated using a one-way ANOVA model without adjustment for mock infection on log10-transformed values, as described in Materials and Methods. ++, P < 0.05 for A549 compared to BEAS-2B at MOIs of 0.1 and 0.3. (E and F) Confluent cultures of A549 and BEAS-2B cells were infected with RSV, and fluorescence images were captured each hour from 0 to 44 hpi to create time lapse videos (see Movies S1 and S2 in the supplemental material). (E) Hourly measurements of percentages of the area of the confluent culture infected at an MOI of 0.3 that were GFP+. (F) Summary data for BEAS-2B and A549 confluent cultures (n = 7 and 18, respectively) infected at an MOI of 0.1. Differences between the cell lines were analyzed for each time point by multiple t tests according to the Holm-Sidak method. *, P < 0.0001 (for each time point from 8 hpi through 44 hpi). The error bars indicate standard deviations (SD).
RSV infection induces differential expression of type I and III IFNs, ISGs, and proinflammatory cytokines by A549 and BEAS-2B cells.
We next asked whether differences in RSV infectivity and the robustness of RSV gene expression between the two cell lines correlated with differences in expression of type I and/or type III IFN. Each cell line constitutively expressed low levels of IFNB1 and IFNL1 (Fig. 2A), which were significantly enhanced at 48 hpi (Fig. 2A). Additionally, each cell line expressed IFNL2 after RSV infection, but only the A549 cells expressed IFNL3 (Fig. 2A). Consistent with gene expression, Fig. 2B shows that infection with rgRSV at MOIs of 1.0 and 3.0 induced each cell line to secrete IFN-β and IFN-λ proteins, but at the lower MOIs (0.1 and 0.3), these IFNs were detectable only in A549 cultures. We explored this further by infecting each cell line at an MOI of 0.1 or 0.3 for up to 96 h and found that expression of the IFNs by either cell line plateaued at 48 hpi (Fig. 2C). Figure 2D shows that these low MOI infections induced detectable production of IFN protein by A549 cells, but not BEAS-2B cells. In addition, rgRSV did not induce either cell line to upregulate gene expression of any of the IFN-α subtypes (Fig. 2A), IFN-ω (Fig. 2A), or IFNL4 (not shown). Together, Fig. 1 and 2 suggest that, rather than an indication of effective local virus control, high expression of IFN by A549 cells reflects higher levels of viral replication and spread in these cells.
FIG 2.

RSV-infected A549 cells express higher levels of IFN-β and IFN-λ than BEAS-2B cells. A549 and BEAS-2B cells were mock infected (medium only) or infected with rgRSV. Type I (IFN-α, -β, and -ω) and III (IFN-λs) IFN subtype gene expression was quantified using RT-qPCR, and IFNs in supernatants were measured by ELISA. (A) IFN subtype gene expression 48 h following RSV infection at the MOI indicated. The data are expressed as means and SD. Statistical differences between mock infection and each infection dose were calculated by t test on log10 values after Dunnett's correction for multiple comparisons. *, P < 0.05 compared to mock infection. (B) Dose effect of RSV MOI on IFN-β and IFN-λ in supernatants 48 hpi (the legend is the same for panels A and B). The black horizontal lines indicate the medians. Statistical differences were calculated by the Mann-Whitney test. *, P < 0.05 compared to mock infection; +, P < 0.05 compared to BEAS-2B cells infected with the same dose. A549 and BEAS-2B cells were mock infected (medium only) or infected for the indicated times at an MOI of 0.1 or 0.3. (C) IFN gene expression over time. The data are expressed as means and SD. Statistical differences between infected cell lines at each time point were calculated using a one-way ANOVA model without adjustment for mock infection on log10-transformed values as described in Materials and Methods. ++, P < 0.05 for A549 compared to BEAS-2B at MOIs of 0.1 and 0.3; +, P < 0.05 at an MOI of either 0.1 or 0.3. (D) IFN protein expression over time (the legends are the same for panels C and D). The medians are indicated by black horizontal lines. Statistical differences were calculated by the Mann-Whitney test. *, P < 0.05 compared to mock infection; ++, P < 0.05 for A549 compared to BEAS-2B at MOIs of 0.1 and 0.3; +, P < 0.05 at an MOI of either 0.1 or 0.3. The data shown are from three (A and B) or four (C and D) experiments performed in duplicate (n = 6 and 8, respectively).
We then evaluated antiviral and immunomodulatory ISG expression by each cell line as a function of time or viral dose (MOI). As shown in Fig. 3A and summarized in Table 1, the constitutive expression of many ISGs with crucial antiviral functions was significantly higher in the BEAS-2B cells than in the A549 cells. In addition, after infection, several of the genes had higher peak expression levels in BEAS-2B cells than in A549 cells (Table 1 and Fig. 3A). Included among these ISGs are DDX58 (RIG-I), which is critical for detection of RSV, and IRF9, which is critical for canonical signaling in response to type I or III IFNs. Most of the ISGs measured (except SOCS3 and CXCL10) were maximally expressed by the A549 cells at 24 hpi (Fig. 3A to C) at any of the doses we tested (Fig. 3A and D). However, in infected BEAS-2B cell cultures, the same ISGs were dose responsive at 24 hpi (Fig. 3D) and maximally expressed at 48 hpi (Fig. 3D). In contrast, SOCS1 and SOCS3, which attenuate the antiviral response, and two ISGs, OAS1 and CXCL10, were expressed more highly by A549 cells (Table 1 and Fig. 3B to E).
FIG 3.

BEAS-2B cells express higher levels of antiviral ISGs than A549 cells after RSV infection. A549 or BEAS-2B cells were mock infected (medium only) or infected for the indicated times at an MOI of 0.1 or 0.3 (A to C) or infected for 24 or 48 h at the indicated MOI (D and E). Gene expression was quantified using RT-qPCR (A to D), and concentrations of CXCL10 in supernatants were measured by bead array (C and E). (A) ISGs expressed at higher levels by BEAS-2B cells constitutively (i.e., 0 hpi) or after RSV infection. (B) ISGs expressed at higher levels by A549 cells either constitutively or after RSV infection. (C) Expression of CXCL10 transcript (top) and protein (bottom). (A to C) The data shown are from four experiments, each performed in duplicate. (D and E) Expression of ISGs (D) and CXCL10 protein (E) in response to increasing doses of RSV at 24 (n = 3) and 48 (n = 5) hpi. (A to D) Gene expression data are shown as means ± SD. (A to C) Statistical differences between cell lines at each time point were calculated using a one-way ANOVA model without adjustment for mock infection on log10-transformed values as described in Materials and Methods. *, P < 0.05 for A549 compared to BEAS-2B mock infection at 0 hpi; ++, P < 0.05 for A549 compared to BEAS-2B at MOIs of 0.1 and 0.3; +, P < 0.05 at an MOI of either 0.1 or 0.3. (C and E) The median protein concentrations are indicated by black horizontal lines. Statistical differences were calculated by the Mann-Whitney test. (C) *, P < 0.05 compared to mock infection; ++, P < 0.05 for A549 compared to BEAS-2B at MOIs of 0.1 and 0.3; +, P < 0.05 at an MOI of 0.1 or 0.3. (E) *, P < 0.05 compared to mock infection; +, P < 0.05 when A549 and BEAS-2B cells were compared at the same infective dose.
TABLE 1.
Summary of differential gene expression kinetics between A549 and BEAS-2B cells in response to low doses of RSV
| Time | Genes with expression: |
||
|---|---|---|---|
| Significantly higher in BEAS-2B cells | Significantly higher in A549 cells | Unchanged between A549 and BEAS-2B cells | |
| Constitutive (0 h) | ISG15, MX1, IRF7, IRF9, DDX58, MDA5, IRF1, IFIT1, IFIT3, CXCL10, SOCS3 | SOCS1, OAS1, CCL2 | PKR, CCL5, CXCL8, IRF3 |
| Peak (48/72 h) | ISG15, MX1, IRF7, IRF9, DDX58, MDA5, IRF1a, IFIT3a, PKR, IRF3 | SOCS1, SOCS3, OAS1, CXCL10, CCL2, CCL5, CXCL8 | IRF1, IFIT1 |
Differences between cell lines at an MOI of 0.1 only; all other values were significantly different at MOIs of 0.1 and 0.3.
CXCL10 is also responsive to NF-κB (24), and it is well established that RSV infection induces expression of other NF-κB-dependent proinflammatory mediators (25). We therefore asked whether A549 cells preferentially express proinflammatory mediators after infection with rgRSV. Figure 4A shows that, in A549 cells, rgRSV induced higher expression of CCL2, CCL5, and CXCL8 and higher secretion of their gene products, as well as IL-1α and IL-6 (Fig. 4B and C). Taken together, these data define two responses to RSV infection. High expression of type I and III IFNs and proinflammatory cytokines is associated with permissive infection of A549 cells, while higher expression of antiviral ISGs is associated with restrictive infection of BEAS-2B cells.
FIG 4.

BEAS-2B cells express lower levels of proinflammatory cytokines and chemokines than A549 cells after RSV infection. A549 and BEAS-2B cells were mock infected (medium only) or infected for the indicated times at an MOI of 0.1 or 0.3 (A and B) or infected for 48 h at the indicated MOI (C). Gene expression was quantified using RT-qPCR (A), and concentrations of mediators in supernatants were measured by bead array (B and C). (A) Gene expression of proinflammatory chemokines. The data are shown as means ± SD. Statistical differences between cell lines at each time point were calculated using a one-way ANOVA model without adjustment for mock infection on log10-transformed values as described in Materials and Methods. *, P < 0.05 for A549 compared to BEAS-2B mock infection at 0 hpi; ++, P < 0.05 for A549 compared to BEAS-2B at MOIs of 0.1 and 0.3; +, P < 0.05 at an MOI of either 0.1 or 0.3. (B and C) Median protein concentrations are indicated by black horizontal lines. Statistical differences were calculated by the Mann-Whitney test. (C) *, P < 0.05 compared to mock infection; +, P < 0.05 when A549 and BEAS-2B cells were compared at the same infective dose. (B) All differences between the two cell lines at an RSV MOI of 0.3 were statistically significant. The data shown are from three (C) or four (A and B) experiments, each performed in duplicate.
ISG expression inversely correlates with infection and IFN expression. To explore this further, we sorted cells by fluorescence-activated cell sorting (FACS) into three fractions based on the intensity of GFP expression as a marker of viral gene expression: GFP negative, GFP intermediate, and GFP high (Fig. 5A). To ensure sufficient numbers of infected cells, each cell line was infected at an MOI of 1.0, the A549 cells were sorted at 24 hpi, and the BEAS-2B cells were sorted at 48 hpi. Figure 5B shows that RSV M expression increased ∼10-fold in each of the GFP-intermediate and -high populations, similar to their increased expression of GFP. We attribute amplification of RSV M from the GFP-negative population either to attachment of viral particles to the outside of the cell or to inclusion of cells that are infected early in the replication cycle, prior to detectable GFP protein expression. Figure 5C shows that expression of each of the IFNs was similarly upregulated in the GFP-intermediate and GFP-high populations. In contrast, the GFP-negative population of each cell line expressed the highest levels of antiviral ISGs, which decreased incrementally in the GFP-intermediate and GFP-high subsets (Fig. 5D). These data suggest that IFN and ISG expression are uncoupled due to direct inhibition of ISG expression within infected cells at the level of IFN signaling.
FIG 5.
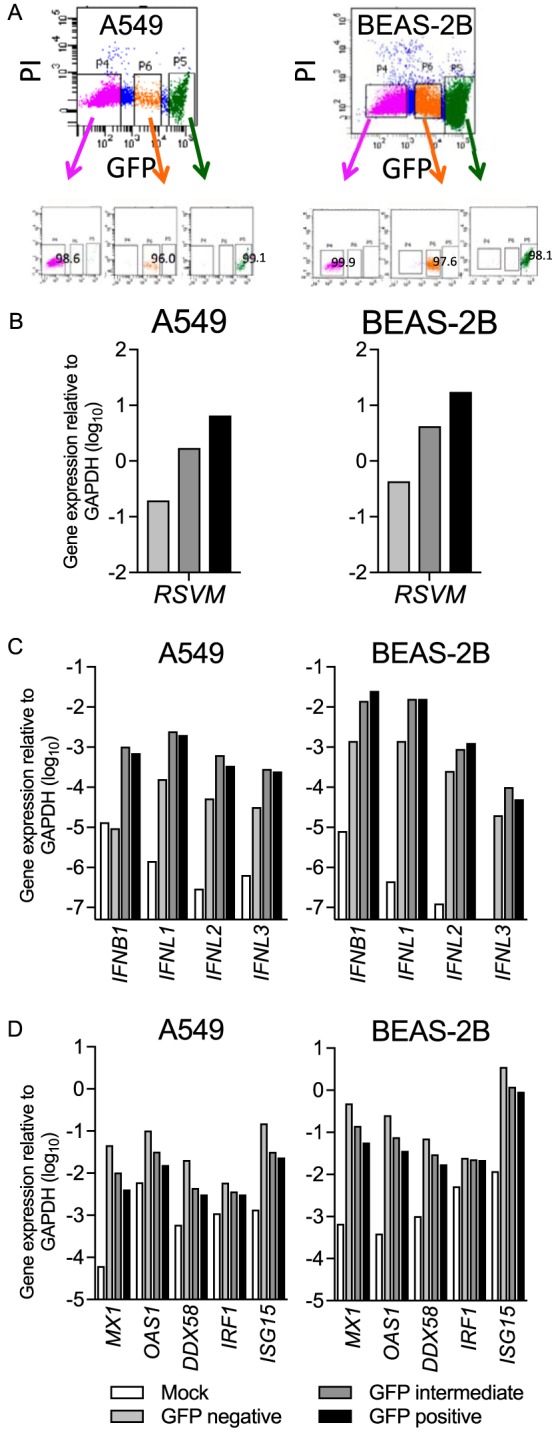
Gene expression of RSV M, IFNs, and ISGs in separate populations of rgRSV-infected A549 and BEAS-2B cells. A549 and BEAS-2B cells were mock infected or infected with rgRSV at an MOI of 1 for 24 or 48 h, respectively. Infected cultures of each cell type were sorted into three populations, GFP negative, GFP intermediate, and GFP high. RNAs from uninfected cultures (Mock) and each of the three sorted populations were harvested immediately. (A) Gating strategy for the sort and postsort purity of each population. PI, propidium iodide. (B to D) Gene expression of RSV M (B), IFNs (C), and ISGs (D) was quantified using RT-qPCR. One representative experiment of three is shown.
Differential regulation of STAT and NF-κB signaling by RSV infection in A549 and BEAS-2B cells.
To explore differences in signaling, we measured expression of the receptors for type I and III IFNs and their canonical downstream signaling molecules. As shown in Fig. 6A, BEAS-2B cells constitutively expressed IFNAR1 and IFNLR1 at higher levels than A549 cells. RSV infection increased the expression of IFNAR1 and IFNLR1 in both A549 and BEAS-2B cells, but BEAS-2B cells showed higher expression of IFNAR1 and IFNLR than A549 cells at all time points. Induction of ISG expression by type I and III IFNs is largely mediated by a transcription factor complex known as ISGF3, which is composed of three cytosolic proteins: STAT1, STAT2, and IRF9. Figure 6B shows that STAT1 and STAT2 were similarly phosphorylated in infected A549 and BEAS-2B cells at 24 hpi. However, consistent with the higher IFN expression levels in A549 cells shown in Fig. 2, STAT1/2 phosphorylation was much greater in A549 cells at 48 and 72 hpi than in BEAS-2B cells (Fig. 6B). Also, consistent with the comparative IRF9 gene expression levels shown in Fig. 3, BEAS-2B cells expressed higher levels of IRF9 protein than A549 cells (Fig. 6C). Taken together, higher constitutive expression of critical receptors and IFN signaling intermediaries by BEAS-2B cells suggests that they respond more optimally to type I and III IFNs induced during viral infection.
FIG 6.

Components of the IFN signaling pathway differ between RSV-infected A549 and BEAS-2B cells. A549 or BEAS-2B cells were mock infected (medium only) or infected with rgRSV at an MOI of 0.1 or 0.3 for the indicated times. (A) Interferon receptor gene expression was measured by RT-qPCR. The data shown are means ± SD from the results of four experiments performed in duplicate. Statistical differences between cell lines at each time point were calculated using a one-way ANOVA model without adjustment for mock infection on log10-transformed values as described in Materials and Methods. *, P < 0.05 for A549 compared to BEAS-2B mock infection at 0 h; ++, P < 0.05 for A549 compared to BEAS-2B at MOIs of 0.1 and 0.3; +, P < 0.05 at an MOI of either 0.1 or 0.3. (B and C) Phosphorylated and total STAT1 and STAT2 expression (B) and total IRF9 expression (C) were measured by Western blotting. The data represent the results of experiments on two separate cultures.
We then asked if either BEAS-2B or A549 cells preferentially activate transcription factors that mediate expression of IFNs or proinflammatory mediators. Figure 7A and B shows that the cell lines expressed similar levels of IRF3 mRNA and protein. Consistent with higher IFN expression by A549 cells, IRF3 was more highly activated in A549 cells. Consistent as well with higher expression levels of NF-κB-inducible proinflammatory mediators by A549 cells, NF-κB was also more highly activated (Fig. 7C). Conversely, BEAS-2B cells expressed more IRF1 protein both constitutively and at 24 hpi (Fig. 7D), which is similar, but slightly delayed, relative to the expression of its mRNA transcript (Fig. 3). These data demonstrate that overall, A549 cells express more NF-κB and IRF3, consistent with higher activation due to higher levels of virus.
FIG 7.

RSV-infected BEAS-2B cells express more IRF-1 but activate less IRF-3 and NF-κB than A549 cells. A549 or BEAS-2B cells were mock infected (medium only) or infected with rgRSV at an MOI of 0.1 or 0.3 for the indicated times. (A) Transcription factor gene expression was measured by RT-qPCR. The data shown are means ± SD from the results of four experiments performed in duplicate. Statistical differences between cell lines at each time point were calculated using a one-way ANOVA model without adjustment for mock infection on log10-transformed values as described in Materials and Methods. *, P < 0.05 for A549 compared to BEAS-2B mock infection at 0 h; ++, P < 0.05 for A549 compared to BEAS-2B at MOIs of 0.1 and 0.3; +, P < 0.05 at an MOI of either 0.1 or 0.3. (B and D) IRF3 dimerization (B) and IRF1 protein expression (D) were measured by Western blotting. The data represent the results of experiments on two separate cultures. (C) EMSA was performed to determine NF-κB activation.
BEAS-2B cells express higher levels of TLRs and RIG-I-like receptors than A549 cells.
Having shown differential activation of IFN and proinflammatory pathways by RSV infection, we then asked whether the two cell lines differentially express PRRs that activate these signaling pathways. RSV is detected early by RIG-I (also an ISG) (Fig. 3) and later by TLR3 (5). TLR2 and TLR4 also induce innate gene expression during RSV infection (6, 8), and some studies suggest a role for MDA5 in activating and sustaining host responses to RSV (26). We found that BEAS-2B cells constitutively expressed higher levels of MDA5 and TLR2 (Fig. 8A) and higher levels of TLR3 and TLR4 both constitutively and after infection (Fig. 8A and B). In contrast, the two cell lines constitutively expressed similar levels of DDX58 (RIG-I) (Fig. 8A). Consistent with early gene upregulation (Fig. 3), BEAS-2B cells expressed more RIG-I protein at 24 hpi (Fig. 8C).
FIG 8.

Uninfected and RSV-infected BEAS-2B cells express higher levels of critical pattern recognition receptors than A549 cells. (A) TLR and RIG-I-like receptor (RLR) gene expression was measured by RT-qPCR in uninfected A549 or BEAS-2B cells. The data shown are means and SD. Statistical differences were calculated by t test on log10 values after Bonferroni's correction for multiple comparisons. *, P < 0.05 by t test on log10 data. (B) A549 and BEAS-2B cells were mock infected (medium only) or infected with rgRSV at an MOI of 0.1 or 0.3 for 0, 6, 24, 48, 72, or 96 h. The data shown are means ± SD from four experiments performed in duplicate. Statistical differences between cell lines at each time point were calculated using a one-way ANOVA model without adjustment for mock infection on log10-transformed values as described in Materials and Methods. *, P < 0.05 for A549 compared to BEAS-2B mock infection at 0 hpi; ++, P < 0.05 for A549 compared to BEAS-2B at MOIs of 0.1 and 0.3; +, P < 0.05 at an MOI of either 0.1 or 0.3. (C) RIG-I protein expression following infection at an MOI of 0.1 or 0.3 for 24, 48, and 72 h was determined by Western blotting. The data shown are from one of two biological replicates.
Correlations of RSV expression with induction of ISGs and proinflammatory mediators.
We then probed the data shown in Fig. 2 to 8 to explore the relationship of ISG and proinflammatory gene expression to RSV M gene expression between the two cell lines. As shown in Fig. 9, five patterns emerged. The first pattern, exemplified by IFNB1, IFNL1, and SOCS1 (Fig. 9, group 1), is an identical correlation of each cell line with RSV M. The second pattern is exemplified by the 11 genes in group 2 in Fig. 9. These plots show parallel slopes of increases in gene expression between the two cell types that primarily reflect higher early expression by BEAS-2B (e.g., MDA5 and MX1) or A549 (e.g., IFNL2) cells; note the statistical differences between their intercepts. The third pattern, exemplified by the 11 genes in group 3 of Fig. 9, comprises genes for which the rate of increase differed between the two cell lines, as indicated by the statistical differences in their slopes (e.g., PKR and OAS1). The fourth pattern, exemplified by the five genes in group 4 of Fig. 9, consists of genes that RSV infection upregulated only in A549 cells (e.g., IFNA1, IFNL3, and IL1A). Finally, the fifth pattern, exemplified by the two genes (CXCL8 and CCL2) in group 5, appeared to be suppressed in RSV-infected BEAS-2B cells (Fig. 9). The last three patterns suggest cellular differences between the two cell types' responses to RSV infection.
FIG 9.

Correlations of RSV M gene with host innate immune genes. A549 or BEAS-2B cells were infected at an MOI of 0.1 for the indicated times. Gene expression was quantified by RT-qPCR. Linear regression was used to calculate and compare the slopes and intercepts. The graphs are grouped according to patterns of correlations as described in the text.
BEAS-2B and A549 cells constitutively express genes that reflect their respective antiviral and proinflammatory responses.
Differences in constitutive expression of genes observed in the kinetic studies prompted us to comprehensively characterize constitutive gene expression by transcriptome sequencing (RNA-seq) (Fig. 10). The data were analyzed with HISAT2 as an aligner and Cufflinks for differential gene expression analysis. The cutoff to define differentially expressed genes (DEGs) between BEAS-2B and A549 cells was a false-discovery rate (FDR) of <0.05, which revealed 5,591 DEGs between BEAS-2B and A549, 2,830 that were preferentially expressed by BEAS-2B, and 2,761 that were preferentially expressed by A549. To reveal novel genes associated with restriction of infection, we limited the FDR to ≤0.001 and included DEGs in which the median number of fragments per kilobase per million (FKPM) was >10 for either cell line (genes for which no transcripts were detected were arbitrarily assigned FKPM values of 0.001) and for which the median BEAS-2B/A549 expression ratio was >∣23∣. These stringent criteria excluded genes that were differentially expressed according to RT-quantitative PCR (qPCR), for example, IRF1 and IRF7 (median FKPM BEAS-2B/A549 ratio, ∼4), but identified 354 DEGs, 149 and 201 of which were preferentially expressed by BEAS-2B and A549 cells, respectively (see Data Set S1 in the supplemental material). Networks and signaling pathways associated with these 354 genes were investigated with Ingenuity Pathway Analysis (IPA) (69).
FIG 10.

Differential constitutive gene expression by BEAS-2B and A549 cells. Differentially expressed genes were determined according to the following criteria: FKPM of >10 for either cell line, P value adjusted for FDR of <0.001, and BEAS-2B/A549 of >∣23∣. (A) Top 354 differentially expressed genes. (B to D) Genes of interest are shown according to category in Ingenuity Pathway Analysis. The data shown are from 3 and 6 biological replicates for A549 and BEAS-2B cells, respectively.
Figure 10A shows a heat map of these 354 genes. Not surprisingly, since A549 is a cancer cell line, the top disease associated with these genes by IPA was cancer, and the two cell lines expressed different KRT (keratin) alleles (not shown). Figure 10B to D show heat maps for selected sets of genes segregated according to category, as defined by IPA. A549 cells preferentially expressed the genes CCL2 and CXCL5 (Fig. 10B), whose products are proinflammatory chemotactic cytokines for monocytes and neutrophils, respectively, and IRAK2 (Fig. 10D), which enhances short- and long-term NF-κB activation (27). In contrast, BEAS-2B cells preferentially expressed a small set of genes known to be upregulated by IFNs, including IFITM2, IFITM3, and genes for major histocompatibility complex (MHC) class I proteins (Fig. 10D). Consistent with RT-qPCR, the ISG OAS1 was preferentially expressed by A549 cells (Fig. 10D).
IPA (see Fig. S1 in the supplemental material) revealed multiple canonical pathways associated with either cell line, but genes associated with these pathways were downstream products rather than the cytokines themselves. For example, genes associated with the interferon signaling pathway comprised the antiviral IFITM2, IFITM3, and OAS1 genes and a component of the proteasome, PSMB8, but IFNs themselves did not exhibit differential basal expression. Many expressed genes are associated with TNF-α, although TNFA itself was not differentially expressed between the two cell lines. Of interest, ZBTB16 was expressed only by BEAS-2B cells. ZBTB16 encodes PLZF, a pleiotropic transcription factor that limits NF-κB activation (28). In summary, even using highly stringent criteria, we observed differences in constitutive gene expression between the two cell lines that were consistent with higher ISG and lower NF-κB expression in BEAS-2B cells.
DISCUSSION
We explored the innate responses to RSV infection of two REC lines, A549 and BEAS-2B, that are commonly used to study pulmonary viral pathogens and that were derived from type II alveolar and bronchial epithelial cells, respectively (29, 30). We found that A549 cells are oriented toward expression of NF-κB-inducible proinflammatory cytokines and chemokines that permit RSV to spread, whereas BEAS-2B cells are oriented toward antiviral defense and restrict RSV to individual cells or localized foci. Recently, Seng and colleagues described similar patterns of infectivity with influenza virus in the two cell lines (31), suggesting that these differences are intrinsic to the cell lines rather than virus dependent. Caveats for our model include inherent differences between the two cell lines and the primary cells that they represent. The A549 cell line originated from a lung carcinoma (32) and was subsequently identified as type II alveolar cells, and it requires fetal bovine serum (FBS) for propagation. The BEAS-2B cell line was generated by transforming primary human bronchial epithelial cells with adenovirus type 12 (Ad12)-SV40 (33), and the cells differentiate into squamous cells when cultured in the presence of FBS (34). Tight junctions may be formed in confluent cultures of BEAS-2B cells, but not A549 cells (35). We found no differences in rates of RSV infection in BEAS-2B cells cultured at lower densities (not shown), and confocal microscopy demonstrated little difference in ZO-1 tight-junction protein between infected and uninfected cells (not shown). Therefore, there is no evidence that tight junctions contribute to resistance to infection in BEAS-2B cells. In addition, BEAS-2B cells stably express the SV40 large T antigen, which can induce IFN-dependent and -independent ISG expression through the ataxia telangiectasia- and Rad3-related (ATR)-dependent DNA danger response (DDR) (36). Since constitutive expression of ATR is similar (4 to 6 FKPM) between the two cell lines, it is unlikely that the DDR pathway contributes to the antiviral orientation of the BEAS-2B cells. Whether or not these two cell lines are representative of primary cells, they provide a useful model for dissecting host innate mechanisms that restrict or permit local spread of RSV in the respiratory epithelium.
Differences in infectivity between the A549 and BEAS-2B cell lines may be due to differences in cellular tropism (caused by differences in attachment, fusion, and entry or in other steps in the viral replicative cycle that may be affected by the host cell milieu), defense of an infected cell, and either the constitutive or induced antiviral states of the neighboring cells. RSV attaches and fuses to epithelial target cells through its G and F glycoproteins (37, 38). RSV G binds to CX3CR1, and RSV F binds to nucleolin (39, 40) and the epidermal growth factor receptor, products of NCL and EGFR genes, respectively, which are similarly expressed by the two cell lines (not shown). RSV F also binds TLR4 (6), but that interaction does not facilitate cell entry. Taken together with the qualitative differences in their innate responses, it is unlikely that cellular tropism determines the differences in spread of RSV infection between the two cell lines.
Rather than differences in tropism, the BEAS-2B cells appear to have a superior intrinsic antiviral state. As shown in Fig. 1E and F and Movies S1 and S2 in the supplemental material, the magnitudes of infection of the two cell types diverge as early as 8 hpi, suggesting that BEAS-2B cells more effectively resist suppression of antiviral responses by RSV NS1 and NS2. This restriction by BEAS-2B cells to small clusters of infected cells suggests a dynamic process consisting of more than one strategy to successfully suppress viral spread. One strategy is higher constitutive expression of a set of antiviral ISGs to arm the cells for an immediate defense, which implies that the genes are poised to rapidly enhance their transcription. These ISGs include ISG15, IFIT3, and IFITM1, each of which decreases RSV infection when overexpressed in HEp-2 cells (41). A second strategy is rapid upregulation of expression of RIG-I, the intracellular PRR that first detects RSV infection and induces IFN-independent expression (or enhances expression) of many antiviral ISGs. Third, BEAS-2B cells are biased toward an antiviral, rather than a proinflammatory, response. Of interest, only the BEAS-2B cells constitutively express ZBTB16, the gene for PLZF. PLZF has been shown to suppress proinflammatory gene expression by promoting assembly of a repressor complex that incorporates HDAC3 and NF-κB p50 (28).
In addition to their intrinsic antiviral response, the BEAS-2B cells are better equipped to respond to IFNs. For example, we found that BEAS-2B cells express higher levels of IFNAR1, IFNLR1, and IRF9, which enhances their sensitivity to IFNs (42) and explains the similar activation of STAT1 and STAT2 at 24 hpi despite their lower production of IFNs. BEAS-2B cells also express higher levels of IRF7 early after infection. IRF7 was recently identified as central to an in silico network of genes expressed in response to RSV, and its importance was validated by demonstrating that IRF7−/− mice have enhanced RSV disease (41). IRF7 is considered the master regulator of IFN-dependent immune responses and is critical for rapid upregulation of RIG-I in response to RSV (43), an effect that was unique to the BEAS-2B cells. RSV-infected dendritic cells (DC) also express type I and III IFNs, including a subset of IFN-α subtypes that potently induce antiviral ISG expression by DC and BEAS-2B cells (44).
The roles of type I and III IFNs in limiting RSV infection are not well defined. IFNs affect adaptive immunity, either beneficially, by enhancing CD4 T cell polarization toward the Th1 phenotype (45) or by increasing expression of IFN-γ by Th1 CD4 T cells (46), or adversely, by enhancing IL-4 expression by Th2 memory cells (46) or suppressing T cell proliferation (47). In infected cells, RSV NS1 and NS2 proteins efficiently suppress IFN expression and signaling (48), so the potential roles of type I and type III IFNs are likely limited to inducing or enhancing the intrinsic antiviral states (49) of neighboring cells. Accordingly, only pretreatment with IFN-β, IFN-α, or IFN-λ1 inhibits RSV replication in vitro, but the magnitude of suppression is cell type dependent, and their relative potencies have not been directly compared. Since IFN-β has a very high affinity (∼0.1 nM) for the IFNAR1/2 receptor dimer, it is very potent; 1 to 10 pg/ml sufficiently induces antiviral ISG expression (44). Thus, although we were unable to detect IFN-β in the supernatants of RSV-infected BEAS-2B cells, it may be produced at levels too low to measure but sufficient to induce antiviral responses. In contrast, the IFNLR/IL-10RB complex is a relatively low-affinity receptor (50) that requires higher IFN-λ concentrations (which are easily detected by enzyme-linked immunosorbent assay [ELISA]) to induce ISG expression. Therefore, reported differences in the levels of IFN protein in biological fluids from RSV-infected patients may not proportionately represent their roles in antiviral defense. Additionally, although IFN-β and IFN-λ are frequently coexpressed, to our knowledge, their individual contributions to respiratory epithelial cell defense against respiratory viruses has been studied only with vesicular stomatitis virus (49). Similar to the mouse model of RSV infection (51), it is possible that both type I and III IFNs are required for effective viral clearance.
Similar to a recent observation of RSV-infected immortalized small airway cells (52), A549 cells are programmed toward a proinflammatory response, as evidenced by higher constitutive expression of IRAK2, CXCL8, CCL2, CCL5, and ICAM1. Of particular interest, CXCL8 and CCL2 recruit neutrophils and monocytes, respectively, which in high numbers contribute to the airway blockage and tissue damage associated with severe RSV infections. We did not detect TNF-α in our cultures, possibly because it is expressed by epithelial cells only in response to high MOIs of RSV or transiently at earlier time points than we studied (25, 53, 54). The proinflammatory orientation of A549 cells may also explain their high expression of IFNL1, which is highly responsive to NF-κB (55). As shown by Wei and colleagues (56), IFN-λ may also be excessively expressed in A549 cells as a consequence of their high expression of SOCS1, a posttranslational inhibitor of IFN-induced JAK/STAT signaling (57–59).
In summary, we chose to compare two REC lines, A549 and BEAS-2B, because they are commonly used to study RSV and because they were derived from different compartments of the bronchial tree. We showed that A549 cells are permissive for RSV infection and highly express type I and III IFNs and a set of proinflammatory cytokines. In contrast, BEAS-2B cells restrict RSV infection; constitutively express higher levels of ISGs; and, after infection, express higher levels of signaling components critical to the antiviral response, including RIG-I and IRF9. We conclude that these two cell lines provide a model by which we can dissect critical genes that locally control RSV infection and the dichotomy between antiviral and proinflammatory responses in respiratory epithelial cells.
MATERIALS AND METHODS
Virus.
Recombinant RSV strain D46 6120 A2 expressing enhanced GFP from an added gene between the P and M genes (rgRSV) (23) was propagated in Vero cells at an input MOI of 0.01 PFU/cell and grown for 6 to 8 days in Optipro serum-free medium (Life Technologies, Grand Island, NY) supplemented with 4 mM l-glutamine (Life Technologies). Cells were harvested by scraping, vortexed briefly to liberate surface-associated virus, and clarified by low-speed centrifugation. The virus was purified by centrifugation through discontinuous sucrose gradients to remove cytokines and other soluble factors, as previously described (60), and then diluted and pelleted gently to remove the sucrose. The pellets were resuspended in RPMI 1640 supplemented with 2 mM l-glutamine, snap-frozen, and stored at −80°C until use (60). Viral titers were measured by immunoplaque assay on Vero cells, as previously described (61).
Cell culture.
A549 cells (ATCC, Manassas, VA) were grown in Ham's F-12 medium containing 1 mM l-glutamine (Life Technologies) with 10% FBS (Quality Biological, Gaithersburg, MD), and BEAS-2B cells (ATCC) were grown using the BEGM Bullet kit (Lonza, Walkersville, MD). Both cell lines were maintained at 37°C, 5% CO2 without antibiotics. For the experiments, cells were seeded in 6- or 12-well plates with 20 μg/ml gentamicin (Life Technologies) and grown until 90% confluent. For infection, rgRSV was diluted in medium containing gentamicin (FBS was reduced to 5% for A549 cells during infection), inoculated at a final volume of 0.5 to 1.0 ml per well, and incubated for 2 h with shaking at 37°C. At 2 hpi, the medium was removed and replaced with fresh medium, and the cells were incubated until they were harvested for RNA or protein or fixed and stained for confocal microscopy.
Quantitative real-time PCR.
RNA was isolated using RNeasy spin columns, including on-column DNase digestion (Qiagen, Germantown, MD). The RNA was reverse transcribed using a Verso enzyme kit (Thermo Fisher Scientific, Waltham, MA) including RNase H (New England BioLabs, Ipswich, MA). Host gene expression was measured using TaqMan gene expression assays (Thermo Fisher Scientific), with the exception of GAPDH (glyceraldehyde-3-phosphate dehydrogenase), which was measured using the following sequences: forward primer, 5′-ATTCCACCCATGGCAAATTC-3′; reverse primer, 5′-CGCTCCTGGAAGATGGTGAT-3′; probe, 5′-FAM (6-carboxyfluorescein)-CGTTCTCAGCCTTGACGGTGCCA-TAMRA (6-carboxytetramethylrhodamine)-3′. All RT-qPCR was performed using a Viia 7 (Thermo Fisher Scientific), and gene expression was calculated by the ΔCq (quantification cycle) method using the GAPDH gene as the housekeeping gene. Gene expression of the 12 functional IFN-α subtypes, IFN-β, IFN-ω, and the three IFN-λs was measured individually using the novel RT-qPCR assay developed in our laboratory, as previously described (62, 63). RSV gene expression in epithelial cells was measured using specific RT-qPCR assays for the RSV M gene, as previously described (44).
Confocal microscopy.
Cells were grown on glass coverslips coated with 12 μg/ml collagen (Sigma, St. Louis, MO) (A549) or 30 μg/ml collagen, 10 μg/ml fibronectin and 0.001% bovine serum albumin (BSA) (all Sigma) (BEAS-2B) and infected with rgRSV. The cells were fixed in 4% paraformaldehyde (Electron Microscopy Sciences, Hatfield, PA) in phosphate-buffered saline (PBS) for 30 min at 4°C, washed twice in PBS, stained with 2 μg/ml Hoechst 33258 nuclear dye (Thermo Fisher Scientific) for 10 min at room temperature, and washed 3 times. Images were taken using an AxioObserver SD spinning-disk confocal microscope with AxioVision software (Carl Zeiss, Thornwood, NY). Excitation wavelengths of 488 and 405 nm were used for GFP and Hoechst channels, respectively. Images were stored in zvi format, and image analysis was performed using Imaris software (Bitplane, Concord, MA).
Real-time cell analysis.
To analyze viral spread over time, rgRSV-infected A549 and BEAS-2B cells were grown in 24-well plates and monitored over a 44-hour period in an IncuCyte S3 live-cell analysis system (Essen Biosciences, Ann Arbor, MI). The plates were incubated at 37°C and maintained in a 5% CO2 atmosphere. Whole-well images were acquired at ×40 magnification at 1-hour intervals to measure viral spread as kinetic imaging confluence. All whole-well images were cropped at a uniform position in the center of the well and combined in chronological order to create videos using IncuCyte 2015 software.
Measurement of cytokines in supernatants.
The cytokines CCL2, CCL5, CXCL8, CXCL10, IL-1α, and IL-6 were measured using a Luminex screening assay (R&D Systems, Minneapolis, MN) following the manufacturer's instructions. Data were acquired using a Bioplex 200 bead analyzer (Bio-Rad, Hercules, CA), and cytokine concentrations were determined from standard curves. IFN-β and IFN-λ1, -λ2, and -λ3 were measured by ELISA (PBL Interferon Source, Piscataway, NJ).
Western blots of transcription factors and pattern recognition receptors.
For measurement of phosphorylated and total STAT1 and STAT2, cells were washed 3 times with Dulbecco's PBS and lysed with NP-40 lysis buffer (Thermo Fisher). Proteins were resolved by electrophoresis under denaturing and reducing conditions on SDS-8% PAGE gels (Life Technologies) and then transferred to polyvinylidene difluoride (PVDF) membranes. The levels of tyrosine-phosphorylated (pY)-STAT1 and pY-STAT2 were measured by immunoblotting the membranes with monoclonal rabbit antiphospho-Tyr701-STAT1 (Cell Signaling Technology, Beverly, MA, USA) and polyclonal rabbit anti-phospho-Tyr689-STAT2 (Millipore, Billerica, MA, USA) antibodies, respectively.
For measurement of IRF1, IRF9, and RIG-I, cells were washed twice with PBS, lysed with radioimmunoprecipitation assay (RIPA) buffer (25 mM Tris-HCl, pH 7.6, 150 mM NaCl, 1% NP-40, 1% sodium deoxycholate, 0.1% SDS) supplemented with protease and phosphatase inhibitor tablets (Thermo Scientific), and scraped. The lysates were centrifuged at 12,000 rpm at 4°C for 15 min, and the supernatants were kept at −80°C until use. Protein concentrations were determined by bicinchoninic acid (BCA) protein assay (Thermo Scientific). Thirty micrograms of each reduced and denatured sample was resolved on a 10% Bis-Tris gel (Life Technologies) and transferred to PVDF membranes via the iBlot transfer system (Life Technologies). Levels of IRF1, IRF9, and RIG-I were visualized by chemiluminescence using rabbit anti-IRF1 monoclonal antibody (MAb) (clone D5E4; Cell Signaling Technology), rabbit anti-ISGF-3γ polyclonal antibody (PAb) (Santa Cruz, Dallas, TX), mouse anti-RIG-I MAb (clone 1c3; Millipore), and mouse anti-β-actin MAb (clone C4; Santa Cruz) as a control for protein loading.
For measurement of IRF3 activation, (64), nuclear extracts were prepared from stimulated cells by using a modification (65) of the original method described previously (66). Native PAGE was performed under nondenaturing and nonreducing conditions using 10 μg nuclear extracts and a nondenaturing 8% Tris-glycine gel (Life Technologies). The gel was prerun for 30 min at 40 mA in 1× Tris-glycine buffer (25 mM Tris and 192 mM glycine, pH 8.4) with 1% deoxycholate in the cathode chamber (67). The nuclear extract reaction mixtures were then subjected to gel electrophoresis for 90 min at 25 mA, and the proteins were transferred to nitrocellulose membranes. Monomeric and dimeric forms of IRF-3 were detected by immunoblot assay using anti-IRF3 antibody (Santa Cruz Biotechnology). Immunoreactive IRF3 bands were visualized by chemiluminescence using the SuperSignal West Pico chemiluminescent substrate (Thermo Scientific), and the image was acquired on the FluorChem M system (Protein Simple).
Electrophoretic mobility shift assay (EMSA).
Nuclear protein extracts were prepared as described above, and a double-stranded oligonucleotide probe for NF-κB, (5′-AGTTGAGGGGACTTTCCCAGGC-3′/3′-TCAACTCCCCTGAAAGGGTCCG-5′) (Promega, Madison, WI) was used as a probe. The probe was end labeled with [γ-32P]ATP using T4 polynucleotide kinase (New England BioLabs). The binding reactions were performed by incubating 1 μl radiolabeled NF-κB probe with 5 μg nuclear extracts in the presence of 2 μg poly(dI-dC) (Amersham Pharmacia Biotech, Piscataway, NJ), 10 mM dithiothreitol (DTT), 10 mM Tris-HCl (pH 7.5), 1 mM EDTA, and 50% glycerol in a final volume of 20 μl. The reaction mixtures were incubated on ice for 30 min, and then, 8 μl of each mixture was electrophoresed on a nondenaturing, nonreducing 6% DNA retardation gel (Novex, Salt Lake City, UT) using 0.25× TBE electrophoresis buffer containing 22 mM Tris-HCl (pH 8), 22 mM borate, and 0.5 mM EDTA. After running, the gels were dried and exposed overnight at −70°C using Kodak BioMax MS film (Kodak, Rochester, NY) for detection of signals by autoradiography.
Transcriptome analysis of resting BEAS-2B and A549 cells.
Each of the two cell lines was grown in six-well plates for 48 h, and individual samples were harvested from three (A549) or six (BEAS-2B) different cultures. RNA was isolated using RNeasy spin columns, including on-column DNase digestion (Qiagen) and analysis of RNA integrity (Agilent; minimum RNA integrity number, 8). To obtain the final sequencing library, 14 cycles of PCR were performed using Phusion Hot Start high-fidelity DNA polymerase (Finnzymes, Espoo, Finland). For each sample replicate, we obtained ∼30 million paired 50-mer reads (with three biological replicates for the A549 cells and six for the BEAS-2B cells) using the Illumina HiSeq 2500 platform. Data were analyzed using HISAT2 as an aligner and Cufflinks for differential gene expression analysis. Patterns of gene expression were analyzed through the use of Ingenuity Pathway Analysis software (69) from Qiagen, Inc.
Log2-transformed FPKM values from RNA sequencing of three and six biological replicates for A549 and BEAS-2B cells, respectively, were used to generate a heat map of 354 differentially expressed genes that met our criteria (FKPM > 10; A549 versus BEAS-2B ≥ ∣8∣). For purposes of display on a log2 scale, an FKPM value of 0 was considered to be 2−10. The heat map of hierarchical clustering was developed by the Pearson correlation method with average linkage using heatmapper software (http://www.heatmapper.ca/expression). The heat maps of specific genes of interest were generated using Prism 7.0 (GraphPad, La Jolla, CA).
Statistics.
Absolute gene expression and fold changes (compared with mock infection from each time point) of each ISG and IFN type/subtype at single time points (i.e., at 0, 6, 24, 48, 72, and 96 hpi) were evaluated using a one-way analysis of variance (ANOVA) model with the six different treatments (A549 and BEAS-2B at each of mock and MOIs of 0.1 and 0.3) as the fixed effect. Pairwise comparisons of absolute gene expression and fold changes were made among seven and two pairs of interest, respectively. Absolute gene expression at different MOI (0.1 and 0.3) were compared with the mock infection for A549 and BEAS-2B and between A549 and BEAS-2B at each dose (mock infection and MOI of 0.1 and 0.3); fold changes were compared between A549 and BEAS-2B at each MOI (0.1 and 0.3). At time zero, only the comparison between A549 mock infection and BEAS-2B mock infection was performed. No comparisons to the mock infections were performed for the RSV M gene mRNA, since the cells were uninfected and there was no M mRNA expression. The false-discovery rate was controlled at 0.05 to adjust for multiplicity for each ISG and IFN type/subtype using the method of Benjamini and Hochberg (68).
Dose-response data were summarized descriptively for ISG expression by cell type (A549 and BEAS-2B) and dose (mock infection and MOI of 0.1, 0.3, 1, and 3) at 24 and 48 hpi due to limited sample sizes (n = 3 to 5). An exploratory analysis of the dose-response data for each IFN type/subtype at 48 hpi was carried out using a one-way ANOVA model with the dose as the fixed effect for each cell type. Dunnett's test was performed to compare each MOI with the mock infection.
All analyses were performed in SAS v9.4. Statistical differences in cytokine, chemokine, and interferon secretions were determined with Prism 7.0 using the Mann-Whitney test.
Accession number(s).
Sequencing data are available from the Gene Expression Omnibus under accession no. GSE113107.
Supplementary Material
ACKNOWLEDGMENTS
We thank Mark A. KuKuruga, Kazuyo Takeda, Manuel Osorio, and Ross Marklein for their assistance.
This project was supported by CBER intramural funds and in part by appointments to the Research Fellowship Program of the Center for Biologics Evaluation and Research, U.S. Food and Drug Administration, administered by the Oak Ridge Institute for Science and Engineering through an interagency agreement between the U.S. Department of Energy and the FDA.
R.L.R. is an inventor of the RT-qPCR assay for type I IFNs and has derived royalty income from that invention.
Footnotes
Supplemental material for this article may be found at https://doi.org/10.1128/JVI.02202-17.
REFERENCES
- 1.Nair H, Nokes DJ, Gessner BD, Dherani M, Madhi SA, Singleton RJ, O'Brien KL, Roca A, Wright PF, Bruce N, Chandran A, Theodoratou E, Sutanto A, Sedyaningsih ER, Ngama M, Munywoki PK, Kartasasmita C, Simoes EA, Rudan I, Weber MW, Campbell H. 2010. Global burden of acute lower respiratory infections due to respiratory syncytial virus in young children: a systematic review and meta-analysis. Lancet 375:1545–1555. doi: 10.1016/S0140-6736(10)60206-1. [DOI] [PMC free article] [PubMed] [Google Scholar]
- 2.Wu P, Dupont WD, Griffin MR, Carroll KN, Mitchel EF, Gebretsadik T, Hartert TV. 2008. Evidence of a causal role of winter virus infection during infancy in early childhood asthma. Am J Respir Crit Care Med 178:1123–1129. doi: 10.1164/rccm.200804-579OC. [DOI] [PMC free article] [PubMed] [Google Scholar]
- 3.Blanken MO, Rovers MM, Bont L, Dutch RSVNN. 2013. Respiratory syncytial virus and recurrent wheeze. N Engl J Med 369:782–783. doi: 10.1056/NEJMc1307429. [DOI] [PubMed] [Google Scholar]
- 4.Johnson JE, Gonzales RA, Olson SJ, Wright PF, Graham BS. 2007. The histopathology of fatal untreated human respiratory syncytial virus infection. Mod Pathol 20:108–119. doi: 10.1038/modpathol.3800725. [DOI] [PubMed] [Google Scholar]
- 5.Liu P, Jamaluddin M, Li K, Garofalo RP, Casola A, Brasier AR. 2007. Retinoic acid-inducible gene I mediates early antiviral response and Toll-like receptor 3 expression in respiratory syncytial virus-infected airway epithelial cells. J Virol 81:1401–1411. doi: 10.1128/JVI.01740-06. [DOI] [PMC free article] [PubMed] [Google Scholar]
- 6.Kurt-Jones EA, Popova L, Kwinn L, Haynes LM, Jones LP, Tripp RA, Walsh EE, Freeman MW, Golenbock DT, Anderson LJ, Finberg RW. 2000. Pattern recognition receptors TLR4 and CD14 mediate response to respiratory syncytial virus. Nat Immunol 1:398–401. doi: 10.1038/80833. [DOI] [PubMed] [Google Scholar]
- 7.Loo YM, Fornek J, Crochet N, Bajwa G, Perwitasari O, Martinez-Sobrido L, Akira S, Gill MA, Garcia-Sastre A, Katze MG, Gale M Jr. 2008. Distinct RIG-I and MDA5 signaling by RNA viruses in innate immunity. J Virol 82:335–345. doi: 10.1128/JVI.01080-07. [DOI] [PMC free article] [PubMed] [Google Scholar]
- 8.Murawski MR, Bowen GN, Cerny AM, Anderson LJ, Haynes LM, Tripp RA, Kurt-Jones EA, Finberg RW. 2009. Respiratory syncytial virus activates innate immunity through Toll-like receptor 2. J Virol 83:1492–1500. doi: 10.1128/JVI.00671-08. [DOI] [PMC free article] [PubMed] [Google Scholar]
- 9.Johansson C. 2016. Respiratory syncytial virus infection: an innate perspective. F1000Res 5:2898. doi: 10.12688/f1000research.9637.1. [DOI] [PMC free article] [PubMed] [Google Scholar]
- 10.Mella C, Suarez-Arrabal MC, Lopez S, Stephens J, Fernandez S, Hall MW, Ramilo O, Mejias A. 2013. Innate immune dysfunction is associated with enhanced disease severity in infants with severe respiratory syncytial virus bronchiolitis. J Infect Dis 207:564–573. doi: 10.1093/infdis/jis721. [DOI] [PMC free article] [PubMed] [Google Scholar]
- 11.Merolla R, Rebert NA, Tsiviste PT, Hoffmann SP, Panuska JR. 1995. Respiratory syncytial virus replication in human lung epithelial cells: inhibition by tumor necrosis factor alpha and interferon beta. Am J Respir Crit Care Med 152:1358–1366. doi: 10.1164/ajrccm.152.4.7551395. [DOI] [PubMed] [Google Scholar]
- 12.Neuzil KM, Tang YW, Graham BS. 1996. Protective role of TNF-alpha in respiratory syncytial virus infection in vitro and in vivo. Am J Med Sci 311:201–204. [DOI] [PubMed] [Google Scholar]
- 13.Chkhaidze I, Zirakishvili D, Shavshvishvili N, Barnabishvili N. 2016. Prognostic value of TH1/TH2 cytokines in infants with wheezing in a three year follow-up study. Pneumonol Alergol Pol 84:144–150. doi: 10.5603/PiAP.2016.0016. [DOI] [PubMed] [Google Scholar]
- 14.Tabarani CM, Bonville CA, Suryadevara M, Branigan P, Wang D, Huang D, Rosenberg HF, Domachowske JB. 2013. Novel inflammatory markers, clinical risk factors and virus type associated with severe respiratory syncytial virus infection. Pediatr Infect Dis J 32:e437–e442. doi: 10.1097/INF.0b013e3182a14407. [DOI] [PMC free article] [PubMed] [Google Scholar]
- 15.Russell RF, McDonald JU, Ivanova M, Zhong Z, Bukreyev A, Tregoning JS. 2015. Partial attenuation of respiratory syncytial virus with a deletion of a small hydrophobic gene is associated with elevated interleukin-1beta responses. J Virol 89:8974–8981. doi: 10.1128/JVI.01070-15. [DOI] [PMC free article] [PubMed] [Google Scholar]
- 16.Culley FJ, Pennycook AM, Tregoning JS, Dodd JS, Walzl G, Wells TN, Hussell T, Openshaw PJ. 2006. Role of CCL5 (RANTES) in viral lung disease. J Virol 80:8151–8157. doi: 10.1128/JVI.00496-06. [DOI] [PMC free article] [PubMed] [Google Scholar]
- 17.Russell CD, Unger SA, Walton M, Schwarze J. 2017. The human immune response to respiratory syncytial virus infection. Clin Microbiol Rev 30:481–502. doi: 10.1128/CMR.00090-16. [DOI] [PMC free article] [PubMed] [Google Scholar]
- 18.Schneider WM, Chevillotte MD, Rice CM. 2014. Interferon-stimulated genes: a complex web of host defenses. Annu Rev Immunol 32:513–545. doi: 10.1146/annurev-immunol-032713-120231. [DOI] [PMC free article] [PubMed] [Google Scholar]
- 19.Scagnolari C, Midulla F, Selvaggi C, Monteleone K, Bonci E, Papoff P, Cangiano G, Di Marco P, Moretti C, Pierangeli A, Antonelli G. 2012. Evaluation of viral load in infants hospitalized with bronchiolitis caused by respiratory syncytial virus. Med Microbiol Immunol 201:311–317. doi: 10.1007/s00430-012-0233-6. [DOI] [PMC free article] [PubMed] [Google Scholar]
- 20.Selvaggi C, Pierangeli A, Fabiani M, Spano L, Nicolai A, Papoff P, Moretti C, Midulla F, Antonelli G, Scagnolari C. 2014. Interferon lambda 1-3 expression in infants hospitalized for RSV or HRV associated bronchiolitis. J Infect 68:467–477. doi: 10.1016/j.jinf.2013.12.010. [DOI] [PMC free article] [PubMed] [Google Scholar]
- 21.Rodero MP, Decalf J, Bondet V, Hunt D, Rice GI, Werneke S, McGlasson SL, Alyanakian MA, Bader-Meunier B, Barnerias C, Bellon N, Belot A, Bodemer C, Briggs TA, Desguerre I, Fremond ML, Hully M, van den Maagdenberg A, Melki I, Meyts I, Musset L, Pelzer N, Quartier P, Terwindt GM, Wardlaw J, Wiseman S, Rieux-Laucat F, Rose Y, Neven B, Hertel C, Hayday A, Albert ML, Rozenberg F, Crow YJ, Duffy D. 2017. Detection of interferon alpha protein reveals differential levels and cellular sources in disease. J Exp Med 214:1547–1555. doi: 10.1084/jem.20161451. [DOI] [PMC free article] [PubMed] [Google Scholar]
- 22.Moore ML, Chi MH, Luongo C, Lukacs NW, Polosukhin VV, Huckabee MM, Newcomb DC, Buchholz UJ, Crowe JE Jr, Goleniewska K, Williams JV, Collins PL, Peebles RS Jr. 2009. A chimeric A2 strain of respiratory syncytial virus (RSV) with the fusion protein of RSV strain line 19 exhibits enhanced viral load, mucus, and airway dysfunction. J Virol 83:4185–4194. doi: 10.1128/JVI.01853-08. [DOI] [PMC free article] [PubMed] [Google Scholar]
- 23.Munir S, Le Nouen C, Luongo C, Buchholz UJ, Collins PL, Bukreyev A. 2008. Nonstructural proteins 1 and 2 of respiratory syncytial virus suppress maturation of human dendritic cells. J Virol 82:8780–8796. doi: 10.1128/JVI.00630-08. [DOI] [PMC free article] [PubMed] [Google Scholar]
- 24.Brownell J, Bruckner J, Wagoner J, Thomas E, Loo YM, Gale M Jr, Liang TJ, Polyak SJ. 2014. Direct, interferon-independent activation of the CXCL10 promoter by NF-kappaB and interferon regulatory factor 3 during hepatitis C virus infection. J Virol 88:1582–1590. doi: 10.1128/JVI.02007-13. [DOI] [PMC free article] [PubMed] [Google Scholar]
- 25.Arnold R, Humbert B, Werchau H, Gallati H, Konig W. 1994. Interleukin-8, interleukin-6, and soluble tumour necrosis factor receptor type I release from a human pulmonary epithelial cell line (A549) exposed to respiratory syncytial virus. Immunology 82:126–133. [PMC free article] [PubMed] [Google Scholar]
- 26.Grandvaux N, Guan X, Yoboua F, Zucchini N, Fink K, Doyon P, Martin L, Servant MJ, Chartier S. 2014. Sustained activation of interferon regulatory factor 3 during infection by paramyxoviruses requires MDA5. J Innate Immun 6:650–662. doi: 10.1159/000360764. [DOI] [PMC free article] [PubMed] [Google Scholar]
- 27.Kawagoe T, Sato S, Matsushita K, Kato H, Matsui K, Kumagai Y, Saitoh T, Kawai T, Takeuchi O, Akira S. 2008. Sequential control of Toll-like receptor-dependent responses by IRAK1 and IRAK2. Nat Immunol 9:684–691. doi: 10.1038/ni.1606. [DOI] [PubMed] [Google Scholar]
- 28.Sadler AJ, Suliman BA, Yu L, Yuan X, Wang D, Irving AT, Sarvestani ST, Banerjee A, Mansell AS, Liu JP, Gerondakis S, Williams BR, Xu D. 2015. The acetyltransferase HAT1 moderates the NF-kappaB response by regulating the transcription factor PLZF. Nat Commun 6:6795. doi: 10.1038/ncomms7795. [DOI] [PubMed] [Google Scholar]
- 29.Lieber M, Smith B, Szakal A, Nelson-Rees W, Todaro G. 1976. A continuous tumor-cell line from a human lung carcinoma with properties of type II alveolar epithelial cells. Int J Cancer 17:62–70. doi: 10.1002/ijc.2910170110. [DOI] [PubMed] [Google Scholar]
- 30.Mason RJ. 2006. Biology of alveolar type II cells. Respirology 11(Suppl):S12–S15. doi: 10.1111/j.1440-1843.2006.00800.x. [DOI] [PubMed] [Google Scholar]
- 31.Seng LG, Daly J, Chang KC, Kuchipudi SV. 2014. High basal expression of interferon-stimulated genes in human bronchial epithelial (BEAS-2B) cells contributes to influenza A virus resistance. PLoS One 9:e109023. doi: 10.1371/journal.pone.0109023. [DOI] [PMC free article] [PubMed] [Google Scholar]
- 32.Giard DJ, Aaronson SA, Todaro GJ, Arnstein P, Kersey JH, Dosik H, Parks WP. 1973. In vitro cultivation of human tumors: establishment of cell lines derived from a series of solid tumors. J Natl Cancer Inst 51:1417–1423. doi: 10.1093/jnci/51.5.1417. [DOI] [PubMed] [Google Scholar]
- 33.Reddel RR, Ke Y, Gerwin BI, McMenamin MG, Lechner JF, Su RT, Brash DE, Park JB, Rhim JS, Harris CC. 1988. Transformation of human bronchial epithelial cells by infection with SV40 or adenovirus-12 SV40 hybrid virus, or transfection via strontium phosphate coprecipitation with a plasmid containing SV40 early region genes. Cancer Res 48:1904–1909. [PubMed] [Google Scholar]
- 34.Ke Y, Reddel RR, Gerwin BI, Miyashita M, McMenamin M, Lechner JF, Harris CC. 1988. Human bronchial epithelial cells with integrated SV40 virus T antigen genes retain the ability to undergo squamous differentiation. Differentiation 38:60–66. doi: 10.1111/j.1432-0436.1988.tb00592.x. [DOI] [PubMed] [Google Scholar]
- 35.Hirakata Y, Yano H, Arai K, Endo S, Kanamori H, Aoyagi T, Hirotani A, Kitagawa M, Hatta M, Yamamoto N, Kunishima H, Kawakami K, Kaku M. 2010. Monolayer culture systems with respiratory epithelial cells for evaluation of bacterial invasiveness. Tohoku J Exp Med 220:15–19. doi: 10.1620/tjem.220.15. [DOI] [PubMed] [Google Scholar]
- 36.Forero A, Giacobbi NS, McCormick KD, Gjoerup OV, Bakkenist CJ, Pipas JM, Sarkar SN. 2014. Simian virus 40 large T antigen induces IFN-stimulated genes through ATR kinase. J Immunol 192:5933–5942. doi: 10.4049/jimmunol.1303470. [DOI] [PMC free article] [PubMed] [Google Scholar]
- 37.Lay MK, Gonzalez PA, Leon MA, Cespedes PF, Bueno SM, Riedel CA, Kalergis AM. 2013. Advances in understanding respiratory syncytial virus infection in airway epithelial cells and consequential effects on the immune response. Microbes Infect 15:230–242. doi: 10.1016/j.micinf.2012.11.012. [DOI] [PubMed] [Google Scholar]
- 38.Collins PL, Fearns R, Graham BS. 2013. Respiratory syncytial virus: virology, reverse genetics, and pathogenesis of disease. Curr Top Microbiol Immunol 372:3–38. doi: 10.1007/978-3-642-38919-1_1. [DOI] [PMC free article] [PubMed] [Google Scholar]
- 39.Tayyari F, Marchant D, Moraes TJ, Duan W, Mastrangelo P, Hegele RG. 2011. Identification of nucleolin as a cellular receptor for human respiratory syncytial virus. Nat Med 17:1132–1135. doi: 10.1038/nm.2444. [DOI] [PubMed] [Google Scholar]
- 40.Johnson SM, McNally BA, Ioannidis I, Flano E, Teng MN, Oomens AG, Walsh EE, Peeples ME. 2015. Respiratory syncytial virus uses CX3CR1 as a receptor on primary human airway epithelial cultures. PLoS Pathog 11:e1005318. doi: 10.1371/journal.ppat.1005318. [DOI] [PMC free article] [PubMed] [Google Scholar]
- 41.McDonald JU, Kaforou M, Clare S, Hale C, Ivanova M, Huntley D, Dorner M, Wright VJ, Levin M, Martinon-Torres F, Herberg JA, Tregoning JS. 2016. A simple screening approach to prioritize genes for functional analysis identifies a role for interferon regulatory factor 7 in the control of respiratory syncytial virus disease. mSystems 1:e00051-. doi: 10.1128/mSystems.00051-16. [DOI] [PMC free article] [PubMed] [Google Scholar]
- 42.Moraga I, Harari D, Schreiber G, Uze G, Pellegrini S. 2009. Receptor density is key to the alpha2/beta interferon differential activities. Mol Cell Biol 29:4778–4787. doi: 10.1128/MCB.01808-08. [DOI] [PMC free article] [PubMed] [Google Scholar]
- 43.Fang L, Choudhary S, Tian B, Boldogh I, Yang C, Ivanciuc T, Ma Y, Garofalo RP, Brasier AR. 2015. Ataxia telangiectasia mutated kinase mediates NF-kappaB serine 276 phosphorylation and interferon expression via the IRF7-RIG-I amplification loop in paramyxovirus infection. J Virol 89:2628–2642. doi: 10.1128/JVI.02458-14. [DOI] [PMC free article] [PubMed] [Google Scholar]
- 44.Hillyer P, Mane VP, Chen A, Dos Santos MB, Schramm LM, Shepard RE, Luongo C, Le Nouen C, Huang L, Yan L, Buchholz UJ, Jubin RG, Collins PL, Rabin RL. 2017. Respiratory syncytial virus infection induces a subset of types I and III interferons in human dendritic cells. Virology 504:63–72. doi: 10.1016/j.virol.2017.01.017. [DOI] [PMC free article] [PubMed] [Google Scholar]
- 45.Demeure CE, Wu CY, Shu U, Schneider PV, Heusser C, Yssel H, Delespesse G. 1994. In vitro maturation of human neonatal CD4 T lymphocytes. II. Cytokines present at priming modulate the development of lymphokine production. J Immunol 152:4775–4782. [PubMed] [Google Scholar]
- 46.Hillyer P, Raviv N, Gold DM, Dougherty D, Liu J, Johnson TR, Graham BS, Rabin RL. 2013. Subtypes of type I IFN differentially enhance cytokine expression by suboptimally stimulated CD4(+) T cells. Eur J Immunol 43:3197–3208. doi: 10.1002/eji.201243288. [DOI] [PubMed] [Google Scholar]
- 47.Chi B, Dickensheets HL, Spann KM, Alston MA, Luongo C, Dumoutier L, Huang J, Renauld JC, Kotenko SV, Roederer M, Beeler JA, Donnelly RP, Collins PL, Rabin RL. 2006. Alpha and lambda interferon together mediate suppression of CD4 T cells induced by respiratory syncytial virus. J Virol 80:5032–5040. doi: 10.1128/JVI.80.10.5032-5040.2006. [DOI] [PMC free article] [PubMed] [Google Scholar]
- 48.Barik S. 2013. Respiratory syncytial virus mechanisms to interfere with type 1 interferons. Curr Top Microbiol Immunol 372:173–191. doi: 10.1007/978-3-642-38919-1_9. [DOI] [PubMed] [Google Scholar]
- 49.Voigt EA, Yin J. 2015. Kinetic differences and synergistic antiviral effects between type I and type III interferon signaling indicate pathway independence. J Interferon Cytokine Res 35:734–747. doi: 10.1089/jir.2015.0008. [DOI] [PMC free article] [PubMed] [Google Scholar]
- 50.Mendoza JL, Schneider WM, Hoffmann HH, Vercauteren K, Jude KM, Xiong A, Moraga I, Horton TM, Glenn JS, de Jong YP, Rice CM, Garcia KC. 2017. The IFN-lambda-IFN-lambdaR1-IL-10Rbeta complex reveals structural features underlying type III IFN functional plasticity. Immunity 46:379–392. doi: 10.1016/j.immuni.2017.02.017. [DOI] [PMC free article] [PubMed] [Google Scholar]
- 51.Mordstein M, Neugebauer E, Ditt V, Jessen B, Rieger T, Falcone V, Sorgeloos F, Ehl S, Mayer D, Kochs G, Schwemmle M, Gunther S, Drosten C, Michiels T, Staeheli P. 2010. Lambda interferon renders epithelial cells of the respiratory and gastrointestinal tracts resistant to viral infections. J Virol 84:5670–5677. doi: 10.1128/JVI.00272-10. [DOI] [PMC free article] [PubMed] [Google Scholar]
- 52.Zhao Y, Jamaluddin M, Zhang Y, Sun H, Ivanciuc T, Garofalo RP, Brasier AR. 2017. Systematic analysis of cell-type differences in the epithelial secretome reveals insights into the pathogenesis of respiratory syncytial virus-induced lower respiratory tract infections. J Immunol 198:3345–3364. doi: 10.4049/jimmunol.1601291. [DOI] [PMC free article] [PubMed] [Google Scholar]
- 53.Fiedler MA, Wernke-Dollries K, Stark JM. 1995. Respiratory syncytial virus increases IL-8 gene expression and protein release in A549 cells. Am J Physiol 269:L865–L872. [DOI] [PubMed] [Google Scholar]
- 54.Spann KM, Tran KC, Collins PL. 2005. Effects of nonstructural proteins NS1 and NS2 of human respiratory syncytial virus on interferon regulatory factor 3, NF-kappaB, and proinflammatory cytokines. J Virol 79:5353–5362. doi: 10.1128/JVI.79.9.5353-5362.2005. [DOI] [PMC free article] [PubMed] [Google Scholar]
- 55.Thomson SJ, Goh FG, Banks H, Krausgruber T, Kotenko SV, Foxwell BM, Udalova IA. 2009. The role of transposable elements in the regulation of IFN-lambda1 gene expression. Proc Natl Acad Sci U S A 106:11564–11569. doi: 10.1073/pnas.0904477106. [DOI] [PMC free article] [PubMed] [Google Scholar]
- 56.Wei H, Wang S, Chen Q, Chen Y, Chi X, Zhang L, Huang S, Gao GF, Chen JL. 2014. Suppression of interferon lambda signaling by SOCS-1 results in their excessive production during influenza virus infection. PLoS Pathog 10:e1003845. doi: 10.1371/journal.ppat.1003845. [DOI] [PMC free article] [PubMed] [Google Scholar]
- 57.Hashimoto K, Ishibashi K, Ishioka K, Zhao D, Sato M, Ohara S, Abe Y, Kawasaki Y, Sato Y, Yokota S, Fujii N, Peebles RS Jr, Hosoya M, Suzutani T. 2009. RSV replication is attenuated by counteracting expression of the suppressor of cytokine signaling (SOCS) molecules. Virology 391:162–170. doi: 10.1016/j.virol.2009.06.026. [DOI] [PubMed] [Google Scholar]
- 58.Zheng J, Yang P, Tang Y, Pan Z, Zhao D. 2015. Respiratory syncytial virus nonstructural proteins upregulate SOCS1 and SOCS3 in the different manner from endogenous IFN signaling. J Immunol Res 2015:738547. doi: 10.1155/2015/738547. [DOI] [PMC free article] [PubMed] [Google Scholar]
- 59.Moore EC, Barber J, Tripp RA. 2008. Respiratory syncytial virus (RSV) attachment and nonstructural proteins modify the type I interferon response associated with suppressor of cytokine signaling (SOCS) proteins and IFN-stimulated gene-15 (ISG15). Virol J 5:116. doi: 10.1186/1743-422X-5-116. [DOI] [PMC free article] [PubMed] [Google Scholar]
- 60.Le Nouen C, Munir S, Losq S, Winter CC, McCarty T, Stephany DA, Holmes KL, Bukreyev A, Rabin RL, Collins PL, Buchholz UJ. 2009. Infection and maturation of monocyte-derived human dendritic cells by human respiratory syncytial virus, human metapneumovirus, and human parainfluenza virus type 3. Virology 385:169–182. doi: 10.1016/j.virol.2008.11.043. [DOI] [PMC free article] [PubMed] [Google Scholar]
- 61.Biacchesi S, Skiadopoulos MH, Tran KC, Murphy BR, Collins PL, Buchholz UJ. 2004. Recovery of human metapneumovirus from cDNA: optimization of growth in vitro and expression of additional genes. Virology 321:247–259. doi: 10.1016/j.virol.2003.12.020. [DOI] [PubMed] [Google Scholar]
- 62.Hillyer P, Mane VP, Schramm LM, Puig M, Verthelyi D, Chen A, Zhao Z, Navarro MB, Kirschman KD, Bykadi S, Jubin RG, Rabin RL. 2012. Expression profiles of human interferon-alpha and interferon-lambda subtypes are ligand- and cell-dependent. Immunol Cell Biol 90:774–783. doi: 10.1038/icb.2011.109. [DOI] [PMC free article] [PubMed] [Google Scholar]
- 63.Renn LA, Theisen TC, Navarro MB, Mane VP, Schramm LM, Kirschman KD, Fabozzi G, Hillyer P, Puig M, Verthelyi D, Rabin RL. 24 March 2015. High-throughput quantitative real-time RT-PCR assay for determining expression profiles of types I and III interferon subtypes. J Vis Exp. doi: 10.3791/52650. [DOI] [PMC free article] [PubMed] [Google Scholar]
- 64.Robitaille AC, Mariani MK, Fortin A, Grandvaux N. 24 January 2016. A high resolution method to monitor phosphorylation-dependent activation of IRF3. J Vis Exp. doi: 10.3791/53723. [DOI] [PMC free article] [PubMed] [Google Scholar]
- 65.Sheikh F, Dickensheets H, Pedras-Vasconcelos J, Ramalingam T, Helming L, Gordon S, Donnelly RP. 2015. The interleukin-13 receptor-alpha1 chain is essential for induction of the alternative macrophage activation pathway by IL-13 but not IL-4. J Innate Immun 7:494–505. doi: 10.1159/000376579. [DOI] [PMC free article] [PubMed] [Google Scholar]
- 66.Schreiber E, Matthias P, Muller MM, Schaffner W. 1989. Rapid detection of octamer binding proteins with ‘mini-extracts’, prepared from a small number of cells. Nucleic Acids Res 17:6419. doi: 10.1093/nar/17.15.6419. [DOI] [PMC free article] [PubMed] [Google Scholar]
- 67.Iwamura T, Yoneyama M, Yamaguchi K, Suhara W, Mori W, Shiota K, Okabe Y, Namiki H, Fujita T. 2001. Induction of IRF-3/-7 kinase and NF-kappaB in response to double-stranded RNA and virus infection: common and unique pathways. Genes Cells 6:375–388. doi: 10.1046/j.1365-2443.2001.00426.x. [DOI] [PubMed] [Google Scholar]
- 68.Benjamini Y, Hochberg Y. 1995. Controlling the false discovery rate—a practical and powerful approach to multiple testing. J R Stat Soc Ser B 57:289–300. [Google Scholar]
- 69.Krämer A, Green J, Pollard J Jr, Tugendreich S. 2014. Causal analysis approaches in Ingenuity Pathway Analysis. Bioinformatics 30:523–530. [DOI] [PMC free article] [PubMed] [Google Scholar]
Associated Data
This section collects any data citations, data availability statements, or supplementary materials included in this article.