Abstract
HIV-infected adults may be likely to have metabolic syndrome (MS) at younger ages and in the absence of obesity compared with general population. In the present study, we determined prevalence of MS and its association with oxidative deoxy nucleic acid (DNA) damage in HIV-1 infected patients with different ART status. We used plasma level of the oxidized base, 8-hydroxy-2-deoxyguanosine (8-OHdG), as a biomarker of oxidative DNA damage. To measure plasma 8-OHdG we used 8-OHdG enzyme-linked, immunosorbent assay. The biomarkers of MS were insulin resistance, Cholesterol/HDL ratio, Waist circumference and Hypertension. MS and oxidative DNA damage were significantly higher in HIV-positive patients with second line ART and first line ART than ART-naive patients. In a logistic regression analysis, increased MS was positively associated with the increased DNA damage (OR: 29.68, 95%:13.47, CI: 65.40) P = 0.0001. ART plays a significant role in the development of MS and oxidative DNA damage in HIV-positive patients taking antiretroviral therapy. Awareness and knowledge of MS and DNA damage in HIV/AIDS patients may prove helpful to clinicians to manage non-AIDS diseases such as cardiovascular disease and cancer. To determine exact role of ART in induction of MS and DNA damage larger studies are warranted.
Keywords: DNA damage, Human immunodeficiency virus (HIV) infection, Insulin resistance, Metabolic syndrome, 8-OH-dG
Introduction
The AIDS epidemic continues to spread in the South-East Asia (SEA) Region. The South-East Asia is the second most affected WHO region in the world, after sub-Saharan Africa. To date, close to 40 million people throughout the world have been infected with human immunodeficiency virus (HIV). Of these, almost 6.4 million are in the SEA Region. Over 99 per cent of cases have been reported from four countries—Thailand, India, Indonesia and Myanmar [1]. Combination antiretroviral therapy (ART) has positively modified the natural history of HIV infection, leading to a significant reduction in morbidity and mortality. However, long-term toxicity is becoming recognized, and a variety of metabolic abnormalities including dyslipidemia, fat redistribution, high blood pressure, and insulin resistance have frequently been associated with this therapy, particularly when it contains protease [2–4].
A growing body of evidence suggests that up to 60% of treated patients develop a complex of metabolic alterations, to varying degrees, which is emerging as a significant medical concern. These alterations include fat tissue redistribution (peripheral lipodystrophy and increased central adiposity), dyslipidemia and systemic insulin resistance. The last is characterized clinically by elevated fasting insulin and/or C-peptide levels, and was confirmed using euglycemic-hyperinsulinemic clamp studies. The clinical significance of these side-effects is the exposure of patients to an apparent increased risk for developing premature cardiovascular morbidity, as well as to new-onset or aggravated type 2 diabetes [5–7]. Although metabolic alterations have also been described in (HIV protease inhibitor HPI) HPI-sparing HAART regimens, an increasing amount of data attributes a role for this class of drugs in the induction of insulin resistance. The term lipodystrophy was initially used to summarize these clinical and metabolic modifications. The most important metabolic abnormalities observed in HIV-patients during cART include: insulin resistance (IR) with hyperinsulinemia and glucose intolerance, hypercholesterolemia with low levels of HDL-cholesterol, hypertriglyceridemia, lactic acidemia and hypercoagulopathy. Lipodystrophy also associates fat redistribution: subcutaneous lipid stores wasting (Bichat’s fat pad, buttocks and extremities), central adiposity and fat accumulation in the dorsocervical region (lipohypertrophy). As patients with these metabolic abnormalities have relatively high rates of experiencing a cardiovascular event, there is growing concern about the potential damaging impact of cART in HIV-positive patients. Metabolic abnormalities may result from various and combined effects of cART antiretroviral drugs. The present study focuses on the prevalence and characteristics of the metabolic syndrome and its association with oxidative DNA damage in HIV-infected patients with and without antiretroviral drug exposure. The drugs implicated include nucleoside reverse transcriptase inhibitors (major components of first-line therapy in India) and also protease inhibitors (components of current second-line therapy in India). In India, where there is genetic predisposition to insulin resistance and cardiovascular risk, this impact may be significant [8]. Insulin resistance plays a key role in the pathogenesis of the metabolic syndrome and is frequently detected among HIV patients on ART [9–12]. Several studies have found that the various drugs included in ART regimens have different effects on patients’ cholesterol and fatty acid balance. The therapy seems to affect the risks of heart diseases by increasing cholesterol levels and changing fat distribution, particularly increasing abdominal fat. For example nucleoside reverse transcriptase inhibitors (NRTIs), stavudine mainly causes increased blood levels of triglycerides (TG), low density lipoprotein cholesterol (LDL-C) and total cholesterol (TC). All of the protease inhibitors (PIs) except atazanavir have been associated with hyperlipidemia, for example ritonavir-boosted PIs, cause elevations of LDL, TC and TGs and a decrease in high density lipoprotein cholesterol (HDL-C) [13].
Oxidative damage results from biochemical interactions between reactive oxygen species (ROS) and target bio-molecules. ROS can damage nucleic acids, lipids, and proteins; this damage figures prominently in the etiology and progression of numerous cancers as well as coronary and carotid atherosclerosis. Although many damaged DNA lesions have been identified, we have chosen 8-hydroxy-2-deoxyguanosine (8-OHdG) as our biomarker of oxidative damage [14]. The importance of this lesion stems from the fact that it is both abundant in DNA and it is mutagenic. Current evidence suggests that 8-OHdG lesions present in DNA during cellular replication results in somatic mutation, the driving force behind carcinogenesis [15, 16].
Although cardiovascular risk factors have been extensively evaluated in HIV-infected patients, the identification and management of metabolic disorders in those receiving combination ART has become a critical issue. The present study focuses on the prevalence and characteristics of the metabolic syndrome and its association with oxidative DNA damage in HIV-infected patients with and without antiretroviral drug exposure and compared it with HIV-negative controls.
Materials and Methods
Subject Selection
This was a case–control study. The study was carried out on HIV-1 infected patients at the outpatient infectious disease unit (OPD) and ART centre of the Sir J J Hospital and Grant Government Medical College, Mumbai over a period of 1 year, from February 2014 to March 2015. We have selected 300 subjects from OPD after evaluation of their medical records (negative serial ELISA/Western blot for HIV before three months of sample collection) as HIV-negative controls and 300 HIV-positive subjects detected by serial ELISA/Western blot method from ART centre. We used power analysis method for sample selection at 5% significance level for 95% confidence.
Ethical Approval
The protocol study was approved by the institutional ethics committee (No. IEC/Pharm/902/2013) and National AIDS Control Organisation Delhi, India (T-11020/67/2011-NACO).
Inclusion Criteria
All participants were 20 years of age or older HIV-positive patients detected by serial ELISA/Western blot method and were included in this study after getting their informed consent. We recorded the family history of all subjects. We choose the subjects without any diabetes history. Normal control HIV-negative subjects (n = 300) who are negative to ELISA/Western blot test for HIV before three months of sample collection, were selected from outpatient department of Sir J.J. Group of Hospitals, Mumbai Maharashtra, India.
Exclusion Criteria
Exclusion criteria included pregnant women, patients with chronic diseases like hepatitis, diabetes or family history of diabetes, renal impairment, cardiovascular co-morbidities, neurological psychiatric disorders, various malignancies, as well as heavy smokers, alcoholics, and tobacco-chewers and HIV patients with withdrawal of combination ART. We collected the demographic details from each patient and entered it into the pro-forma. Subsequent to this, we took a detailed history.
Sample Collection
We collected the venous blood samples in plain and lithium heparin vaccutainers as an anticoagulant. Blood was centrifuged (4000g, 10 min, 4 °C) to separate the plasma. The collected plasma was stored at −70 °C with aseptic precautions. Plain blood samples 2 h after collection were centrifuged at 3000 rpm for 5 min; serum was separated and collected in sterile tubes.
Information on demographic characteristics, physical measurements (waist circumference and blood pressure), anthropometric and biochemical measurements such as blood glucose, lipid profile was collected from each study subject. Hypertension (High blood pressure) as classified as BP of systolic blood pressure ≥130 mmHg and/or diastolic blood pressure ≥85 mmHg, these two readings were obtained, and the average of the systolic and diastolic blood pressure readings was used.
In the ATP III report of 2001, individuals with three or more of the following criteria are defined as having the metabolic syndrome. Waist circumference >102 cm in men and >88 cm in women; triglycerides ≥150 mg*dl (1.69 mmol/l); HDL cholesterol <40 mg*dl (1.04 mmol/l) in men and <50 mg*dl (1.29 mmol/l) in women; blood pressure ≥130/85 mmHg; Insulin resistance <2.8 using HOMA; Cholesterol/HDL ratio <5. In this research study, we used Cholesterol/HDL ratio, Insulin resistance, waist circumference and blood pressure as biomarkers for metabolic syndrome. We considered all subjects positive for metabolic syndrome, which were having abnormal level of these parameters.
Different Treatment Regimens as per NACO Guidelines
The list of antiretroviral therapy administered to Indian HIV-1 patients is as follows:
The first-line therapy includes Tenofovir, Lamivudine and Efavirenz.
The second-line therapy includes Tenofovir, Lamivudine, Ritonavir and Atazanavir.
Biochemical Methods
Determination of Blood Glucose
We estimated fasting blood glucose levels by the hexokinase (enzymatic) method spectrophotometrically in R × L dimension automated equipment.
Determination of Fasting Insulin
Fasting insulin was determined by using Immulite 1000 Insulin kit from Siemens using chemiluminescence. We used the homeostasis model assessment-insulin resistance (HOMA-IR) index [17], first described by Matthews et al. in 1985 to determine insulin resistance. The formula used to calculate HOMA-IR was:
We assumed a HOMA-IR value of >2.8 to define IR, from previous studies on insulin resistance [18].
Determination of DNA Damage Marker 8-Hydroxy-2-deoxyguanosine (8-OHdG)
We used plasma levels of the oxidized base, 8-hydroxy-2-deoxyguanosine (8-OHdG), as our biomarker of oxidative damage [14]. 8-OHdG was measured with the highly sensitive 8-OHdG check enzyme-linked immunosorbent assay (ELISA) kit (StressXpress ELA Kit). StressMarq’s 8-OH-d G ELA is a competitive assay that can be used for the quantification of 8-OH-d G in urine, cell culture, plasma, and saliva. The ELA utilizes an anti-mouse IgG-coated plate and tracer consisting of an 8-OH-d G enzyme conjugate. It is important to note that the OH-d G antibody used in this assay recognizes both free 8-OH-d G and DNA- incorporated 8-OH-d G. Since complex samples such as plasma, cell lysates, and tissues are comprised of mixtures of DNA fragments and free 8-OH-d G. The assay is based on the competition between 8-hydroxy-2-deoxyguanosine (8-OHdG) and a 8-OHdG-acetylcholinesterase (AChE) conjugate (8-OHdG Tracer) for a limited amount of 8-OH-d G Monoclonal Antibody. Because the concentration of 8-OH-d G Tracer is held constant while the concentration of 8-OH-d G varies, the amount of 8-OH-d G Tracer that is able to bind to the 8-OH-d G Monoclonal Antibody will be inversely proportional to the concentration of 8-OH-d G in the well. This antibody-8-OH-d G complex binds to goat polyclonal anti-mouse IgG that is previously attached to the well. The plate is washed to remove any unbound reagents and then Ellman’s Reagent (which contains the substrate to AChE) is added to the well. The product of this enzymatic reaction has a distinct yellow colour and absorbs strongly at 412 nm. The intensity of this colour, determined by ELISA Reader, is proportional to the amount of 8-OH-d G Tracer bound to the well, which is inversely proportional to the amount of free 8-OH-d G present in the well during the incubation. We followed all the procedures as manufacturer’s instructions.
Preparation of Data
Average absorbance reading of the NSB well and average absorbance reading of B0 wells were determined. Then we subtracted the average NSB readings from average B0 readings and calculated %B/B0 (% of Sample or Standard Bound/Maximum Bound). Then we obtained a Standard curve plot %B/B0 for Standards using 4 parameter logistic equations. The sample concentration was determined using above equation.
Statistical Methods
Student’s t test was performed to assess differences between two means. Statistical analysis was performed using EPI-INFO7statistical software for medical research studies. Charts were produced using Microsoft® Excel 2007. Comparison of group means of all parameters was performed using the ANOVA test. Categorical data and the prevalence of MS in HIV-infected patients were compared using the Pearson’s Chi Square test. A p value < 0.05 was considered statistically significant. We used logistic regression method for correlation of metabolic syndrome and DNA damage marker 8-OH-dG. Crude and Adjusted Odds Ratios (OR) with 95% confidence intervals (CI) was reported.
Results and Discussion
A majority of the naïve-ART group of patients were in the primary clinical stage of infection while those on second- line treatment (protease inhibitor-containing HAART) group were at clinical stage 2 of infection. The mean CD4 count was highest among the naïve-ART group of patients, followed by the first-line treatment group of patients. No participant was on lipid lowering drugs. The details of the demographic, anthropometric, HIV status and other characteristics of the 600 participants are shown in (Tables 1, 2).
Table 1.
Demographic, HIV status and other characteristics of the 600 participants
| Characteristics | 2nd line ART (n = 100) | 1st line ART (n = 100) | ART naïve (n = 100) | Control (n = 300) | ||||
|---|---|---|---|---|---|---|---|---|
| Age group (year) | 20–40 | 40–60 | 20–40 | 40–60 | 20–40 | 40–60 | 20–40 | 40–60 |
| HIV status | Positive | Positive | Positive | Positive | Positive | Positive | Negative | Negative |
| Gender | ||||||||
| Male | 36 | 43 | 30 | 41 | 28 | 33 | 87 | 92 |
| Female | 14 | 7 | 20 | 9 | 22 | 17 | 63 | 58 |
| Mean age ± SD | 35.6 ± 4.3* | 47.5 ± 5.3* | 34.3 ± 5.2* | 48.3 ± 4.8* | 31.6 ± 4.2* | 45.2 ± 6.1* | 34.8 ± 5.1* | 47.3 ± 5.4* |
| Mean CD4 count ± SD (cells/μL) | 400 ± 144* | 376 ± 183* | 502 ± 233* | 465 ± 165* | 624 ± 202* | 602 ± 134* | NA | NA |
CD4 Cluster of differentiation. The data were analyzed by one-way ANOVA
* P < 0.05 significant when compared to control
Table 2.
Clinical, anthropometric and biochemical characteristics of study population
| Characteristics | 2nd line ART (n = 100) | 1st line ART (n = 100) | ART naïve (n = 100) | Control (n = 300) | ||||
|---|---|---|---|---|---|---|---|---|
| Age group (year) | 20–40 | 40–60 | 20–40 | 40–60 | 20–40 | 40–60 | 20–40 | 40–60 |
| HIV diagnosed time in months (mean ± SD) | 53.8 | 78.5 | 68.0 | 80.4 | 22.7 | 34.9 | NA | NA |
| Time on ART in months (mean ± SD) | 51.3 | 76.8 | 63.6 | 65.7 | NA | NA | NA | NA |
| Cholesterol/HDL ratio ± SD | 7.4 ± 3.2** | 7.9 ± 3.4** | 6.1 ± 2.4** | 7.3 ± 3.9** | 3.8 ± 1.0** | 3.7 ± 0.9** | 3.4 ± 0.7 | 3.7 ± 0.7 |
| Blood Pressure [mean of systolic and diastolic BP (mmHg) ± SD] | 109 ± 8.5** | 111 ± 9.2** | 106 ± 7.6** | 111 ± 8.7** | 102 ± 5.8** | 103 ± 7.2** | 101 ± 3.5 | 101 ± 3.6 |
| Waist circumference (cm ± SD) M-male/F-female | M-96.3 F-91.36 |
M-98.95 F-91.67 |
M-86.60 F-88 |
M-93.98 F-91.67 |
M-83.11 F-75.96 |
M-85.09 F-79.50 |
M-81.84 F-79 |
M-81.96 F-79.45 |
| Insulin resistance (HOMA) ± SD | 6.62 ± 5.29** | 8.15 ± 7.07** | 4.83 ± 3.21** | 6.05 ± 4.14** | 2.48 ± 1.05** | 3.05 ± 1.56** | 1.80 ± 0.81 | 1.91 ± 0.87 |
| 8-OHdG (ng/ml) ± SD | 2.79 ± 0.95** | 3.27 ± 0.99** | 2.50 ± 0.91** | 3.13 ± 0.92** | 1.81 ± 0.66** | 1.95 ± 0.56** | 1.07 ± 0.25 | 1.30 ± 0.32 |
HIV detected time in months, time on ART in months, cholesterol/HDL ratio, blood pressure (means of systolic and diastolic blood pressure), waist circumference, insulin resistance (Homeostasis model assessments), DNA damage marker 8-hydroxy-2-deoxyguanosine (8-OHdG). Values are mean ± SD of subjects. The data were analyzed by one-way ANOVA. ** P < 0.01 significant when compared to control
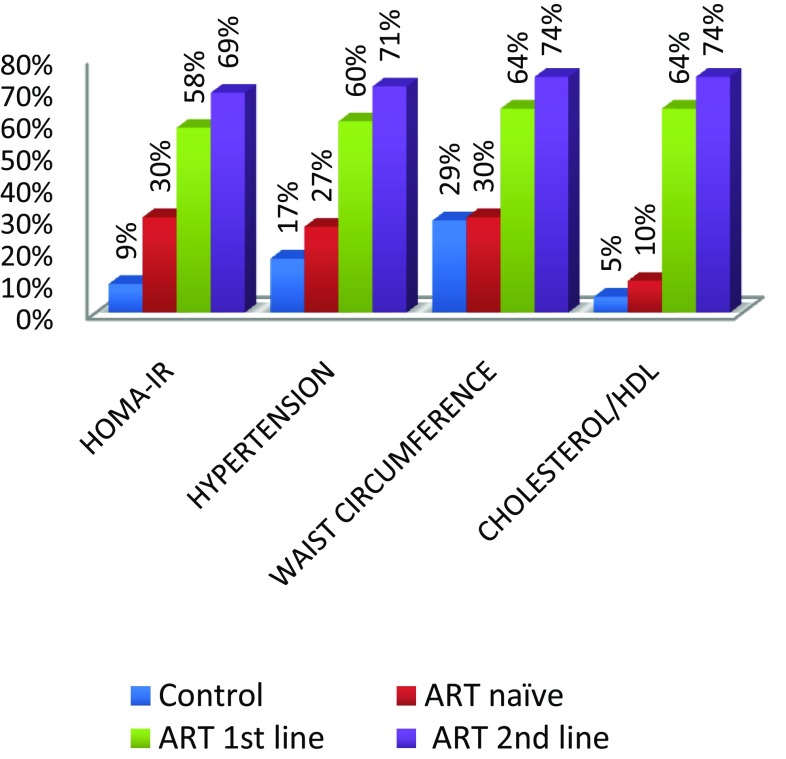
We evaluated the prevalence of the components of MS. The highest to the lowest prevalent component were Cholesterol/HDL ratio (74%), abdominal obesity (74%), hypertension (71%) and insulin resistance (69%). The frequency distribution of the occurrence of these components is shown on Fig. 6. The overall prevalence of MS and DNA damage in this study (Table 3) was 38% in (40–60 years) and 31% in (20–40 years) age group and 42% in (40–60 years) and 30% in (20–40 years) age group with significant differences in the prevalence among groups (P < 0.05). The prevalence of MS among the HIV-infected patients was 15.6% (27/173) and 8% (4/50) among the controls. The association of DNA damage and metabolic syndrome was determined using logistic regression analysis with the help of epi-info. In a logistic regression analysis, increased DNA damage was positively associated with the increased MS (OR: 29.68, 95%:13.47, CI: 65.40) P = 0.0000.
Fig. 6.
Percentage of the components of metabolic syndrome in groups
Table 3.
Prevalence of metabolic syndrome and DNA damage among groups
| Treatment | Prevalence of DNA damage (%) | Prevalence of MS (%) | P value |
|---|---|---|---|
| 2nd line ART (n = 100) | 83 | 71 | <0.05 |
| 1st line ART (n = 100) | 75 | 60 | <0.05 |
| ART naïve (n = 100) | 38 | 27 | <0.05 |
| Control (n = 300) | 7 | 17 |
For the association of DNA damage and MS we compared the two age groups (20–40 years) and (40–60 years). These two groups showed positive association (OR: 3.03, 95%1.73, CI: 5.3) P = 0.0001. There was no significant association between ART first-line and ART second-line (P = 0.67). Our results shows that there was significant association between ART-Naïve and ART first-line (P = 0.005) and ART first-line and controls (P = 0.000). We observed a strong association between DNA damage and prevalent metabolic syndrome among HIV-infected individuals taking ART. This suggests that with traditional risk factors, ART might play a major role in the development of metabolic syndrome and DNA damage among HIV-infected adults.
As HIV positive people survive longer, they are at increased risk for a variety of non-AIDS conditions even when their CD4 cell counts are high. Insulin resistance (IR) has been increasingly recognized in HIV-infected individuals since the introduction of effective antiretroviral therapy (ART) [18–20]. Insulin resistance (impaired insulin action) contributes many disease processes. These include type 2 diabetes and the cluster of cardiovascular risk factors known as ‘metabolic syndrome’, as well as polycystic ovarian syndrome, non-alcoholic fatty liver disease [21, 22]. Adipose tissue is a key target for ART in inducing insulin resistance, as the metabolic syndrome described in patients taking HAART consists of gross alterations in fat tissue distribution and dyslipidemia, including elevated circulating free fatty acid and glycerol levels. Adipose tissue is now believed to play a major role in the pathogenesis of systemic insulin resistance [23–25]. Biochemistry of Insulin resistance: Pancreatic b-cells release insulin in response to hyper-glycemia, stimulating muscle and adipose tissue to store sugar and blocking the liver from releasing glucose into circulation. Insulin resistance occurs when glucose uptake is insufficiently stimulated and hepatic glucose release is permitted. Persistent hyper-glycemia results, with the eventual development of Type 2 diabetes mellitus. The estimated incidence of glucose metabolism disorders in the HIV-infected population is between 2 and 25% with a 2.2-fold increase in the relative risk of Type 2 diabetes mellitus [26, 27].
Our study demonstrated that cholesterol/HDL ratio (49.3%), abnormal abdominal obesity (56%), hypertension (52.6%) and insulin resistance (52.3%) were the prevalent metabolic syndrome components in HIV positive patients. In a cross-sectional study in Barcelona using 710 HIV-infected patients, demonstrated that hypertriglyceridemia (95%) was the most frequent trait of MS, followed by low HDL cholesterol (71.1%), high blood pressure (67.8%), abdominal obesity (47.1%), and high blood glucose levels (46.3%). Another study with 477 HIV-infected adults in the US revealed that the most common metabolic abnormalities were low HDL (54%) and high triglycerides (47%) and the least common was high blood glucose (4%). The prevalence of high blood pressure and abdominal obesity were 33 and 25% respectively [28]. In our study, the prevalence of MS components was dissimilar among the second-line, first-line and ART-naïve HIV patients. The prevalence of MS among the HIV patients was 49.6 and 2% among the uninfected group (controls).
Insulin Resistance
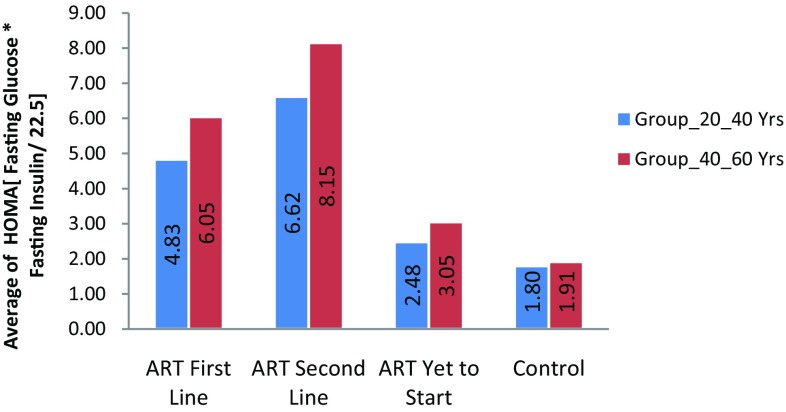
Insulin resistance was significantly higher in HIV-1 positive patients with antiretroviral therapy than HIV negative subjects were. In this study, we measured insulin resistance by HOMA-IR that is homeostatic model assessment insulin resistance index. The mean HOMA for HIV positive patients was higher than that for HIV negative subjects. (Refer Fig. 1). The prevalence of IR in ART naive HIV positive patients with age group (20–40 years) were 11 (22%) and in age group (40–60 years) were 19 (38%). The IR was significant in HIV positive patients in both age groups (20–40 years) and (40–60 years) with ART (First line) were 27 (54%) and 34 (68%) and (Second line) 31(62%) and 35(70%). (Refer to Fig. 6). These results show there was increase in insulin resistance in HIV positive patients with Antiretroviral Therapy than HIV-negative subjects. (Refer Table 2; Figs. 1, 6). Insulin resistance is one of the major aggravating factors for metabolic syndrome. In particular, free fatty acid and various adipose-derived peptides (adipokines) have been identified as modulators of whole-body insulin sensitivity. The systemic insulin resistance seen in patients taking HAART also involves impaired insulin responsiveness in skeletal muscle and liver [28]. In addition, PI use among individuals from developed countries, usually older males, has been associated with the development of diabetes and hypertriglyceridemia [2].
Fig. 1.
Average insulin resistance in groups
Hypertension
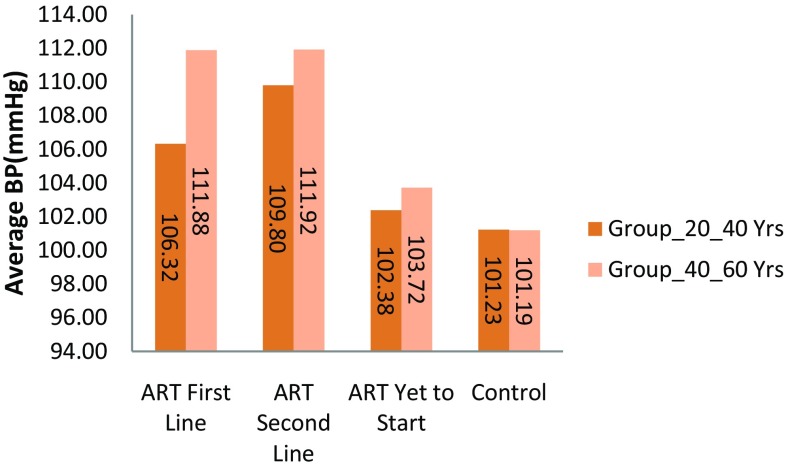
Hypertension was significantly higher in HIV-1 positive patients with antiretroviral therapy than HIV negative subjects were. In this study, we measured hypertension by taking average of systolic blood pressure and diastolic blood pressure. We considered 104 mmHg> value as the indication of hypertension. The mean hypertension for HIV positive patients was higher than that for HIV negative subjects. (Refer to Fig. 2). The prevalence of hypertension in ART naive HIV positive patients with age group (20–40 years) was 27% and in age group (40–60 years) were 19 (38%). The hypertension was significant in HIV positive patients in both age groups (20–40 years) and (40–60 years) with ART (First line) were 27 (54%) and 34 (68%) and (Second line) 31(62%) and 35(70%). (Refer Fig. 6). These results show there was increase in hypertension in HIV positive patients with Antiretroviral Therapy than HIV-negative subjects as shown in Table 2. (Refer Figs. 2, 6).
Fig. 2.
Average hypertension (mean of systolic and diastolic blood pressure) in groups
Waist Circumference
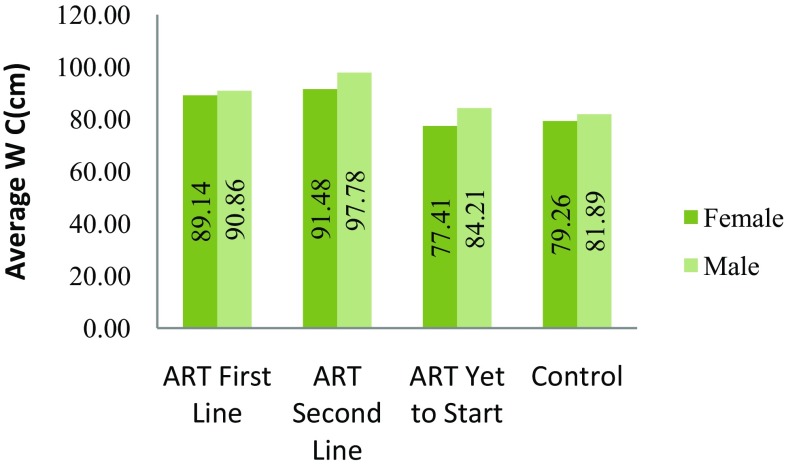
Abnormal abdominal obesity was significantly higher in HIV-1 positive patients with antiretroviral therapy than HIV negative subjects were. In this study, abnormal abdominal obesity was measured by measuring waist circumference in cm. We considered abnormal abdominal obesity was present when waist circumference was >102 cm in men and >88 cm in women. The mean waist circumference for HIV positive patients was higher than that for HIV negative subjects (Refer to Fig. 3). The prevalence of abnormal abdominal obesity in ART naive HIV positive patients was 30% and in control it was 29% (Fig. 4, 5). The abnormal abdominal obesity was significant in HIV positive patients with ART (First line) was 64% and and (Second line) 74% (Refer Fig. 6). These results show there was increase in abnormal abdominal obesity in HIV positive patients with Antiretroviral Therapy than HIV-negative subjects as shown in Table 2. (Refer Figs. 3, 6).
Fig. 3.
Average of waist circumference in male and female subjects from groups
Fig. 4.
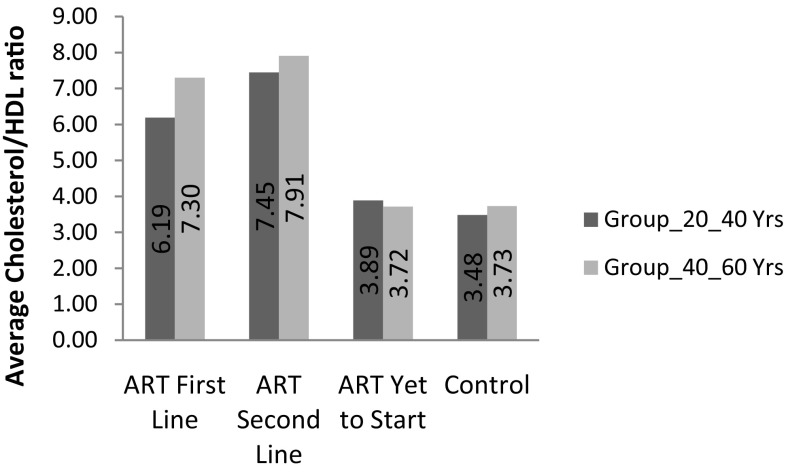
Average cholesterol/HDL ratio in groups
Fig. 5.
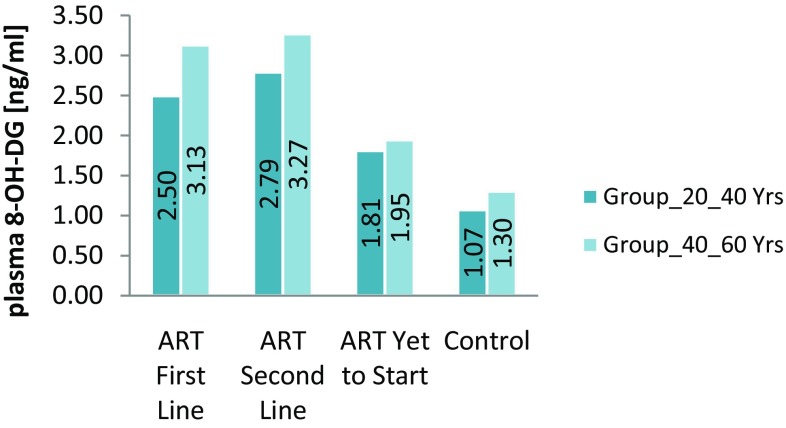
Average DNA damage marker 8-OH-dG in groups
Cholesterol/HDL Ratio
The lipid profile differed among the groups. A statistically significant difference existed in the mean of cholesterol/HDL ratio between the first-line (0.58) and second-line patients (0.74) (P = 0.005). We observed increased between cholesterol/HDL the first-line and the ART-naïve (0.1) patients (P = 0.001) in age group (20–40 years) and between the first-line (0.70) and second-line patients (0.74) (P = 0.005) and between the first-line and the ART-naïve (0.1) patients (P = 0.001) in age group (40–60 years). The mean of cholesterol/HDL ratio was significantly higher among the HAART-treated patients than in the untreated patients (P = 0.001). Dyslipidemia was prevalent among the second-line group of patients (74.0%) followed by the first-line group of patients (64%) while the naïve-ART patients had a prevalence of 10%. In the controls, the prevalence was 5% (Refer Fig. 4).
DNA Damage Marker 8-OH-dG
Under normal physiological conditions in all aerobic organisms, there is a balance maintained between endogenous oxidants and numerous enzymatic and non-enzymatic antioxidant defences. When an imbalance occurs, oxidants produce extensive oxidative damage to DNA, which, in turn, contributes to aging, malignant tumours, and other degenerative diseases.
DNA damage was significantly higher in HIV-1 positive patients with antiretroviral therapy than HIV negative subjects were. In this study, we measured DNA damage marker 8-OH-dG by ELISA. The mean 8-OH-dG for HIV positive patients was higher than that for HIV negative subjects. Antiretroviral therapy accelerates DNA damage in HIV positive patients. (Refer Fig. 5). These results show there was increase in DNA damage in HIV positive patients with Antiretroviral Therapy. (Refer Table 2). Under normal physiological conditions in all aerobic organisms, there is a balance maintained between endogenous oxidants and numerous enzymatic and non-enzymatic antioxidant defences. When an imbalance occurs, oxidants produce extensive oxidative damage to DNA, which, in turn, contributes to aging, malignant tumours, and other degenerative diseases. In all living cells, damaged DNA is repaired enzymatically so that they regain their normal function, whereas mis-repaired DNA can result in mutations (base substitution, deletions, and strand fragmentation) leading to carcinogenesis. Although a broad range of DNA products are produced during oxidative damage to DNA (bases and sugar modifications, covalent cross links, single and double-stranded breaks), most interest focused on nucleobase modifications and especially on the abundant lesion of 8-oxo-2-deoxyguanosine because it is formed in vivo and can be measured quantitatively in cells following hydrolysis of the DNA to component bases. That oxidative stress-induced DNA lesions may contribute to carcinogenesis is suggested by the increased cancer susceptibility of persons with a variety of chronic inflammatory diseases, such as ulcerative colitis, viral hepatitis, prostatitis, Helicobacter pylori infection, parasitic diseases, and others. In these diseases, cancer induction may be a pathological consequence of elevated ROS levels, which lead to increased steady-state levels of oxidative DNA damage, which in turn leads to a higher risk of mutations that may activate onco-genes or inactivate tumour-suppressor genes. The presence of persistent DNA lesions in tumour cells has led many to propose that DNA damage markers are potential biomarkers for screening ongoing oxidative stress and for cancer diagnostics and prediction [16].
Our study demonstrated that the prevalence of DNA damage was dissimilar among the second-line (83%), first-line (75%) and ART-naïve (38%). The prevalence of DNA damage among the HIV patients was 65.3 and 7% among the uninfected group (controls).
The important observation of our study was significantly increased metabolic syndrome and DNA damage in HIV-positive patients taking first line ART and second line ART than ART naive and controls. Thus there was a positive correlation between these two biomarkers in HIV-positive patients with ART. ART induced increased oxidative stress may be the cause of the metabolic syndrome and DNA damage in HIV-positive patients. Better understanding of the mechanism of ROS-induced metabolic syndrome and DNA damage will help to develop effective strategies to prevent and/or treat HIV infection. This is in line with several studies, which have reported that the metabolic syndrome is more common in subjects with HIV infection than in HIV-negative individuals [3].
In this study, the prevalence of MS and DNA damage were higher in age group (40–60 years) 28 and 42.3% than in age group (20–40 years) 23.6 and 30%. MS and DNA damage were more prevalent among patients on second-line treatment. Our finding supports those from other studies reporting that MS is usually most prevalent among HIV patients on protease inhibitor-based HAART.
Conclusion
Although the substantial benefits of combination ART clearly outweigh the increase in cardiovascular risk associated with this therapy, it must be borne in mind that with progressive aging of the HIV-infected population and the expected long-term use of combination ART, the need will arise to prevent an increased incidence of metabolic syndrome in this population. MS presence is associated with an increased risk of diabetes, cardiovascular events, stroke and death, the reduction of its prevalence must be considered an essential therapeutic target in HIV-patients undergoing antiretroviral therapy. Further increase in DNA damage increases the opportunity of various types of cancers. Hence, management of metabolic syndrome and DNA damage should be prime concern for health care physicians.
Acknowledgements
National AIDS Control Organisation (NACO) Delhi, Mumbai District AIDS Control Society (MDACS) Mumbai and ART Centre Sir J J Group of Hospitals Mumbai supported this study.
Compliance with Ethical Standards
Conflict of interest
All authors declared that there are no conflicts of interest in this manuscript.
References
- 1.Vajpayee M, Mohan T. Current practices in laboratory monitoring of HIV infection. Indian J Med Res. 2011;134:801–822. doi: 10.4103/0971-5916.92627. [DOI] [PMC free article] [PubMed] [Google Scholar]
- 2.Hernandez-Romieu AC, Garg S, Rosenberg Eli S, et al. Is diabetes prevalence higher among HIV-infected individuals compared with the general population? Evidence from MMP and NHANES 2009–2010. BMJ Open Diabetes Res Care. 2017;5:e000304. doi: 10.1136/bmjdrc-2016-000304. [DOI] [PMC free article] [PubMed] [Google Scholar]
- 3.Mbunkah HA, Meriki HD, Kukwah AT, et al. Prevalence of metabolic syndrome in human immunodeficiency virus-infected patients from the South-West region of Cameroon, using the adult treatment panel III criteria. Diabetol Metab Syndr. 2014;6:92. doi: 10.1186/1758-5996-6-92. [DOI] [PMC free article] [PubMed] [Google Scholar]
- 4.Van der Valk M, Bisschop PH, Romijn JA, et al. Lipodystrophy in HIV-1-positive patients is associated with insulin resistance in multiple metabolic pathways. AIDS. 2001;15:2093–2100. doi: 10.1097/00002030-200111090-00004. [DOI] [PubMed] [Google Scholar]
- 5.Ledergerber B, Furrer H, Rickenbach M, et al. Factors associated with the incidence of type 2 diabetes mellitus in HIV-infected participants in the Swiss HIV cohort study. Clin Infect Dis. 2007;45:111–119. doi: 10.1086/518619. [DOI] [PubMed] [Google Scholar]
- 6.Rotger M, Gsponer T, Martinez R, et al. Impact of single nucleotide polymorphisms and of clinical risk factors on new-onset diabetes mellitus in HIV-infected individuals. Clin Infect Dis. 2010;51:1090–1098. doi: 10.1086/656630. [DOI] [PubMed] [Google Scholar]
- 7.Brown TT, Li X, Cole SR, Kingsley LA, et al. Cumulative exposure to nucleoside analogue reverse transcriptase inhibitors is associated with insulin resistance markers in the multicenter AIDS cohort study. AIDS. 2005;19:1375–1383. doi: 10.1097/01.aids.0000181011.62385.91. [DOI] [PubMed] [Google Scholar]
- 8.Idiculla J, Ravindra’n GD, D’Souza J, et al. Diabetes mellitus, insulin resistance, and metabolic syndrome in HIV-positive patients in South India. Int J Gen Med. 2011;4:73–78. doi: 10.2147/IJGM.S15818. [DOI] [PMC free article] [PubMed] [Google Scholar]
- 9.Gundurao Sreekantamurthy G, Singh NB, Singh Th Bhimo, et al. Study of body composition and metabolic parameters in HIV-1male patients. J Nutr Metab. 2014;498497:5. doi: 10.1155/2014/498497. [DOI] [PMC free article] [PubMed] [Google Scholar]
- 10.Krishnan S, Schouten JT, Atkinson B, et al. Metabolic syndrome before and after initiation of antiretroviral therapy in treatment-naïve HIV-infected individuals. J Acquir Immune Defic Syndr. 2012;61:381–389. doi: 10.1097/QAI.0b013e3182690e3c. [DOI] [PMC free article] [PubMed] [Google Scholar]
- 11.Jantarapakde J, Phanuphak N, Chaturawit C, et al. Prevalence of metabolic syndrome among antiretroviral-naive and antiretroviral-experienced HIV-1 infected Thai adults. AIDS Patient Care STDS. 2014;28:331–340. doi: 10.1089/apc.2013.0294. [DOI] [PubMed] [Google Scholar]
- 12.Tesfaye DY, Kinde S, Medhin G, Megerssa YC, et al. Burden of metabolic syndrome among HIV-infected patients in Southern Ethiopia. Diabetes Metab Syndr. 2014;8:102–107. doi: 10.1016/j.dsx.2014.04.008. [DOI] [PubMed] [Google Scholar]
- 13.Kagaruki GB, Mayige MT, Ngadaya ES, et al. Magnitude and risk factors of non-communicable diseases among people living with HIV in Tanzania: a cross sectional study from Mbeya and Dar es Salaam regions. BMC Public Health. 2014;14:904. doi: 10.1186/1471-2458-14-904. [DOI] [PMC free article] [PubMed] [Google Scholar]
- 14.Dalle-Donne I, Rossi R, Colombo R, et al. Biomarkers of oxidative damage in human disease. Clin Chem. 2006;52:601–623. doi: 10.1373/clinchem.2005.061408. [DOI] [PubMed] [Google Scholar]
- 15.Kryston TB, Georgiev AB, Pissis P, et al. Role of oxidative stress and DNA damage in human carcinogenesis. Mutat Res. 2011;711:193–201. doi: 10.1016/j.mrfmmm.2010.12.016. [DOI] [PubMed] [Google Scholar]
- 16.Valavanidis A, Vlachogianni T, Fiotakis C, et al. 8-hydroxy-2′ -deoxyguanosine (8-OHdG): a critical biomarker of oxidative stress and carcinogenesis. J Environ Sci Health C Environ Carcinog Ecotoxicol Rev. 2009;27(2):120–139. doi: 10.1080/10590500902885684. [DOI] [PubMed] [Google Scholar]
- 17.Katsuki A, Sumida Y, Gabazza EC, et al. Homeostasis model assessment is a reliable indicator of insulin resistance during follow-up of patients with type 2 diabetes. Diabetes Care. 2001;24:362–365. doi: 10.2337/diacare.24.2.362. [DOI] [PubMed] [Google Scholar]
- 18.Arama V, Tiliscan C, Streinu-Cercel A, et al. Insulin resistance and adipokines serum levels in a caucasian cohort of HIV-positive patients undergoing antiretroviral therapy: a cross sectional study. BMC Endocr Disord. 2013;13:4–6. doi: 10.1186/1472-6823-13-4. [DOI] [PMC free article] [PubMed] [Google Scholar]
- 19.Serraino D, Bruzzone S, Zucchetto A, et al. Elevated risks of death for diabetes mellitus and cardiovascular diseases in Italian AIDS cases. AIDS Res Therapy. 2010;7:11. doi: 10.1186/1742-6405-7-11. [DOI] [PMC free article] [PubMed] [Google Scholar]
- 20.Capeau J, Bouteloup V, et al. Ten-year diabetes incidence in 1046 HIV-infected patients started on a combination antiretroviral treatment. AIDS. 2012;26:303–314. doi: 10.1097/QAD.0b013e32834e8776. [DOI] [PubMed] [Google Scholar]
- 21.Tangvarasittichai S. Oxidative stress, insulin resistance, dyslipidemia and type 2 diabetes mellitus. World J Diabetes. 2015;6:456–480. doi: 10.4239/wjd.v6.i3.456. [DOI] [PMC free article] [PubMed] [Google Scholar]
- 22.Kitazawa T, Yoshino Y, Suzuki S, et al. Lopinavir inhibits insulin signaling by promoting protein tyrosine phosphatase 1b expression. Exp Ther Med. 2014;8:851–855. doi: 10.3892/etm.2014.1826. [DOI] [PMC free article] [PubMed] [Google Scholar]
- 23.Butt AA, McGinnis K, et al. HIV infection and the risk of diabetes mellitus. AIDS. 2009;23:1227–1234. doi: 10.1097/QAD.0b013e32832bd7af. [DOI] [PMC free article] [PubMed] [Google Scholar]
- 24.Ndona MM, Longo-Mbenza B, et al. Nadir CD4+, religion, antiretroviral therapy, incidence of type 2 diabetes mellitus, and increasing rates of obesity among black Africans with HIV disease. Int J Gen Med. 2012;5:983–990. doi: 10.2147/IJGM.S32167. [DOI] [PMC free article] [PubMed] [Google Scholar]
- 25.Tripathi A, Liese AD, Jerrell JM, et al. Incidence of diabetes mellitus in a population-based cohort of HIV-infected and non-HIV-infected persons: the impact of clinical and therapeutic factors over time. Diabet Med. 2014;31:1185–1193. doi: 10.1111/dme.12455. [DOI] [PubMed] [Google Scholar]
- 26.Arama V, Tiliscan C, Streinu-Cercel A, et al. Insulin resistance and adipokines serum levels in a Caucasian cohort of HIV-positive patients undergoing antiretroviral therapy: a cross sectional study. BMC Endocr Disord. 2013;13:4. doi: 10.1186/1472-6823-13-4. [DOI] [PMC free article] [PubMed] [Google Scholar]
- 27.Mondy KE, de Las Fuentes L, Waggoner A, et al. Insulin resistance predicts endothelial dysfunction and cardiovascular risk in HIV-infected persons on long-term highly active antiretroviral therapy. AIDS. 2008;22:849–856. doi: 10.1097/QAD.0b013e3282f70694. [DOI] [PMC free article] [PubMed] [Google Scholar]
- 28.Ben-Romano R, Rudich A, et al. Agent and cell-type specificity in the induction of insulin resistance by HIV protease inhibitors. AIDS. 2003;17:23–32. doi: 10.1097/00002030-200301030-00005. [DOI] [PubMed] [Google Scholar]


