Abstract
Parametric maps showing perfusion of contrast media can be useful tools for characterizing lesions in breast tissue. In this study we show the feasibility of parametric subharmonic imaging (SHI), which allows imaging of a vascular marker (the ultrasound contrast agent) while providing near complete tissue suppression. Digital SHI clips of 16 breast lesions from 14 women were acquired. Patients were scanned using a modified LOGIQ 9 scanner (GE Healthcare, Waukesha, WI) transmitting/receiving at 4.4/2.2 MHz. Using motion-compensated cumulative maximum intensity (CMI) sequences, parametric maps were generated for each lesion showing the time to peak (TTP), estimated perfusion (EP), and area under the time-intensity curve (AUC). Findings were grouped and compared according to biopsy results as benign lesions (n = 12, including 5 fibroadenomas and 3 cysts) and carcinomas (n = 4). For each lesion CMI, TTP, EP, and AUC parametric images were generated. No significant variations were detected with CMI (P = .80), TTP (P = .35), or AUC (P = .65). A statistically significant variation was detected for the average pixel EP (P = .002). Especially, differences were seen between carcinoma and benign lesions (mean ± SD, 0.10 ± 0.03 versus 0.05 ± 0.02 intensity units [IU]/s; P = .0014) and between carcinoma and fibroadenoma (0.10 ± 0.03 versus 0.04 ± 0.01 IU/s; P = .0044), whereas differences between carcinomas and cysts were found to be nonsignificant. In conclusion, a parametric imaging method for characterization of breast lesions using the high contrast to tissue signal provided by SHI has been developed. While the preliminary sample size was limited, results show potential for breast lesion characterization based on perfusion flow parameters.
Keywords: breast cancer, parametric imaging, subharmonic imaging, ultrasound contrast agent
Breast cancer is the most common form of cancer in women and the second most common cause of cancer death (27% and 15% of all cases within the United States, respectively).1 Early detection of breast cancer has been shown to be paramount to patient survival.1,2 Mammography is currently the primary imaging modality for breast screening, despite 65% to 90% of biopsied lesions being benign.3,4 Angiogenic vasculature within lesions provides a potential indicator of malignancy due to the more aberrant and tortuous flow conditions associated with malignant neovessels.5,6 Breast lesion characterization may therefore be achieved using flow parameters obtained by tracking contrast media perfusion. Thus, contrast-enhanced ultrasound (US) may be an important adjunct to mammography due to its ability to image perfusion.
Perfusion imaging has been used as a means for differentiating normal from abnormal flow conditions using ultrasound contrast agents (UCAs), consisting of micronsized, shell-stabilized gas bubbles, which are generally restricted to the vasculature.7 Perfusion data acquired over a specific time sequence (generally from UCA injection to wash-out) can be used to generate a parametric image showing localized variations in flow parameters within the image plane. Several studies have constructed parametric perfusion maps using harmonic imaging (HI) in the brain.8–10 Wiesmann et al8 created parametric images of perfusion using HI with Levovist (Schering AG, Berlin, Germany) in the brain of ischemic stroke patients, identifying the area of infarct by areas of hypoperfusion. Harrer et al10 compared healthy brain tissue to tumor tissue in 25 patients using perfusion HI with SonoVue (Bracco SpA, Milan, Italy). After generating time-intensity curves, the group found significant differences in the peak intensity, slope of infusion (ie, estimated perfusion), and area under the curve (P < .001) between healthy brain and tumors.10 Also aimed at tumor differentiation and monitoring, Pollard et al11 used a B-mode flash replenishment sequence to create parametric images of subcutaneously implanted R3230 murine mammary adenocarcinomas to measure the efficacy of an antiangiogenic chemotherapeutic. They found decreased time-integrated enhancement (area under the curve) and increased replenishment times over the course of therapy in tumors compared to untreated controls, indicating both factors may be suitable in monitoring the tumor response to treatment.11 Additionally, parametric images of time-integrated enhancement generated from B-mode US clips showed higher overall levels in image areas with viable tumor (confirmed by histology).11
While these studies are promising, their sensitivities suffer from a reduced blood-to-tissue signal due to the tissue’s ability to express signal at the transmit (f0) and higher harmonic frequencies.7 Parametric imaging using subharmonic imaging (SHI) may provide a more suitable alternative than HI, Doppler, or other imaging methods. In both B-mode and Doppler imaging, UCAs behave similar to tissue scatterers, providing little opportunity for tissue suppression and exclusive imaging of the vasculature.7,12 Nonlinear imaging techniques such as HI use the ability of UCAs to more efficiently scatter energy at higher harmonics by receiving at twice the transmit frequency for tissue signal suppression.7,12 However, tissue has also been shown to produce harmonics, making complete tissue suppression difficult to achieve.13 The ability to generate subharmonics when insonated at sufficiently high pressures (>0.3 MPa) is exclusive to UCAs.7,14,15 Thus, by receiving at the subharmonic frequency (f0/2), tissue signals are completely suppressed, leaving only the signal from the UCA restricted within the vasculature.14–17 In a preliminary study, our group demonstrated the feasibility of imaging breast lesions in 16 patients using subharmonic signals from UCAs and compared scans to both contrast-enhanced gray scale and power Doppler US scans as well as mammography.16 We have also shown that perfusion imaging using SHI provides a reliable estimate of in vivo perfusion, with SHI perfusion estimates in canine kidneys correlating well with radiolabeled microsphere results (r = 0.57; P < .001).17
Using motion compensation and the complete tissue suppression provided by SHI, parametric images can be generated on a pixel-by-pixel basis, providing localized flow parameters. These parameters potentially can then be used in characterizing suspected lesions for cancer diagnosis. The goal of this study is to demonstrate the feasibility of creating parametric images of subharmonic signals from UCAs and show their potential role in lesion differentiation. The feasibility of image creation will be judged by the ability to view variations in flow conditions within a single tissue plane, while the ability to differentiate between lesions will be judged by the ability of the method to separate benign from malignant lesions using quantitative parameters.
Materials and Methods
Ultrasound Imaging
Digital SHI clips were obtained of 16 breast lesions from 14 women using a modified LOGIQ 9 US scanner (GE Healthcare, Waukesha, WI) as part of a previous Health Insurance Portability and Accountability Act–compliant study on breast SHI.16 Patients provided written informed consent, and the study was approved by Thomas Jefferson University’s Institutional Review Board. While the project was sponsored in part by GE Healthcare, the authors of this article (with the exception of A.L.H. as a GE employee) had sole control of the data generated. Breast lesions were diagnosed by mammography and their locations noted. Baseline gray scale US examinations were performed to confirm the lesion location during scanning, followed by baseline power Doppler imaging. Contrast-enhanced power Doppler imaging was then performed in each patient, with the first 7 patients receiving 0.5 mL of Optison (GE Healthcare, Princeton, NJ) and the following 7 patients receiving 0.25 mL of Definity (Lantheus Medical Imaging, North Billerica, MA) as bolus injections. After 15 minutes, patients were scanned with gray scale SHI (4.4 MHz transmission, 2.2 MHz receiving) and received an additional bolus injection of the UCAs (7 with 4.0 mL of Optison and 7 with 1.4 mL of Definity).16 Digital clips of baseline and post–contrast injection imaging were acquired and transferred to a personal computer for later processing. Sequences of static cumulative maximum intensity (CMI) were generated using an automatic motion compensation algorithm as previously described.18 Briefly, this algorithm uses a sum-absolute-difference template-matching technique to identify shifting of a predetermined kernel (area of subharmonic signal from the UCA).18 A reliability parameter is defined as the ratio of the minimum to mean sum-absolute-difference for estimating the accuracy of the motion compensation.18 A threshold level of 85% of the mean reliability parameter is then used to discard frames with excessive noise or motion.18 Digital clips were then used to generate parametric images and perfusion parameters. The breast lesions studied ranged in depth from 0.5 to 3.5 cm and included 4 carcinomas and 12 benign lesions (5 fibroadenomas, 3 cysts, 2 calcifications, 1 lymph node, and 1 area of subdermal scar tissue) as established by pathology.
Parametric Map Generation
All image processing was performed in MATLAB R2009a (The MathWorks, Natick, MA). Original images were imported and converted from red-green-blue to gray scale. Converted intensity values (intensity units [IU]) were set on a 0 to 1 scale with 0 representing no subharmonic signal and 1 representing full saturation. This scale was linearly proportional to the subharmonic signal. Initial filtering trials were performed on CMI images in varying intervals of 10% of the average intensity. These iterations showed 40% filtering provided optimal segmentation of contrast-enhanced areas. As a result, image sequences were filtered on the basis of CMI by removing pixels less than 40% of the average intensity to reduce noise in regions without contrast. Parametric images were then generated showing the time to peak (TTP), estimated perfusion (EP), and area under the time-intensity curve (AUC; equivalent to time-integrated intensity in similar studies) for each pixel throughout the time sequence.
The parameter TTP was defined as the time from contrast agent injection to the point at which maximum intensity was reached for each individual pixel. While our previous study used a definition12 of EP as the slope of the rise in the time-intensity curve from 10% to 30% of the maximum, this is not an accurate representation of perfusion on the pixel level (due to noise fluctuations). A modified definition of EP was defined as the slope of the time-intensity curve from contrast arrival in the plane (necessary for motion compensation) to the peak intensity. It is also possible for the pixel to be in an artery or vein, in which case it is not actually tissue perfusion. For this reason, we refer to the EP, which has been correlated reasonably well with actual perfusion.17 Complete contrast wash-out was not recorded for all patients while originally collecting breast SHI clips as a proof-of-concept study.16 Thus, as a means for standardization among patients, a modified AUC definition was used as the area under the time-intensity curve from contrast arrival to peak intensity (a time sequence available for the entire data set).
Regions of interest (ROI) corresponding to lesion locations seen in B-mode and Doppler scans were selected and evaluated in terms of average perfusion parameters. Average values of CMI, TTP, EP, and AUC were determined for each lesion, grouped according to pathology results, and compared. Lesion locations were determined from the contrast-enhanced power Doppler videos obtained before SHI. In 2 cases, multiple ROIs were selected to determine values of multiple lesions within the same plane or to compare multiple vascular regions associated with a single lesion. Parameter values for each lesion were defined as the average of all nonfiltered pixels within the predefined ROI. Final images were converted to a color scale in MATLAB, setting the minimum of the scale to 0 (the filtered value) and the maximum to a level above the peak pixel value.
Statistical Analysis
Results from all 16 lesions were grouped according to pathology (12 benign and 4 malignant carcinoma) and lesion type and (4 malignant carcinomas, 5 fibroadenomas, and 3 cysts). A one-way analysis of variance (ANOVA) with α = .05 was performed (with lesion type being investigated as the independent variable) to determine significant variations among groups, and a Student t test was used to test significance between individual groups using Prism version 5.0 (GraphPad Software, San Diego, CA).
Results
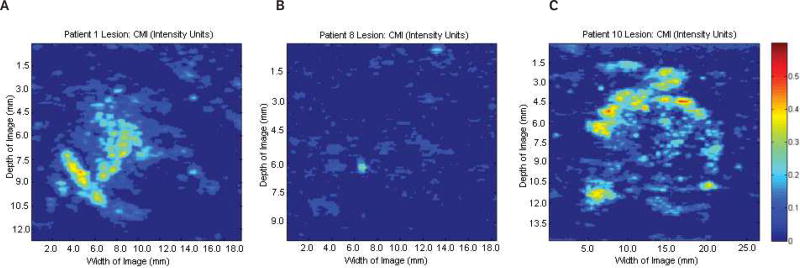
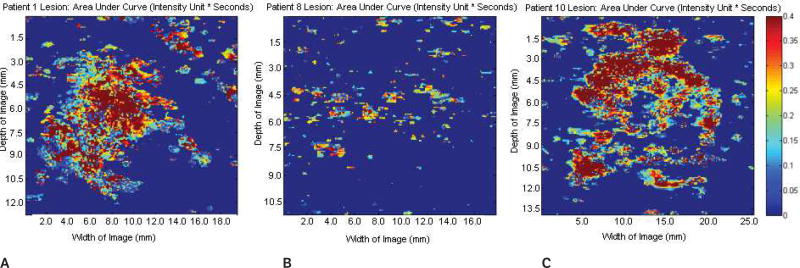
Sample baseline images (before contrast agent injection) at the fundamental frequency are shown in Figure 1. Figure 1A shows a Doppler US image of a benign fibroadenoma; Figure 1B shows a gray scale US image of a subdermal scar; and Figure 1C shows a gray scale US image of an invasive malignant papillary carcinoma (left) and a cyst (right). Parametric images of CMI, TTP, EP, and AUC were created for each lesion (n = 16). Parametric subharmonic images at the ROIs from a benign fibroadenoma, a subdermal scar, and an invasive malignant papillary carcinoma (all shown in the regular gray scale or power Doppler mode in Figure 1) are each shown in Figures 2–5, respectively. Average values of nonfiltered pixels in each lesion were calculated and compared among all groups using a one-way ANOVA. These results are summarized in Table 1.
Figure 1.
Doppler and gray scale images at the fundamental of 4 lesions (circled) in 3 patients. A, Doppler image of a benign fibroadenoma. B, Gray scale image of a subdermal scar. C, Gray scale image of an invasive malignant papillary carcinoma (left) and a cyst (right).
Figure 2.
Parametric images at the regions of interest showing cumulative maximum intensity (CMI) of the same 3 lesions shown in Figure 1. A, Benign fibroadenoma. B, Subdermal scar. C, Invasive malignant papillary carcinoma. No significant variations in cumulative maximum intensity were detected among the groups (P = .80). Scale bar indicates 0 to 0.6 intensity units.
Figure 5.
Parametric images at the regions of interest showing the area under the time-intensity curve of the same 3 lesions shown in Figures 1–4. A, Benign fibroadenoma. B, Subdermal scar. C, Invasive malignant papillary carcinoma. No significant variations in the area under the curve were detected among the groups (P = .65). Scale bar indicates 0 to 0.4 intensity units/s.
Table 1.
Average Pixel Data by Lesion Type
| Parameter | Benign (n = 12) | Cyst (n = 3) | Fibroadenoma (n = 5) | Carcinoma (n = 4) | P (ANOVA) |
|---|---|---|---|---|---|
| CMI, IU | 0.14 ± 0.058 | 0.17 ± 0.04 | 0.14 ± 0.07 | 0.17 ± 0.06 | .80 |
| TTP, s | 35.84 ± 13.49 | 27.77 ± 1.68 | 40.25 ± 8.52 | 29.17 ± 4.40 | .35 |
| EP, IU/s | 0.05 ± 0.02 | 0.07 ± 0.03 | 0.04 ± 0.01 | 0.10 ± 0.03 | .002 |
| AUC, IU/s | 0.25 ± 0.16 | 0.30 ± 0.20 | 0.23 ± 0.18 | 0.26 ± 0.19 | .65 |
Values are mean ± SD. ANOVA indicates analysis of variance; AUC, area under the time-intensity curve; CMI, cumulative maximum intensity; EP, estimated perfusion; IU, intensity units; and TTP, time to peak.
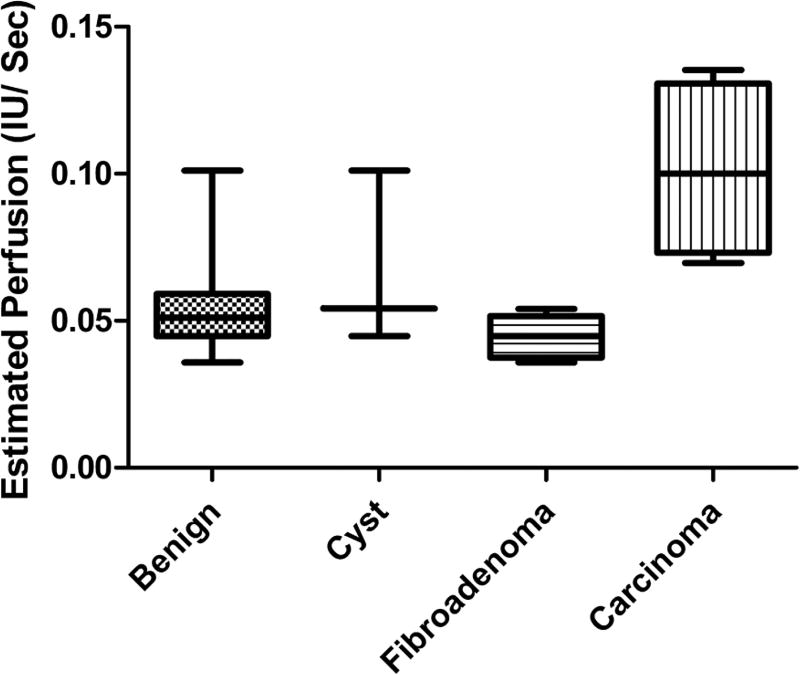
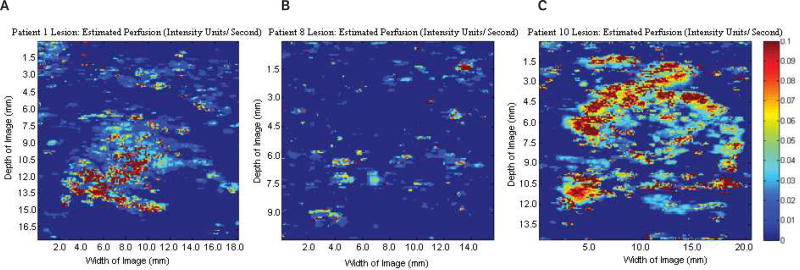
No significant variations among lesions were detected for either CMI or AUC (P > .6), indicating that these parameters may not be suitable for differentiation on their own. While average TTP levels were found to be lower in carcinomas relative to benign lesions or the fibroadenoma subgroup, this variation was nonsignificant (mean ± SD, 29.17 ± 4.40 versus 35.84 ± 13.49 s; P= .36 for carcinomas versus benign lesions). A statistically significant difference among EP values was detected (P = .002), indicating that the rate of perfusion estimated by SHI may be a sensitive enough measure to allow lesion characterization. These variations are further depicted in Figure 6.
Figure 6.
Box plot of estimated perfusion data for each lesion classification. Statistically significant variations were observed between carcinoma and both fibroadenomas and all benign lesions (P < .005). IU indicates intensity units.
Carcinomas were found to have significantly higher rates of perfusion relative to benign lesions (0.10 ± 0.03 versus 0.05 ± 0.02 IU/s; P = .001). While significant variations were detected between carcinoma and fibroadenoma groups (0.10 ± 0.03 versus 0.04 ± 0.01 IU/s; P = .004), differences between carcinomas and cysts were found to be nonsignificant (0.10 ± 0.03 versus 0.07 ± 0.03 IU/s; P= .19). This lack of significance is attributed to both the small sample size (n = 3) and large deviations (45% SD relative to the mean) within the cyst group. Additionally, no significant differences were detected between cysts and fibroadenomas (P = .15).
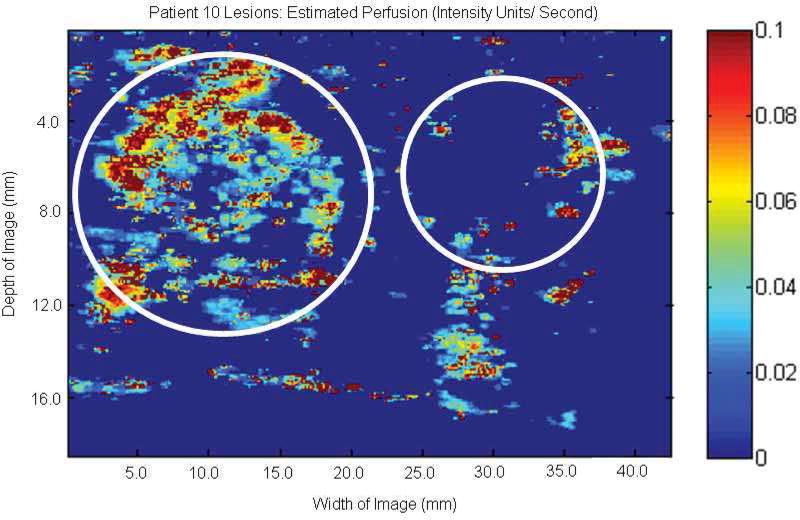
The potential ability to characterize lesions using EP parametric imaging at the subharmonic is well demonstrated in Figure 7, showing 2 lesions within a single patient. The left lesion shows substantial perfusion in a papillary carcinoma (due to the higher degree of vascularity), while the lesion on the right shows minimal perfusion in a benign cyst.
Figure 7.
Parametric image at the subharmonic showing estimated perfusion of 2 lesions (circles) in 1 patient. The lesion on the left shows higher average estimated perfusion in an invasive papillary carcinoma, while the lesion on the right shows very limited estimated perfusion within a cyst.
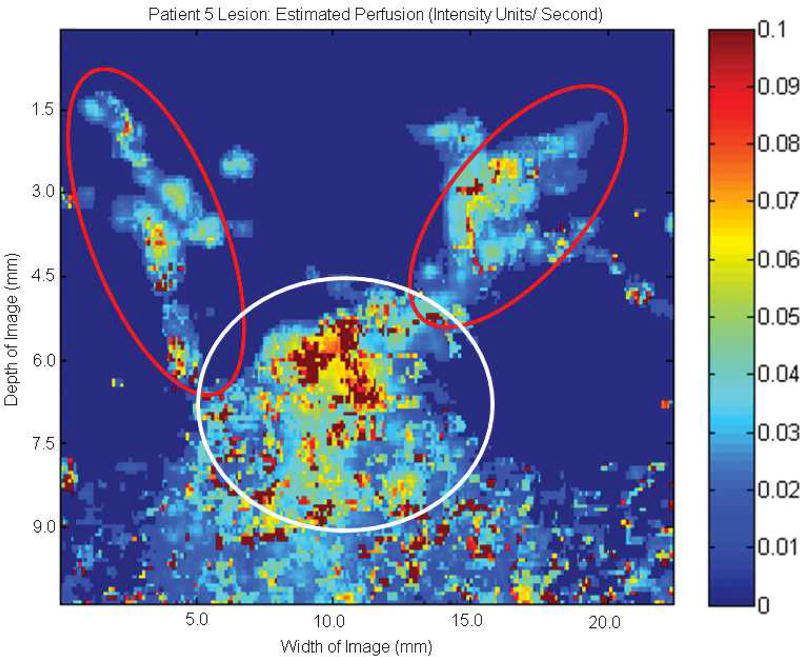
Additionally, parametric SHI of EP might be useful in differentiating multiple vascular networks within a single lesion image. An example of this is demonstrated in Figure 8, showing an area of benign microcalcification in the presence of both smaller vasculature (red circles) with lower overall EP, and a larger primary vessel (white circle) with higher EP.
Figure 8.
Parametric image at the subharmonic showing estimated perfusion of a benign ductal microcalcification. Smaller areas of vascular supply with lower overall perfusion rates (red circles) can be differentiated from the main vessel (white circle), which displays higher overall perfusion levels.
Discussion
Subharmonic parametric imaging of flow is potentially beneficial because of the near complete tissue suppression and lower attenuation of the received signal (approximately proportional to frequency), which potentially allows for deeper scan depths. However, this lowered receiving frequency also results in decreased resolution due to the increased US wavelength, although this compromise is believed to be well worth the ability to image only contrast media within the vasculature. While it is important to note that the sample size used in this study was rather limited (n = 16 lesions), the preliminary results are promising.
Results demonstrate the feasibility of using parametric images of CMI, TTP, EP, and AUC from SHI to display vascularized breast lesions as shown by the variation in flow conditions between vascular lesions and the surrounding tissue. As expected, lesions with a definitive vasculature (fibroadenoma shown in A, and carcinoma shown in C in Figures 2–5) were able to be imaged using SHI, while lesions with limited vasculature (the subdermal scar shown in B in Figures 2–5) showed little enhancement due to the lack of the UCA. This results in limited extraction of viable parametric images. While no significant variations were detected among CMI, TTP, and AUC, EP showed promise as a possible tool for lesion characterization (P = .002; Table 1) with higher overall levels in carcinomas relative to both cysts and fibroadenomas as well as the entire group of benign lesions (Figure 6). While this imaging technique is not expected to be used as a sole modality for diagnosis, it may provide additional valuable information in conjunction with other US and mammographic modes.
Additionally, the ability to create parametric images based on rates of perfusion may allow for vasculature differentiation within a single image. In Figure 7, lower overall levels of perfusion are seen in the 2 smaller vessels (presumably feeding vessels) compared to the primary, more vascular region. The ability to identify reperfusion rates in individual vessels is expected to be useful for blood velocity estimation. For example, Hudson et al19 used a disruption replenishment model with incorporated vascular structure to successfully measure fluid velocity using contrast in an in vitro flow setup. A similar approach may be used in parametric SHI to quantify blood flow in lesions for either differentiation or as tool for monitoring the response to treatment.
Several limitations to this study exist. Modified definitions of both EP and AUC were used to better suit the data format. Estimated perfusion is generally taken as the initial slope of wash-in (from 10% to 30% above baseline) where it is greatest on the time-intensity curve.17 However, when generating parametric images on a pixel-by-pixel basis, this becomes difficult due to the denticulate nature of the data. Thus, a modified definition of EP was used, taking the slope from the beginning of contrast wash-in to peak intensity, providing more of an average value. While most studies using time-intensity curves consider the AUC to be from the area under the time-intensity curve from contrast wash-in to wash-out, this was also modified by integrating from wash-in to peak intensity. Because data sets were initially acquired as a proof-of-concept study for SHI imaging in breast lesions,16 complete contrast wash-out was not obtained for all patients. Additionally, the motion compensation algorithm used relies on areas of enhancement (provided only by UCAs in SHI imaging) and thus cannot be used to align frames close to or past complete UCA wash-out.18 However, exclusion of wash-out may not be entirely detrimental, as shown by Schwarz et al,20 who compared contrast enhancement after bolus injection in phase 1 (quick rise in time-intensity provided by the initial pass of a UCA) with phase 2 (longer, almost steady period of enhancement provided by subsequent UCA passes) in various vascular regions in dogs and found that only the first few seconds (phase 1) were flow dependent.
The imaging of a single plane over a period of time, especially when the transducer is held in place by hand such as in this case, inherently involves some degree of error when comparing frames. While a tracking algorithm was used to reduce this motion, these corrections are only applied within the 2-dimensional plane. Changes to the location of the plane would most likely result in a reliability parameter lower than the 85% threshold and thus removal of the frame as described in the “Materials and Methods” section. This removal of frames may also lead to lost temporal information during contrast perfusion. While this loss of frames does create an additional uncertainty at that specific time point (due to lack of data), imaging of perfusion over the remaining sequence still provides an adequate representation of flow behavior. It is also important to point out that the use of EP in this study is actually perfusion of contrast media in the selected plane or ultrasonically apparent perfusion, not the entire lesion. Actual perfusion levels may be able to be calculated through parametric SHI at multiple planes encompassing the entire set of veins/ arteries. Ideally, this method could potentially be applied to 3-dimensional SHI, providing flow characteristics throughout the vascular architecture instead of a limited image plane.
Additionally, the use of multiple comparisons in this study creates statistical uncertainty by potentially producing a statistically significant result when comparing a large enough number of parameters. The use of a Bonferroni correction has been advocated in which significance levels are divided by the total number of comparisons (8 in this particular study).21 However, it has also been argued that the use of this correction is more likely to result in β error in which true differences are found to be nonsignificant.22 In this study, we chose not to use a Bonferroni correction. Although a correction factor of 8 would not change the findings of any of the 3 comparisons found to be significant, it is important to note that the original data set has been used in other studies17,18,23; thus, the correction factor could arguably be much higher.
This study serves primarily as a motivator for future study of parametric SHI for lesion characterization, and the preliminary results are promising. The data acquisition issues can be overcome in follow-up studies, which would have to include a larger patient population and be dedicated to investigating parametric SHI. In conclusion, parametric images of breast lesions have been constructed using SHI. Due to a UCA’s exclusive ability to emit at the subharmonic (f0/2), SHI provides complete tissue suppression and, thus, a potentially improved way to monitor contrast media perfusion. While the sample size of this preliminary study is a limitation, results indicate that flow parameters from parametric SHI may be useful in characterizing breast lesions.
Figure 3.
Parametric images at the regions of interest showing the time to peak of the same 3 lesions shown in Figures 1 and 2. A, Benign fibroadenoma. B, Subdermal scar. C, Invasive malignant papillary carcinoma. No significant variations in the time to peak were detected among the groups (P = .35). Scale bar indicates 0 to 60 s.
Figure 4.
Parametric images at the regions of interest showing estimated perfusion of the same 3 lesions shown in Figures 1–3. A, Benign fibroadenoma. B, Subdermal scar. C, Invasive malignant papillary carcinoma. Significant variations in estimated perfusion were detected among the groups (P = .002). Scale bar indicates 0 to 0.1 intensity units/s.
Acknowledgments
We thank Colleen Dascenzo, CRA, for support in recruiting women for this study and Donna George, RN, for nursing support. This work was supported in part by the US Army Medical Research Material Command under DAMD-17-00-1-0464, by National Institutes of Health grant CA140338, and by GE Healthcare.
Abbreviations
- ANOVA
analysis of variance
- AUC
area under the time-intensity curve
- CMI
cumulative maximum intensity
- EP
estimated perfusion
- HI
harmonic imaging
- IU
intensity units
- ROI
region of interest
- SHI
subharmonic imaging
- TTP
time to peak
- UCA
ultrasound contrast agent
- US
ultrasound
References
- 1.American Cancer Society. Breast Cancer Facts and Figures 2009–2010. Atlanta, GA: American Cancer Society; 2009. [Google Scholar]
- 2.Smith RA, Cokkinides V, Eyre HJ. American Cancer Society guidelines for the early detection of cancer, 2006. CA Cancer J Clin. 2006;56:11–25. doi: 10.3322/canjclin.56.1.11. [DOI] [PubMed] [Google Scholar]
- 3.Kopans DB, et al. Breast Imaging. 2. Philadelphia, PA: Lippincott Williams & Wilkins; 1998. [Google Scholar]
- 4.Zonderland HM, Coerkamp EG, Hermans J, van de Vijver MJ, van Voorthuisen AE. Diagnosis of breast cancer: contribution of US as an adjunct to mammography. Radiology. 1999;213:413–422. doi: 10.1148/radiology.213.2.r99nv05413. [DOI] [PubMed] [Google Scholar]
- 5.Weidner N, Folkman J, Pozza F, et al. Tumor angiogenesis: a new significant and independent prognostic indicator in early-stage breast carcinoma. J Natl Cancer Inst. 1992;84:1875–1887. doi: 10.1093/jnci/84.24.1875. [DOI] [PubMed] [Google Scholar]
- 6.Gasparini G, Harris AL. Clinical importance of the determination of tumor angiogenesis in breast carcinoma: much more than a new prognostic tool. J Clin Oncol. 1995;13:765–782. doi: 10.1200/JCO.1995.13.3.765. [DOI] [PubMed] [Google Scholar]
- 7.Goldberg BB, Raichlen JS, Forsberg F. Ultrasound Contrast Agents: Basic Principles and Clinical Applications. 2. London, England: Martin Dunitz Ltd; 2001. [Google Scholar]
- 8.Wiesmann M, Meyer K, Albers T, Seidel G. Parametric perfusion imaging with contrast-enhanced ultrasound in acute ischemic stroke. Stroke. 2004;35:508–513. doi: 10.1161/01.STR.0000114877.58809.3D. [DOI] [PubMed] [Google Scholar]
- 9.Siedel G, Cangür H, Meyer-Weithe K, et al. On the ability of ultrasound parametric perfusion imaging to predict the area of infarction in acute ischemic stroke. Ultraschall Med. 2006;27:543–548. doi: 10.1055/s-2006-927023. [DOI] [PubMed] [Google Scholar]
- 10.Harrer JU, Hornen S, Oertel MF, Stracke CP, Klötzsch C. Comparison of perfusion harmonic imaging and perfusion MR imaging for the assessment of microvascular characteristics in brain tumors. Ultraschall Med. 2008;29:45–52. doi: 10.1055/s-2007-963413. [DOI] [PubMed] [Google Scholar]
- 11.Pollard RE, Sadlowski AR, Bloch SH, et al. Contrast-assisted destruction-replenishment ultrasound for the assessment of tumor microvasculature in a rat model. Technol Cancer Res Treat. 2002;1:459–470. doi: 10.1177/153303460200100606. [DOI] [PubMed] [Google Scholar]
- 12.Correas J, Bridal L, Lesavre A, Mejean A, Claudon M, Helenon O. Ultrasound contrast agents: properties, principles of action, tolerance and artifacts. Eur Radiol. 2001;11:1316–1328. doi: 10.1007/s003300100940. [DOI] [PubMed] [Google Scholar]
- 13.Frinking PJ, Bouakaz A, Kirkhorn J, Cate FJ, de Jong N. Ultrasound contrast imaging: current and new potential methods. Ultrasound Med Biol. 2000;26:965–975. doi: 10.1016/s0301-5629(00)00229-5. [DOI] [PubMed] [Google Scholar]
- 14.Shi WT, Forsberg F, Hall AL, et al. Subharmonic imaging with microbubble contrast agents: initial results. Ultrason Imaging. 1999;21:79–94. doi: 10.1177/016173469902100201. [DOI] [PubMed] [Google Scholar]
- 15.Forsberg F, Shi WT, Goldberg BB. Subharmonic imaging of contrast agents. Ultrasonics. 2000;38:93–98. doi: 10.1016/s0041-624x(99)00148-1. [DOI] [PubMed] [Google Scholar]
- 16.Forsberg F, Piccoli C, Merton D, Palazzo J, Hall A. Breast lesions: imaging with contrast-enhanced subharmonic US—initial experience. Radiology. 2007;244:718–726. doi: 10.1148/radiol.2443061588. [DOI] [PubMed] [Google Scholar]
- 17.Forsberg F, Liu JB, Shi WT, et al. In vivo perfusion estimation using subharmonic contrast microbubble signals. J Ultrasound Med. 2006;25:15–21. doi: 10.7863/jum.2006.25.1.15. [DOI] [PubMed] [Google Scholar]
- 18.Dave JK, Forsberg F. Novel automated motion compensation technique for producing cumulative maximum intensity subharmonic images. Ultrasound Med Biol. 2009;35:1555–1563. doi: 10.1016/j.ultrasmedbio.2009.04.016. [DOI] [PubMed] [Google Scholar]
- 19.Hudson JM, Karshafian R, Burns PN. Quantification of flow using ultrasound and microbubbles: a disruption replenishment model based on physical principles. Ultrasound Med Biol. 2009;35:2007–2020. doi: 10.1016/j.ultrasmedbio.2009.06.1102. [DOI] [PubMed] [Google Scholar]
- 20.Schwarz KQ, Chen X, Bezante GP, Phillips D, Schlief R. The Doppler kinetics of microbubble echo contrast. Ultrasound Med Biol. 1996;22:453–462. doi: 10.1016/0301-5629(96)00021-x. [DOI] [PubMed] [Google Scholar]
- 21.Bland JM, Altman DG. Multiple significance tests: the Bonferroni method. BMJ. 1995;310:170. doi: 10.1136/bmj.310.6973.170. [DOI] [PMC free article] [PubMed] [Google Scholar]
- 22.Perneger TV. What’s wrong with Bonferroni adjustments. BMJ. 1998;316:1236–1238. doi: 10.1136/bmj.316.7139.1236. [DOI] [PMC free article] [PubMed] [Google Scholar]
- 23.Dave JK, Forsberg F, Fernandes S, et al. Static and dynamic cumulative maximum-intensity display mode for subharmonic imaging: a comparative study with mammography and conventional ultrasound techniques. J Ultrasound Med. 2010;29:1177–1185. doi: 10.7863/jum.2010.29.8.1177. [DOI] [PubMed] [Google Scholar]


