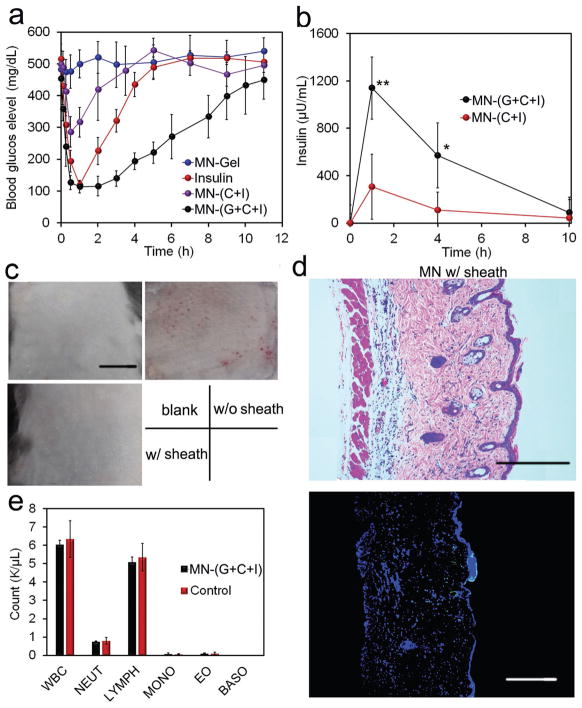
Figure 4.
In vivo evaluation of MN array patches for type 1 diabetes treatment. a) Blood glucose levels of type 1 diabetic mice treated with various kinds of microneedle array patches. b) Blood insulin level of mice treated with MN array patches. Data points represent mean ± SD (n = 3). *P < 0.05, **P < 0.01 (analyzed by two-tailed Student’s t-test) for MN-(G+C+I) compared with control MN-(C+I). c) Representative images of skins at the treated site of mice. Mice were treated with MN-Gel, MN-(G+I), and MN-(G+C+I) for 12 h, and the skins were gathered after the mice were euthanized. Scale bars, 1 cm. d) H&E staining and immunohistologic staining with TUNEL assay (green) and Hoechst (blue) of skins treated with MN-(G+C+I). Scale bars, 300 μm. e) Analysis of blood white cells of mice treated with MN-(G+C+I). Blood samples were obtained 2 d post-treatment. WBC: white blood cells; NEUT: neutrophils; LYMPH: lymphocytes; MONO: monocytes; EO: eosinophils; BASO: basophils.

