Abstract
Purpose
This study represents the most recent epidemiologic trends of head and neck cancer (HNC) in the United States. It provides an important discussion on oropharyngeal cancer and cancers related to the human papillomavirus. The objective was to identify trends in HNC (2002 to 2012) within the United States.
Materials and Methods
This study is a retrospective analysis of the US National Cancer Institute’s Surveillance, Epidemiology, and End Results (SEER) submission. Using the November 2014 submission of the SEER database and SEER-18 data files, data from 2002 to 2012 were analyzed to determine the most recent epidemiologic trends. HNCs of all subtypes were analyzed together. Laryngeal cancers were further analyzed separately. Oropharyngeal cancers of the base of tongue and tonsil were analyzed independently to attempt to trend HPV-related cancers.
Results
From 2002 to 2012, there were 149,301 cases of HNC recorded in the SEER database. The HNC rate decreased by 0.22% per year (P = .0549) and the rate of laryngeal cancer decreased by 1.9% per year (P < .0001). The rate of oropharyngeal (HPV-related) cancer increased by 2.5% per year (P < .0001). HNC rates increased significantly in Kentucky and Connecticut and decreased in California (P < .05). HPV-related cancers increased significantly in all states except Georgia, Hawaii, and Michigan (P < .05). Laryngeal cancer rates decreased in California, Georgia, New Jersey, and New Mexico (P < .05).
Conclusions
The overall incidence of HNC is decreasing in the United States. There is an increasing incidence of HPV-related cancers of the oropharynx. Meaningful differences in cancer incidence and rate of change exist between men and women. Furthermore, younger groups have a greater decrease of overall HNC, with an overall increase in HPV-related cancer in patients older than 50 years.
Head and neck cancer (HNC) involves epithelial malignancies of the upper aerodigestive tract, including the oral cavity, nasal cavity, paranasal sinuses, pharynx, and larynx. In the United States, HNC constitutes 3% of all malignancies, and there are approximately 60,000 new cases each year, with approximately 12,000 resulting deaths.1 Tobacco and alcohol consumption are the primary risk factors for HNC, with a multiplicative effect.2 Human papillomavirus (HPV) infection also is recognized as a risk factor, responsible for 40 to 80% of oropharyngeal cancer cases in the United States.3 Other implicated risk factors include betel quid chewing, diet, ultraviolet light exposure, herpes simplex virus, and Epstein-Barr virus.4
From 1974 to 1999 in the United States, there was no notable increase in the incidence of nasopharyngeal cancer and a considerable decrease in oral cavity, laryngeal, and hypopharyngeal cancers.5 This decrease was largely attributed to the decreasing incidence of smoking. However, from 1973 to 2004, there was an increase in the incidence of oropharyngeal squamous cell carcinoma concomitant with an increased incidence of HPV-associated oropharyngeal cancer from 1988 to 2004.6,7 The object of this study was to examine the overall trends in HNC incidence from 2002 to 2012 and to describe the trends in incidence according to geographic region, age, and gender.
Materials and Methods
This study is based on HNC cases collected from the most up-to-date November 2014 submission of the US Surveillance and Epidemiology and End Results (SEER) in addition to SEER-18 data files. This database is a population-based registry that collects data on cancer incidence and survival from approximately 28% of the US population, the most of any SEER database. It should be noted that the database excluded data from Louisiana during the periods of hurricanes Katrina and Rita from July to December 2005.8 Given the use of anonymized data, this study was exempt from approval by the institutional review board.
Cases selected included HNC as categorized by the ninth and tenth editions of the International Classification of Diseases. This included cancers of the oral cavity (C00-06, C12-14), salivary gland (C07-08), tonsil and oropharynx (C09-10), nasopharynx (C11), nasal cavity and middle ear (C30), accessory sinuses (C31), and larynx (C32).
A contemporary analysis on data from 2002 to 2012 was performed, the most recent analysis of incident trends within the United States. Cases were stratified based on type, location, age, gender, and region. HNCs of all subtypes were analyzed together as a group. Further analysis was subsequently performed on laryngeal cancers. Oropharyngeal cancers were further analyzed independently (base of tongue and tonsil cancers) to attempt trend HPV-related cancers because these subsites are the most common primary sites in HPV-related cancer.9
Age-adjusted HNC, oropharyngeal cancer, and laryngeal cancer incidence rates were calculated and stratified by gender, age (0 to 29, 30 to 39, 40 to 49, 50 to 59, and $60 yr), and state of diagnosis for the period from 2002 to 2012. All incidence rates are expressed per 100,000 person-years. Joinpoint log-linear regression analysis was used to assess temporal trends in annual age-adjusted incidence rates from 2002 to 2012. Joinpoint software fits the simplest model to describe the incidence-rate trend data, starting with a straight line (0 joinpoint) and then adding more joinpoints to determine whether multiple connecting lines better describe the trend over time. The software identifies the year(s) when the annual percentage change (APC) trends appear to shift upward or downward and whether these trends are statistically relevant. In describing trends, the terms increased and decreased are used only when the slope (APC) was statistically relevant. All hypothesis testing was 2-sided with statistical significance evaluated at the 5% α level. Ninety-five percent confidence intervals were calculated to assess the precision of the obtained estimates. All analyses were performed in SAS 9.4 (SAS Institute, Cary, NC) and with the Joinpoint Regression Program 4.2.0.2 (Statistical Research and Applications Branch, National Cancer Institute, Bethesda, MD).
Results
From 2002 to 2012, there were 149,301 cases of HNC recorded in the SEER-18 Regs Research Database; 37,965 of these cases were oropharyngeal cancer and 32,246 of these cases were cancer of the larynx. Men constituted 70.3% of cases, and the age group of at least 60 years constituted 59.2% of cases (Table 1). Across all age groups and genders, the HNC rate decreased by 0.22% per year (P = .0549) and the rate of laryngeal cancer decreased by 1.9% per year (P < .0001). In contrast, the rate of oropharyngeal (and as such possibly HPV-related) HNC increased by 2.5% per year (P < .0001; Fig 1).
Table 1.
TRENDS IN US HEAD AND NECK CANCER AGE-STANDARDIZED INCIDENCE RATES (2000 US STANDARD POPULATION) BY GENDER, AGE GROUP, AND STATE, 2002 TO 2012
| Period | APC (95% CI) | P Value Testing for 0% APC | P Value Testing for Interaction† | |
|---|---|---|---|---|
| Overall | 2002-2012 | −0.22 (−0.45 to 0.006) | .0549 | NA |
| Gender | ||||
| Male | 2002-2012 | −0.29 (−0.53 to −0.04) | .0285* | .6027 |
| Female | 2002-2012 | −0.38 (−0.69 to −0.06) | .0239* | |
| Age | ||||
| 0-29 | 2002-2012 | −0.70 (−2.36 to 0.99) | .3721 | .0138† |
| 30-39 | 2002-2012 | −0.47 (−1.76 to 0.84) | .4389 | |
| 40-49 | 2002-2012 | −1.37 (−2.16 to −0.57) | .0038* | |
| 50-59 | 2002-2012 | 0.14 (−0.12 to 0.40) | .2409 | |
| ≥60 | 2002-2012 | −0.14 (−0.45 to 0.16) | .3111 | |
| State | ||||
| California | 2002-2012 | −0.55 (−0.85 to −0.25) | .0025* | <.0001† |
| Connecticut | 2002-2012 | 0.55 (0.11–1.00) | .0208* | |
| Georgia | 2002-2012 | −0.38 (−1.18 to 0.43) | .3203 | |
| Hawaii | 2002-2012 | −0.13 (−1.38 to 1.13) | .8184 | |
| Iowa | 2002-2012 | 0.51 (−0.20 to 1.22) | .1387 | |
| Kentucky | 2002-2012 | 0.99 (0.67−1.32) | <.0001* | |
| Louisiana | 2002-2012 | 0.13 (−0.68 to 0.95) | .7183 | |
| Michigan | 2002-2012 | −0.57 (−1.23 to 0.09) | .0816 | |
| New Jersey | 2002-2012 | −0.59 (−1.37 to 0.19) | .1221 | |
| New Mexico | 2002-2012 | −0.66 (−2.10 to 0.80) | .3297 | |
| Utah | 2002-2012 | −0.29 (−2.17 to 1.63) | .7413 | |
| Washington | 2002-2012 | 0.48 (−0.48 to 1.44) | .2888 |
Abbreviations: APC, annual percentage change; CI, confidence interval; NA, not applicable.
APC is statistically different from 0% at an α value equal to 0.05.
APC is statistically different among categories of subgroup at an α value equal to 0.05.
FIGURE 1.
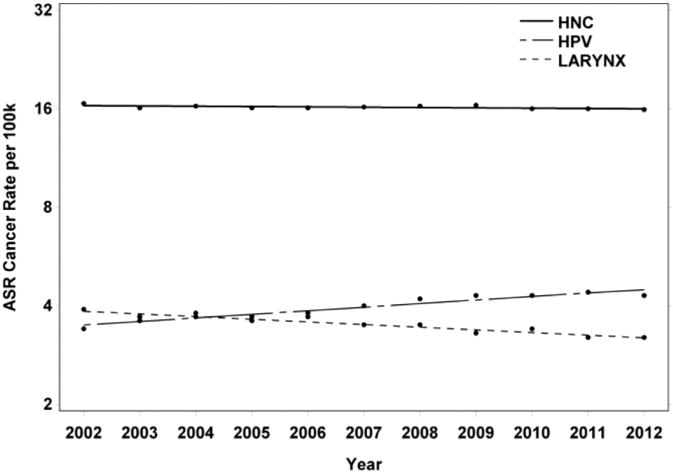
Joinpoint curves plotted on a logarithmic scale. This scale was used to better display incidence rates for HNC, HPV-related (oropharyngeal) cancer, and larynx cancer because there is a nearly 2 order-of-magnitude difference among disease-specific rates. ASR, age-adjusted incidence rate; HNC, head and neck cancer; HPV, human papillomavirus.
Mourad et al. Head and Neck Cancer Trends in United States. J Oral Maxillofac Surg 2017.
GENDER-RELATED TRENDS
When analyzed according to gender, there was a significant trend in HNC rates such that the incidence in men decreased 0.29% per year (P = .0357) and the incidence in women decreased 0.38% per year (P = .0074), without a significant difference between genders (Table 1, PFig 2). For oropharyngeal cancers, there was an increasing trend in HPV rates in men such that rate increased by 2.89% per year (< .0001), with a statistically insignificant increase of 0.57% in women (P = .0745; Fig 3). The difference between genders was significant (P < .0001; Table 2). For laryngeal cancer, men had a rate decrease of 2.09% per year (P < .0001) and women had a decrease of 1.71% per year (P = .0001), without a significant difference between genders (Table 3, Fig 4).
FIGURE 2.
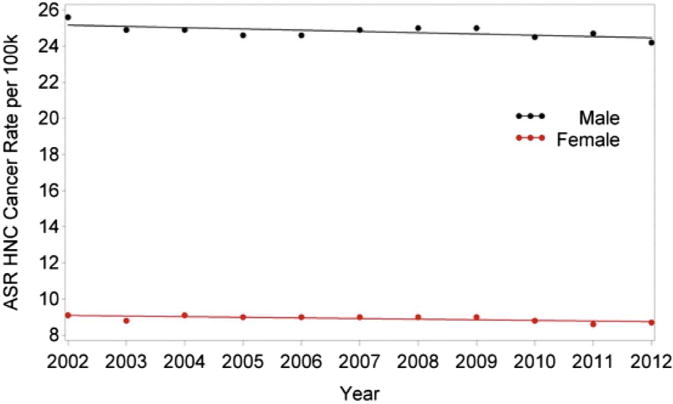
Changes in incidence of HNC from 2002 to 2012 according to gender. ASR, age-adjusted incidence rate; HNC, head and neck cancer.
Mourad et al. Head and Neck Cancer Trends in United States. J Oral Maxillofac Surg 2017.
FIGURE 3.
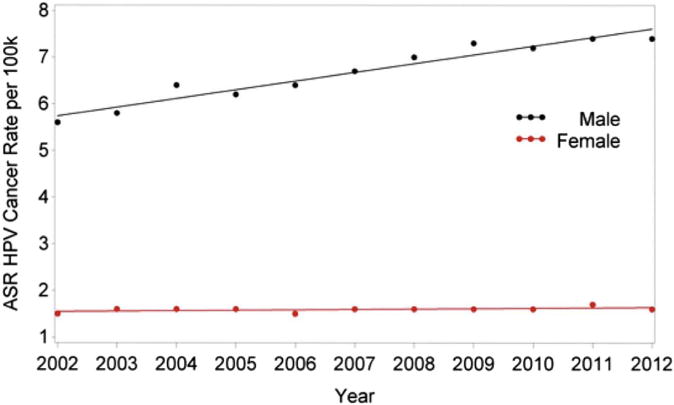
Changes in incidence of HPV-related (oropharyngeal) head and neck cancer from 2002 to 2012 according to gender. ASR, age-adjusted incidence rate; HPV, human papillomavirus.
Mourad et al. Head and Neck Cancer Trends in United States. J Oral Maxillofac Surg 2017.
Table 2.
TRENDS IN US HUMAN PAPILLOMAVIRUS AGE-STANDARDIZED INCIDENCE RATES (2000 US STANDARD POPULATION) BY GENDER, AGE GROUP, AND STATE, 2002 TO 2012
| Period | APC (95% CI) | P Value Testing for 0% APC | P Value Testing for Interaction | |
|---|---|---|---|---|
| Overall | 2002-2012 | 2.53 (1.93-3.13) | <.0001* | NA |
| Gender | ||||
| Male | 2002-2012 | 2.89 (2.27-3.52) | <.0001* | <.0001† |
| Female | 2002-2012 | 0.57 (−0.07 to 1.22) | .0745 | |
| Age | ||||
| 0-29 | 2002-2012 | 2.53 (−3.43 to 8.86) | .3701 | .0038† |
| 30-39 | 2002-2012 | −0.41 (−3.39 to 2.67) | .7682 | |
| 40-49 | 2002-2012 | −0.03 (−1.71 to 1.67) | .9649 | |
| 50-59 | 2002-2004 | 7.75 (1.99–13.84) | .0228* | |
| 2004-2010 | 2.44 (1.19–3.70) | .0083* | ||
| 2010-2012 | −2.08 (−7.32 to 3.45) | .3101 | ||
| ≥60 | 2002-2012 | 3.17 (2.49–3.85) | <.0001* | |
| State | ||||
| California | 2002-2012 | 1.84 (1.12–2.57) | .0003* | .0325† |
| Connecticut | 2002-2012 | 3.12 (1.96–4.29) | .0002* | |
| Georgia | 2002-2012 | 1.71 (0.38–3.06) | .0174* | |
| Hawaii | 2002-2012 | 1.60 (−0.95 to 4.21) | .1911 | |
| Iowa | 2002-2012 | 4.04 (2.60–5.51) | .0001* | |
| Kentucky | 2002-2012 | 4.46 (3.29–5.63) | <.0001* | |
| Louisiana | 2002-2012 | 2.72 (1.51–3.96) | .0007* | |
| Michigan | 2002-2012 | 1.63 (−0.25 to 3.54) | .0825 | |
| New Jersey | 2002-2012 | 2.53 (1.14–3.95) | .0026* | |
| New Mexico | 2002-2012 | 3.59 (0.74–6.51) | .0186* | |
| Utah | 2002-2012 | 2.60 (−1.17 to 6.51) | .1550 | |
| Washington | 2002-2012 | 2.74 (0.51–5.02) | .0214* |
Abbreviations: APC, annual percentage change; CI, confidence interval, NA, not applicable.
APC is statistically different from 0% at an α value equal to 0.05.
APC is statistically different among categories of subgroup at an α value equal to 0.05.
Table 3.
TRENDS IN US LARYNX AGE-STANDARDIZED INCIDENCE RATES (2000 US STANDARD POPULATION) BY GENDER, AGE GROUP, AND STATE, 2002 TO 2012
| Period | APC (95% CI) | P Value Testing for 0% APC | P Value Testing for Interaction | |
|---|---|---|---|---|
| Overall | 2002-2012 | −1.85 (−2.28 to −1.42) | <.0001* | NA |
| Gender | ||||
| Male | 2002-2012 | −2.09 (−2.30 to −1.88) | <.0001* | .4532 |
| Female | 2002-2012 | −1.71 (−2.79 to −0.62) | .0064* | |
| Age | ||||
| 0-29 | 2002-2012 | 6.78 (−0.17 to 14.22) | .0549 | <.0001† |
| 30-39 | 2002-2012 | 0.15 (−5.49 to 6.13) | .9533 | |
| 40-49 | 2002-2012 | −3.82 (−4.79 to −2.85) | .0001* | |
| 50-59 | 2002-2012 | −2.16 (−2.81 to −7.53) | <.0001* | |
| ≥60 | 2002-2012 | −1.65 (−2.11 to −1.18) | <.0001* | |
| State | ||||
| California | 2002-2012 | −2.95 (−3.49 to −2.40) | <.0001* | <.0001† |
| Connecticut | 2002-2012 | −0.97 (−2.68 to 0.77) | .2380 | |
| Georgia | 2002-2012 | −2.04 (−3.01 to −1.05) | .0012* | |
| Hawaii | 2002-2012 | −0.63 (−3.03 to 1.83) | .5734 | |
| Iowa | 2002-2012 | −0.19 (−1.57 to 1.22) | .7711 | |
| Kentucky | 2002-2012 | 0.14 (−0.41 to 0.69) | .5719 | |
| Louisiana | 2002-2012 | −0.55 (−1.91 to 0.82) | .3846 | |
| Michigan | 2002-2012 | −1.40 (−3.07 to 0.29) | .0936 | |
| New Jersey | 2002-2012 | −2.83 (−3.92 to −1.74) | .0003* | |
| New Mexico | 2002-2012 | −3.92 (−6.92 to −0.83) | .0187* | |
| Utah | 2002-2012 | −0.85 (−5.10 to 3.60) | .6712 | |
| Washington | 2002-2005 | 16.71 (4.33−30.56) | .0220* | |
| 2005-2008 | −11.45 (−29.24 to 10.81) | .1829 | ||
| 2008-2012 | 1.19 (−5.74 to 8.62) | .6328 |
Abbreviations: APC, annual percentage change; CI, confidence interval; NA, not applicable.
APC is statistically different from 0% at an α value equal to 0.05.
APC is statistically different among categories of subgroup at an α value equal to 0.05.
FIGURE 4.
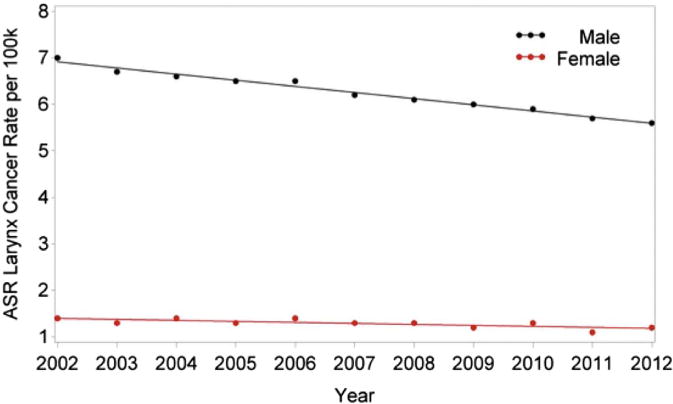
Changes in incidence of laryngeal cancer in the United States from 2002 to 2012 according to gender. ASR, age-adjusted incidence rate.
Mourad et al. Head and Neck Cancer Trends in United States. J Oral Maxillofac Surg 2017.
AGE-RELATED TRENDS
When analyzed according to age, there was a significant decreasing trend in HNC rates in patients 40 to 49 years old such that the rate decreased by 1.37% per year (P = .0038). There were no relevant trends in the other age groups (Table 1). However, there was a significant difference in HNC incidence trends from 2002 to 2012 among age groups (P = .0138; Fig 5). There was a relevant increasing trend in HPV rates in patients 50 to 59 years of age and those at least 60 years old (Table 2). For patients 50 to 59 years old, the incidence rate increased by 7.75% per year from 2002 to 2004 (P < .0001) and then at a slower rate of 2.44% from 2004 to 2010 (P < .0001). However, from 2010 to 2012 the rate of incidence decreased at a rate of 2.08% per year but was not statistically significant (P = .3101). In patients older than 60 years, the rate of incidence increased by 3.17% (P < .0001). There was a significant difference in trends among age groups (P = .0038; Fig 6). There was a significant decreasing trend in laryngeal cancer rates in patients 40 to 49 and 50 to 59 years of age such that the rate decreased by 3.82% and 2.16% per year, respectively (P = .0001; P = .0001). The difference in trends among age groups was significant (P = .0001; Fig 7, Table 3).
FIGURE 5.
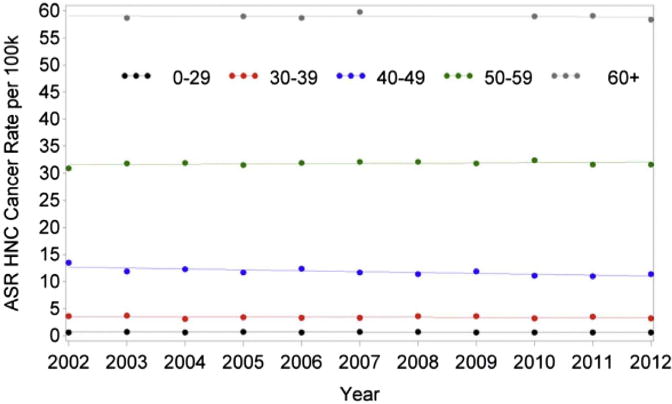
Changes in incidence in HNC from 2002 to 2012 according to age. ASR, age-adjusted incidence rate; HNC, head and neck cancer.
Mourad et al. Head and Neck Cancer Trends in United States. J Oral Maxillofac Surg 2017.
FIGURE 6.
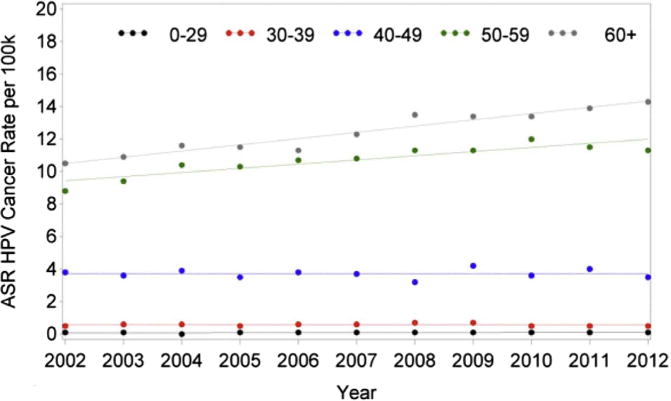
Changes in incidence of HPV-related (oropharyngeal) head and neck cancer from 2002 to 2012 according to age. ASR, age-adjusted incidence rate; HPV, human papillomavirus.
Mourad et al. Head and Neck Cancer Trends in United States. J Oral Maxillofac Surg 2017.
FIGURE 7.
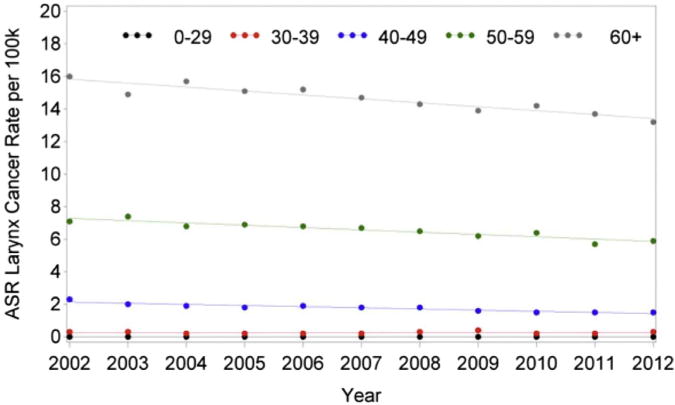
Changes in incidence of laryngeal cancer in the United States from 2002 to 2012 according to age. ASR, age-adjusted incidence rate.
Mourad et al. Head and Neck Cancer Trends in United States. J Oral Maxillofac Surg 2017.
GEOGRAPHIC-RELATED TRENDS
Comparison among states of overall age-standardized rates of HNC, oropharyngeal cancer, and laryngeal cancer was performed. HNC age-standardized incidence rates significantly decreased by 0.55% in people diagnosed in California (P < .0001) but increased by 0.55% per year in Connecticut (P < .0001) and 0.99% in Kentucky (P < .0001). There was a significant difference in HNC incidence rate trends from 2002 to 2012 among states of diagnosis (P < .0001; Table 1). Furthermore, when comparing the incidence rate changes for HNC among states, there was a statistically significant difference (P < .0001; Table 1). In analyzing HPV-A cancer rates, there was a marked increasing trend in HPV rates in all states with the exception of Utah, Hawaii, and Michigan (Fig 8). In comparing rates among states, a significant difference was found (P = .0325; Table 2). Analysis of state laryngeal cancer rates showed a notable decreasing trend in laryngeal cancer rates in California, Georgia, New Jersey, and New Mexico (Fig 9). From 2002 to 2005, Washington State had a laryngeal cancer incidence rate increase by 16.71% that was statistically relevant. The annual incidence rate subsequently decreased by 11.45% per year from 2005 to 2008, with an increase in incidence after 2008 by 1.198% per year, although this was not statistically significant (P = .632). Comparison among states showed a statistically significant difference in laryngeal cancer rates (P < .0001; Table 3).
FIGURE 8.
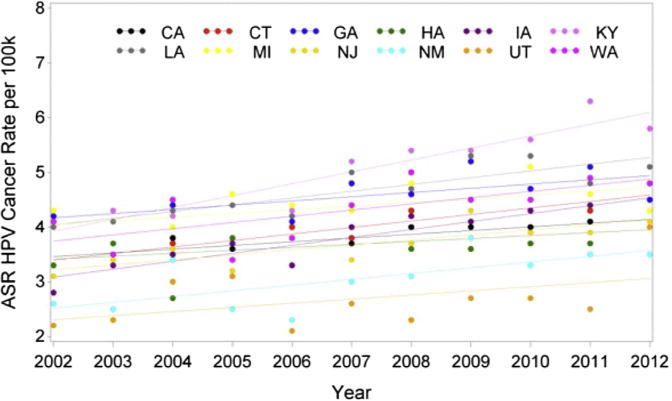
Changes in incidence of HPV-related (oropharyngeal) head and neck cancer from 2002 to 2012 according to geographic location. ASR, age-adjusted incidence rate; HPV, human papillomavirus.
Mourad et al. Head and Neck Cancer Trends in United States. J Oral Maxillofac Surg 2017.
FIGURE 9.
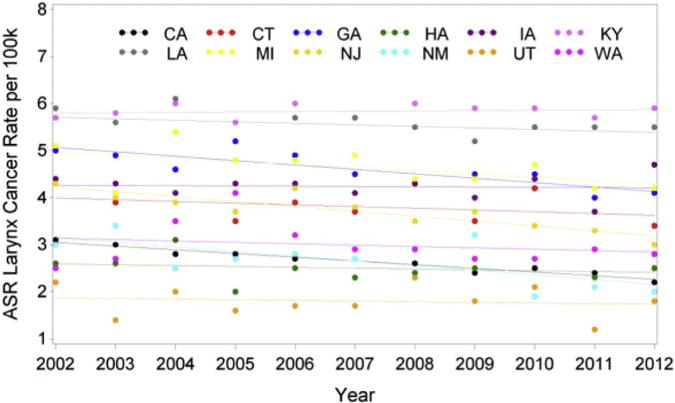
Changes in incidence of laryngeal cancer in the United States from 2002 to 2012 according to geographic location. ASR, age-adjusted incidence rate.
Mourad et al. Head and Neck Cancer Trends in United States. J Oral Maxillofac Surg 2017.
Discussion
This study examined the incidence of HNC in the United States from 2002 to 2012, with special consideration for age, gender, and state of residence. More than 95% of patients were at least 40 years of age and 70% of patients were men, which is similar to figures reported in similar studies of the United States and other countries.5,10–12
The overall incidence of HNC cancer decreased considerably during the study period at an APC of 0.22%, although the incidence of HPV-A cancer considerably increased during the same period at an APC of 2.5%. In their analysis of trends in HNC incidence from 1973 to 1999 in the United States using the SEER database, Carvalho et al5 also found an overall decreasing HNC incidence. However, Carvalho et al found that oropharyngeal incidence had not markedly changed during that study period, although their analysis of oropharyngeal HNC included malignant neoplasms of the soft palate and uvula, which are not associated with HPV. However, in a SEER-based study, Chaturvedi et al7 found that the incidence of HPV-related cancer from 1973 to 2004 steadily increased at an APC of 0.80%.
It is worth emphasizing that the present data of HPV-related cancer were based on the supposition that cancers of the tonsil and base of the tongue are primary oropharyngeal subsites associated with HPV. The present HPV-related oropharyngeal cancers were not molecularly diagnosed as carrying the HPV virus. A systematic review found that 35.6% of head and neck squamous cell carcinomas were positive for HPV in the oropharynx, 23.5% in the oral cavity, and 24% in the larynx.9 A separate study found HPV positivity of 57% in the oropharynx, 12% in the oral cavity, and 19% in the larynx.13 Overall, there is a wide variation in reports of the percentage of oropharyngeal cancers caused by HPV in the United States (36 to 73%) and Europe (14 to 93%), with an increased recognition of HPV being largely implicated in cancer pathogenesis within the base of the tongue and tonsil.14
The risk factors for HPV-related cancer are different than HPV-unrelated head and neck squamous cell carcinomas. Patients with HPV-related cancer are younger (by 3 to 5 years), have a higher socioeconomic status, have a higher education, have more life-time sexual partners, are associated with white race, and are less likely to have a history of extensive tobacco and alcohol use.15 The recent increase in HPV-related cancer could be due to increased rates of oral HPV exposure, because markers of high-risk sexual behavior such as younger ages of sexual debut, premarital sex, average number of lifetime partners, and the practice of oral sex have increased among recent birth cohorts in the United States.16
Analysis of gender distribution of HPV-related oropharyngeal cancers showed a male-to-female ratio of 4:1, within the range of similar studies.10,17–19 The 4:1 ratio of male-to-female HPV-related cancer prevalence matches a recent National Health and Nutrition Examination Survey study showing that the rate of oral HPV infection in men is 10.1% versus 3.6% in women, although the reason that the incidence has increased for men and not for women is unknown.13 Furthermore, despite HPV-related cancer rates increasing in male and female populations, the positive trend is statistically relevant only in men (APC, 2.89%). The difference in trends between men and women also was determined to be statistically relevant. A recent study in England from 2002 to 2011 found that HPV-related cancers had a marked increased incidence in men and women (47.1% in men, 37.5% in women). A Portugal-based study reported an increase in oropharyngeal cancer of 3.5 APC in men without a statistically relevant increase in women (APC, 2%).18 From 1999 to 2009 in Korea, HPV-related cancer had a statistically relevant APC of 2.65% in men without a statistically relevant result in women (APC, 2.35%).19 The present findings and recent global reports imply not only that more men are developing HPV-related oropharyngeal malignancies, but also that rates will continue to increase at a statistically relevant rate, potentially further skewing asymmetries in gender distribution.
Gender discrepancies in prevalence and rate changes are difficult to elucidate but could be related to differences in sexual practices. D’Souza et al16 found statistically meaningful differences between men and women when considering sexual practices. Men were more likely to have more lifetime oral and vaginal sexual partners, in addition to higher rates of HPV-16 infectivity. Other population-based studies have found higher rates of HPV-16 infectivity in men compared with women.20 Furthermore, current vaccination trends could contribute to a male predilection for the development HPV-related malignancies. The Advisory Committee on Immunization Practices (ACIP) first approved the quadrivalent HPV vaccination for use in girls in 2006, but it was not recommended for use in boys until 2009. In addition to lagging in vaccination recommendations in boys, large discrepancies in coverage and administering vaccinations exist. The ACIP reported that coverage in girls is higher (32 to 48%) than in boys (<2%).21
In consideration of age group trends of HPV-related cancer, there was a marked increase in incidence in patients 50 to 59 years old (APC, 7.75%) from 2002 to 2004 and then at a slower rate of 2.44% from 2004 to 2012. In patients older than 60 years, there was a statistically relevant increase in incidence by 3.17% per year. Similarly, researchers from Canada found an increase in tonsil and base of the tongue cancers, with the largest increase in incidence (APC, 5.4%) in people 50 to 59 years old from 1997 to 2009.17 Increasing rates in these age groups could be related to prevalence differences. HPV infectivity has been found to have a bimodal pattern, with peak prevalence in individuals 30 to 34 and 60 to 64 years old.20
Every state, with the exception of Georgia, Hawaii, and Michigan, showed a marked increasing trend in oropharyngeal and presumably HPV-related cancers, with no statistically significant difference among states (P = .3451). Causal differences in HPV-related cancers among states are difficult to elucidate, with a likely future increase in interstate differences related to vaccination practices. Currently, the impact of HPV vaccination on oropharyngeal cancer rates is being investigated, with no known randomized controlled trials to date.22 However, a randomized controlled study of more than 7,000 women showed decreased oropharyngeal HPV-16 and HPV-18 infectivity 4 years after vaccination.23 Georgia, Hawaii, and Michigan did not have a disproportionately high rate of HPV vaccination compared with states with increasing HPV-A cancer incidence based on an analysis of 2006 to 2011 vaccination rates.21 Hawaii has an estimated 43.4% vaccination coverage of at least 3 doses of the HPV vaccine for adolescents 13 to 17 years of age, which is better than the West census regions’ mean of 36.2%. Georgia had a rate of 29.0%, which is close to the South census region’s average of 29.9%. Michigan had a rate of 32.2%, which is close to the Midwest census region’s average of 31.1%. The Centers for Disease Control and Prevention (CDC) rates of immunizations are reported for a similar period as the present study, and any impact on immunization on cancer incidence would be expected to lag. This reflects the need for follow-up epidemiologic studies with specific emphases on determining impact on geographic variability in vaccination rates.
There was a marked decreasing trend in laryngeal cancer in the 40- to 49- and 50- to 59-year-old groups (APC, 3.82 and 2.16%, respectively). Laryngeal cancer incidence also decreasing in patients older than 60 years but not as rapidly (APC, 1.65%). This observation is supported by Carvalho et al5 who found a decreasing incidence of laryngeal cancer of 5.4 to 4.5% from 1973 to 1999. Similarly, Davies and Welch24 in 2006 found an overall decrease in laryngeal cancer rates from 1975 to 2001. Other studies have shown similar decreases in incidence in the United States and Europe.25–28 Two thirds of cases of laryngeal cancer were in individuals at least 60 years old in this study, a similar representation to the studies mentioned earlier. This decreasing trend has been attributed to decreased rates of smoking in younger populations and evolving tobacco-related legislation and marketing.5,29
Kentucky, California, and Connecticut were the only states that had meaningful changes in trend of HNC incidence. Kentucky and Connecticut had statistically relevant increasing APCs of 0.99 and 0.55%, respectively. California had a statistically relevant decreasing APC rate of 0.55% per year. According to the CDC, as of 2012 Kentucky has the highest smoking prevalence of any other state (29% compared with the national mean of 21.2%), with California having among the lowest reported rates of tobacco use.30 Given the major risk factor of tobacco exposure to the development of HNC, the high prevalence of smoking in Kentucky could be responsible for its increasing incidence of HNC.
Although the SEER database is an invaluable source for US epidemiologic studies, certain limitations exist. The greatest limitation of this study is the lack of molecular data recorded within the SEER, which would be necessary to confirm HPV-related trends. However, the assumption that HPV-associated cancers predominantly involve the base of the tongue and tonsils led to findings consistent with global and national trends from concomitant studies and studies that used molecular and histochemical markers.16,17 Furthermore, the SEER database only encompasses oncologic data for approximately 28% of the US population. Despite this given limitation, the authors believe that the large amount of data covering more than 149,000 entries from 2002 to 2012 provide a comprehensive summary of the most recent epidemiologic trends of the United States consistent with previous studies.24
The overall incidence of HNC is decreasing in the United States. However, there is an increasing incidence of HPV-related cancers of the oropharynx. Meaningful differences in cancer incidence and rate of change exist between men and women. Furthermore, younger groups have a greater decrease of overall HNC, with an overall increase in HPV-related in cancer in patients older than 50 years. All states have decreasing HNC rates, with the exception of Kentucky and Connecticut. All states, with the exception of Georgia, Hawaii, and Michigan, have an increasing rate of HPV-related oropharyngeal cancers.
Acknowledgments
The authors acknowledge the support of the Biostatistics Shared Resource Facility and the National Cancer Institute Cancer Center, Icahn School of Medicine at Mount Sinai, for their help with the statistical analysis, interpretation of data, and preparation of this report. They also acknowledge the support of the Mount Sinai Health System.
This study was supported by the National Cancer Institute Cancer Center (grant P30 CA196521-01).
Footnotes
Conflict of Interest Disclosures: None of the authors have a relevant financial relationship(s) with a commercial interest.
Press Release
This article’s Press Release can be found, in the online version, at http://dx.doi.org/10.1016/j.joms.2017.05.008.
References
- 1.Siegel RL, Miller KD, Jemal A. Cancer statistics, 2015. CA Cancer J Clin. 2015;65:5. doi: 10.3322/caac.21254. [DOI] [PubMed] [Google Scholar]
- 2.McLaughlin JK, Gridley G, Block G, et al. Dietary factors in oral and pharyngeal cancer. J Natl Cancer Inst. 1988;80:1237. doi: 10.1093/jnci/80.15.1237. [DOI] [PubMed] [Google Scholar]
- 3.Marur S, D’Souza G, Westra WH, et al. HPV-associated head and neck cancer: A virus-related cancer epidemic. Lancet Oncol. 2010;11:781. doi: 10.1016/S1470-2045(10)70017-6. [DOI] [PMC free article] [PubMed] [Google Scholar]
- 4.Khalili J. Oral cancer: Risk factors, prevention and diagnostic. Exp Oncol. 2008;30:259. [PubMed] [Google Scholar]
- 5.Carvalho AL, Nishimoto IN, Califano JA, et al. Trends in incidence and prognosis for head and neck cancer in the United States: A site-specific analysis of the SEER database. Int J Cancer. 2005;114:806. doi: 10.1002/ijc.20740. [DOI] [PubMed] [Google Scholar]
- 6.Chaturvedi AK, Engels EA, Pfeiffer RM, et al. Human papillomavirus and rising oropharyngeal cancer incidence in the United States. J Clin Oncol. 2011;29:4294. doi: 10.1200/JCO.2011.36.4596. [DOI] [PMC free article] [PubMed] [Google Scholar]
- 7.Chaturvedi AK, Engels EA, Anderson WF, et al. Incidence trends for human papillomavirus-related and -unrelated oral squamous cell carcinomas in the United States. J Clin Oncol. 2008;26:612. doi: 10.1200/JCO.2007.14.1713. [DOI] [PubMed] [Google Scholar]
- 8.Surveillance, Epidemiology, and End Results (SEER) Program: SEER*Stat Database: Incidence—SEER 18 Regs Research Data, November 2014 Submission (1973-2012)—Linked to County Attributes—Total U.S., 1969-2013 Counties, National Cancer Institute, DCCPS, Surveillance Research Program, Surveillance Systems Branch, released April 2015, based on November 2014 submission. Available at: https://www.seer.cancer.gov. Accessed October 17, 2016.
- 9.Kreimer AR, Clifford GM, Boyle P, et al. Human papillomavirus types in head and neck squamous cell carcinomas worldwide: A systematic review. Cancer Epidemiol Biomarkers Prev. 2005;14:467. doi: 10.1158/1055-9965.EPI-04-0551. [DOI] [PubMed] [Google Scholar]
- 10.McCarthy CE, Field JK, Rajlawat BP, et al. Trends and regional variation in the incidence of head and neck cancers in England: 2002 to 2011. Int J Oncol. 2015;47:204. doi: 10.3892/ijo.2015.2990. [DOI] [PubMed] [Google Scholar]
- 11.Blomberg M, Nielsen A, Munk C, et al. Trends in head and neck cancer incidence in Denmark, 1978–2007: Focus on human papillomavirus associated sites. Int J Cancer. 2011;129:733. doi: 10.1002/ijc.25699. [DOI] [PubMed] [Google Scholar]
- 12.Doobaree IU, Landis SH, Linklater KM, et al. Head and neck cancer in South East England between 1995–1999 and 2000–2004: An estimation of incidence and distribution by site, stage and histological type. Oral Oncol. 2009;45:809. doi: 10.1016/j.oraloncology.2008.12.009. [DOI] [PubMed] [Google Scholar]
- 13.Gillison ML, Koch WM, Capone RB, et al. Evidence for a causal association between human papillomavirus and a subset of head and neck cancers. J Natl Cancer Inst. 2000;92:709. doi: 10.1093/jnci/92.9.709. [DOI] [PubMed] [Google Scholar]
- 14.Joseph AW, D’Souza G. Epidemiology of human papillomavirus-related head and neck cancer. Otolaryngol Clin North Am. 2012;45:739. doi: 10.1016/j.otc.2012.04.003. [DOI] [PubMed] [Google Scholar]
- 15.Benard VB, Johnson CJ, Thompson TD, et al. Examining the association between socioeconomic status and potential human papillomavirus-associated cancers. Cancer. 2008;113(suppl):2910. doi: 10.1002/cncr.23742. [DOI] [PubMed] [Google Scholar]
- 16.D’Souza G, Agrawal Y, Halpern J, et al. Oral sexual behaviors associated with prevalent oral human papillomavirus infection. J Infect Dis. 2009;199:1263. doi: 10.1086/597755. [DOI] [PMC free article] [PubMed] [Google Scholar]
- 17.Forte T, Niu J, Lockwood GA, et al. Incidence trends in head and neck cancers and human papillomavirus (HPV)-associated oropharyngeal cancer in Canada, 1992–2009. Cancer Causes Control. 2012;23:1343. doi: 10.1007/s10552-012-0013-z. [DOI] [PubMed] [Google Scholar]
- 18.Monteiro LS, Antunes L, Bento MJ, et al. Incidence rates and trends of lip, oral and oro-pharyngeal cancers in Portugal. J Oral Pathol Med. 2013;42:345. doi: 10.1111/jop.12010. [DOI] [PubMed] [Google Scholar]
- 19.Shin A, Jung Y-S, Jung K-W, et al. Trends of human papillomavirus-related head and neck cancers in Korea: National cancer registry data. Laryngoscope. 2013;123:E30. doi: 10.1002/lary.24243. [DOI] [PubMed] [Google Scholar]
- 20.Gillison ML, Broutian T, Pickard RKL, et al. Prevalence of oral HPV infection in the United States, 2009–2010. JAMA. 2012;307:693. doi: 10.1001/jama.2012.101. [DOI] [PMC free article] [PubMed] [Google Scholar]
- 21.National and state vaccination coverage among adolescents aged 13-17 years—United States, 2011. Centers for Disease Control and Prevention (CDC) MMWR Morb Mortal Wkly Rep. 61(671):2012. [PubMed] [Google Scholar]
- 22.Takes RP, Wierzbicka M, D’Souza G, et al. HPV vaccination to prevent oropharyngeal carcinoma: What can be learned from anogenital vaccination programs? Oral Oncol. 2015;51:1057. doi: 10.1016/j.oraloncology.2015.10.011. [DOI] [PubMed] [Google Scholar]
- 23.Herrero R, Quint W, Hildesheim A, et al. Reduced prevalence of oral human papillomavirus (HPV) 4 years after bivalent HPV vaccination in a randomized clinical trial in Costa Rica. 2013 doi: 10.1371/journal.pone.0068329. Available at: http://dx.plos.org/10.1371/journal.pone.0068329. Accessed October 22, 2017. [DOI] [PMC free article] [PubMed]
- 24.Davies L, Welch HG. Epidemiology of head and neck cancer in the United States. Otolaryngol Head Neck Surg. 2006;135:451. doi: 10.1016/j.otohns.2006.01.029. [DOI] [PubMed] [Google Scholar]
- 25.Hoffman HT, Porter K, Karnell LH, et al. Laryngeal cancer in the United States: Changes in demographics, patterns of care, and survival. Laryngoscope. 2006;116(suppl 111):1. doi: 10.1097/01.mlg.0000236095.97947.26. [DOI] [PubMed] [Google Scholar]
- 26.Cosetti M, Yu G-P, Schantz SP. Five-year survival rates and time trends of laryngeal cancer in the US population. Arch Otolaryngol Head Neck Surg. 2008;134:370. doi: 10.1001/archotol.134.4.370. [DOI] [PubMed] [Google Scholar]
- 27.Capocaccia R, Micheli A, Berrino F, et al. Time trends of lung and larynx cancers in Italy. Int J Cancer. 1994;57:154. doi: 10.1002/ijc.2910570204. [DOI] [PubMed] [Google Scholar]
- 28.Raitiola HS, Pukander JS. Changing trends in the incidence of laryngeal cancer. Acta Oncol. 1997;36:33. doi: 10.3109/02841869709100728. [DOI] [PubMed] [Google Scholar]
- 29.Everett SA, Husten CG, Kann L, et al. Smoking initiation and smoking patterns among US college students. J Am Coll Health. 1999;48:55. doi: 10.1080/07448489909595674. [DOI] [PubMed] [Google Scholar]
- 30.Centers for Disease Control and Prevention. Tobacco Control State Highlights 2010. Atlanta, GA: US Department of Health and Human Services, Centers for Disease Control and Prevention, National Center for Chronic Disease Prevention and Health Promotion, Office on Smoking and Health; 2010. 2010. Available at: https://www.cdc.gov/tobacco/data_statistics/state_data/state_highlights/2010/pdfs/highlights2010.pdf. [Google Scholar]


