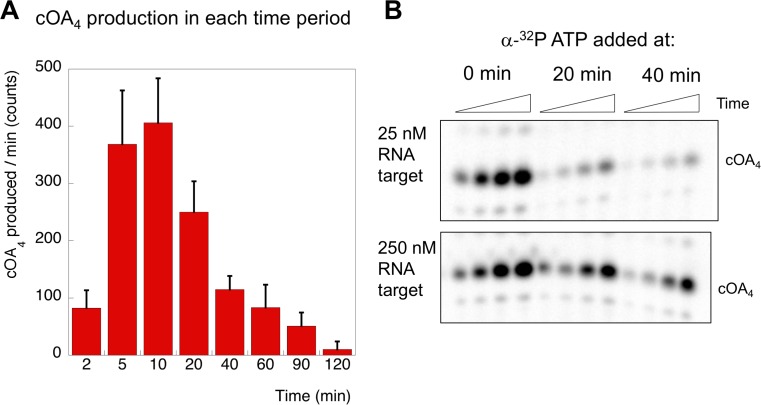
Figure 7. cOA production as a function of time and target RNA concentration.
(A) cOA4 synthesis was quantified using radioactive ATP under the assay conditions described for Figure 6 and plotted as cOA4 synthesised per min (densitometric counts) during the period of each reaction time slot. This was carried out in triplicate: means and standard deviations are shown. (B) In this experiment, α-32P-ATP was added to reactions at 0, 20 or 40 min and the reaction followed for a further 40 min (time points 5, 10, 20 and 40 min). Under standard single turnover conditions (25 nM target RNA), cOA synthesis was largely complete after 20 min. When target RNA was increased ten-fold, cOA synthesis persisted for a longer period.

