

Abstract
To characterize the molecular origin of primary lymphomas of the central nervous system (PCNSL), 21 PCNSLs of immunocompetent patients were investigated by microarray-based gene expression profiling. Comparison of the transcriptional profile of PCNSL with various normal and neoplastic B-cell subsets demonstrated PCNSL (i) to display gene expression patterns most closely related to late germinal center B cells, (ii) to display a gene expression profile similar to systemic diffuse large B-cell lymphomas (dLbCLs) and (iii) to be in part assigned to the activated B-cell-like (ABC) or the germinal center B-cell-like (GCB) subtype of DLBCL.
Keywords: PCNSL, DLBCL, gene expression profiling
Introduction
Primary central nervous system lymphomas (PCNSLs) are mature aggressive lymphomas morphologically corresponding to the diffuse large B-cell type (DLBCL); however, differing from systemic DLBCL by their less favorable prognosis. PCNSLs have been suggested to be derived from germinal center (GC) B cells.1,2 On the basis of their immunophenotype, PCNSLs were suggested to be more homogenous than systemic DLBCL.3 However, also considering the limitations of semiquantitative immunohistochemistry with their varying rates of concordance for different markers,4 it is still a matter of debate whether PCNSL corresponds to either the activated B-cell-like (ABC) or the germinal center B-cell-like (GCB) subtype as defined for systemic DLBCL or constitute a separate entity. This is mainly due to the fact that in most cases the tiny size of stereotactic biopsies precludes transcriptional profiling studies. Here, we report on a microarray-based expression profiling of 21 PCNSLs. The gene expression profiles were compared with those of normal brain tissue as well as various normal B-cell subsets and systemic lymphomas. This approach allowed to characterize the relationship of the tumor cells in PCNSL with other nonmalignant and malignant B-cell populations.
Materials and methods
Patients and diagnosis
Stereotactic biopsies of 21 HIV-negative patients (14 females, 7 males, mean age = 67.6 years, range = 47–82 years, for patients’ data see Supplementary Table S1) were included in this study. The diagnoses of PCNSL of DLBCL5 type were based on a combination of standard neuropathology and immunohisto- chemistry as described.1 Biopsies were collected in the Departments of Neuropathology, University Hospital of Cologne, Bonn, Düsseldorf and the Department of Pathology, University Hospital of Schleswig-Holstein, Campus Kiel, Germany. In these centers, samples were snap-frozen immediately after neurosurgical removal; sections were cut from the blocks for diagnostic purposes and the assurance of tissue quality. Tumor samples were stored at –80°C until used for molecular biological analysis.
In addition, systemic DLBCL lymph node samples from five patients were used for immunohistochemistry. All studies were approved by the Local Ethics Committees; informed consent was provided according to the Declaration of Helsinki.
Generation of gene transcription profiles
Total RNA was extracted from tissue blocks containing ≥80% tumor cells using the TRIzol reagent (Invitrogen, Carlsbad, CA, USA) and purified using RNeasy Kit (Qiagen, Valencia, CA, USA). RNA quality was assured by photometrical determination of the OD260/280 ratio, which was 2.0 or 2.1 in all samples. To exclude degraded RNA, all RNA samples were further checked by gel electrophoresis. In all samples, the intensity of the 26S rRNA band was at least twofold that of the 18S rRNA band in the absence of any smear.
Double-stranded cDNA (ds-cDNA) was generated from 5 μg of total RNA using the SuperScript Double-Stranded cDNA Synthesis Kit (Invitrogen) and a poly-dT oligonucleotide that contains T7 RNA polymerase initiation site (Sigma-Proligo, St Louis, MO, USA). The ds-cDNA was used as template to generate biotinylated cRNA by in vitro transcription using MEGA-script T7 High Yield Transcription Kit (Ambion, Austin, TX, USA), biotin-11-CTP and biotin-11-UTP (Perkin Elmer, Altham, MA, USA). The biotinylated cRNA was purified by RNeasy Kit (Qiagen) and fragmented according to the Affymetrix protocol. Fifteen micrograms of fragmented cRNA was hybridized to HG-U95Av2 microarrays (Affymetrix, Santa Clara, CA, USA). Gene expression values were determined by GeneChip Operating Software (GCOS version 1.2, Affymetrix). All procedures regarding normalization and standardization are automatically included in GCOS using the global scaling option. For transposition of all values, the TGT parameter was chosen to be 250, which has been determined as suitable in previous analyses (GSE 6047).
All non-PCNSL expression profiles included in this study have been performed by use of the same platform (Affymetrix HG- U95Av2 microarray). While we have addressed the transcriptional profile of lymphomas and normal B-cell subsets (GSE2350,6 GEO database7) previously, normal brain tissue (GSE2164,8 GEO database) was assessed by Vawter et al.8 using the same platform.
Transcriptional profiling
Dendrograms were generated using an unsupervised hierarchical clustering algorithm based on average-linkage method as described before.9 The color scale bar shows the relative transcriptional changes normalized by the s.d. (0 is the mean expression level of a given gene); each column represents a gene and each row represents a sample.
Supervised transcription analysis was performed by use of the Genes@Work software platform,10,11 which is a gene expression analysis tool based on the pattern discovery algorithm structural pattern localization analysis by sequential histograms. The results of such an analysis are shown in matrices (heat maps), in which each row represents a gene and each column represents a sample. Genes are ranked according to the z-score (mean expression difference of the gene between the phenotype group and the control group/s.d.). The color change in each row represents the level of transcription relative to the mean across the samples. Values are visualized according to the scale bar that represents the difference in the z-score (expression difference/s.d.) relative to the mean. The phenotype set classifier has been described before.12 This classification was used to measure the relatedness of PCNSL to two normal B-cell subtypes. The gray area marks 95% of confidence, the P value decreases with increasing distance from the x axis.
Application of an ABC/GCB classifier as defined for systemic DLBCL
Hierarchical clustering was performed with 60 systemic DLBCL and two lymphoma cell lines. The cell line Ly3 has a typical ABC phenotype, the cell line SuDHL6 exhibits a typical GCB phenotype. Eight DLBCLs similar either to Ly3 or SuDHL6 were taken together with the cell lines as predictors. The classifier was applied according to Wright et al.13
Results
PCNSL resemble late germinal center B cells in their gene expression pattern
To determine the histogenetic origin of PCNSL, the gene expression data were compared to patterns of purified germinal center (GC) and non-GC B cells (naive and memory).9 Although the gene expression pattern points to heterogeneity among PCNSL, they were more closely related to memory B cells than to GC B cells (Figures 1a-e). However, the gene expression pattern (value <0.8) suggests that the tumor cells of PCNSL have not reached the post-GC B-cell stage (value >0.9, Figure 1e).
Figure 1.
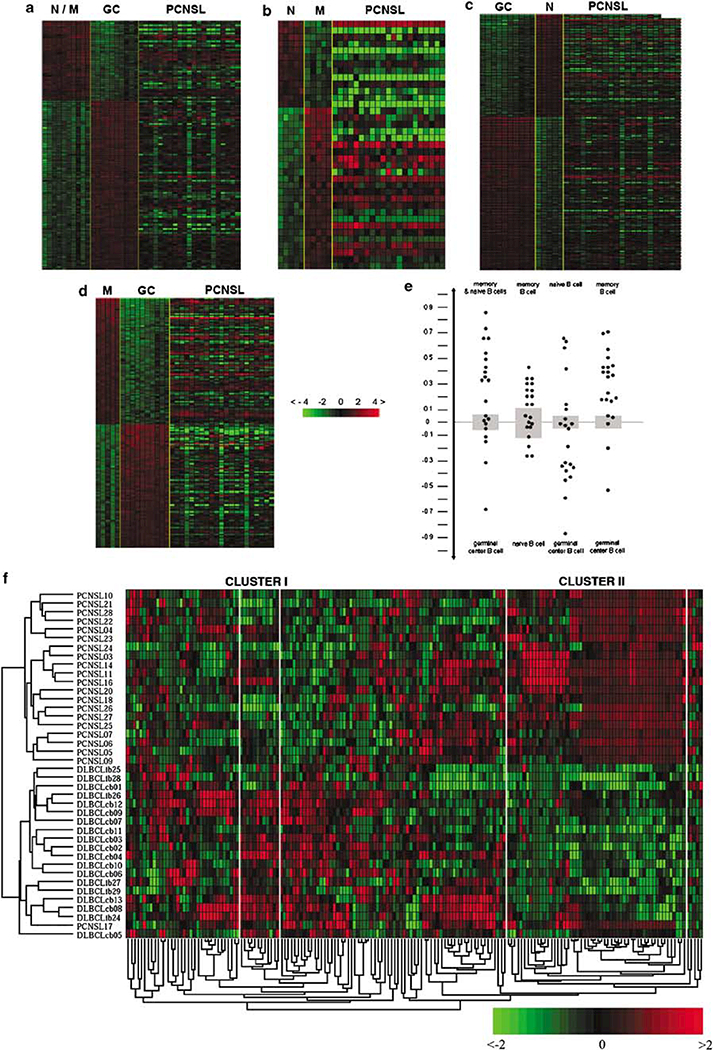
Relatedness of the gene expression profile of PCNSL to normal B-cell populations. (a-e) Assessment of the gene expression profile of PCNSL as compared to normal B-cell populations. Genes differentially expressed between two groups of samples are calculated by supervised analysis. Signature of naive (N) and memory (M) B cells (N/M) versus germinal center centroblasts and centrocytes (GC) (a), of M B cells versus N B cells (b), of N B cells versus GC B cells (c) and of M B cells versus GC (d). The expression of the selected genes was investigated in PCNSL displayed on the right side of each matrix (a-d). (e) Classification according to the respective cell type was used to calculate the assignment of PCNSL to two normal B-cell subtypes. A cell-type classification is used to measure the relatedness of PCNSL to different normal B-cell subsets. The gray area marks 95% of confidence: The P value decreases with increasing distance from the x axis. (f) Unsupervised hierarchical clustering of gene expression values from PCNSL and DLBCL excluding the top 476 genes highly expressed in normal brain as compared to lymphatic tissue. Unsupervised analysis was performed in 21 cases of PCNSL and 19 cases of systemic DLBCL. The 40 tumor samples are clustered according to their expression of 173 genes. DLBCL, diffuse large B-cell lymphoma;PCNSL, primary central nervous system lymphoma.
Transcriptional profiling does not provide evidence for tumor cells of PCNSL to differ from those of systemic DLBCL
Unsupervised analysis of the gene expression data distinguished PCNSL from systemic DLBCL and Burkitt’s lymphoma (Supplementary Figure S1). However, this segregation was strongly associated with the different origin of the biopsies (brain versus lymph node). Supervised analysis comparing gene expression data from normal CNS8 obtained with the same platform with normal and neoplastic B-cell samples identified a cluster of 712 genes to be differentially expressed. Among these 712 genes, 476 genes showed a higher expression in brain as compared to normal and malignant B-cell subsets (z-score ≤ –1.8, Supplementary Figure S2). After exclusion of these 476 genes, an unsupervised analysis identified two clusters of genes, which were associated with PCNSL and systemic DLBCL, respectively (Figure 1f, Supplementary Table S2). Cluster I contained genes with an increased expression in systemic DLBCL as compared to PCNSL. Genes in cluster II showed a higher expression in PCNSL as compared to systemic DLBCL. Cluster II included predominantly housekeeping genes and genes encoding ribosomal proteins (z-score below the threshold for exclusion as brain-specific genes) as well as SERPINA3, which is not expressed in the normal brain. The expression of SERPINA3 was further studied at the protein level. Immunohis- tochemistry revealed that tumor cells of both PCNSL and systemic DLBCLs were SERPINA3-negative, while macrophages, activated microglia, and reactive astrocytes within the PCNSL samples were SERPINA3-positive (Supplementary Figure S3).
A total of 4551 genes were found to be expressed in at least five samples of either purified naive, GC or memory B-cell subsets. Limiting the unsupervised analysis to these 4551 genes in PCNSL versus systemic DLBCL failed to identify differential expression of genes in cluster I of the unsupervised analysis (Figure 1f), because these genes were not expressed in B cells except for LCK (Figure 1f, Supplementary Table S2). Furthermore, this analysis largely confirmed the genes depicted in cluster II to be differentially expressed between PCNSL and DLBCL (Figure 1f, Supplementary Table S2) with the exception of for example, SERPINA3, which is not expressed in normal B-cell subsets. Among the 54 genes in cluster II derived from the unsupervised analysis (Figure 1f, Supplementary Table S2), 28 genes were expressed in normal B-cell subsets.
A supervised analysis of the 4551 tags expressed in normal B-cell subsets revealed 39 tags with an increased expression in PCNSL as compared to systemic DLBCL. None showed a decreased expression. A sequential supervised analysis comparing expression of these 39 tags in PCNSL and normal CNS detected 19 genes with a higher expression in PCNSL (Supplementary Figure S4, Supplementary Table S3). Remarkably, with the exception of β2-microglobulin, all of these genes encode ribosomal proteins (Supplementary Table S3).
Recently, Rubenstein et al.14 have identified 462 ESTs differentially expressed between PCNSL and systemic DLBCL. These ESTs align to 161 genes, from which 133 tags corresponding to 90 genes were present on the HG-U95Av2 microarray; however, of all of these genes only two, that is, VCAM-1 and CCL19, showed a differential expression between PCNSL and systemic DLBCL in our series. VCAM-1 and CCL19 were downregulated in PCNSL samples as compared to systemic DLBCL (Figure 2). As shown by immunohistochem- istry, VCAM-1 was absent from tumor cells of PCNSL and systemic DLBCL (Supplementary Figure S3). In contrast, in samples of PCNSL some cerebral vascular endothelial cells were VCAM-1-positive as were blood vessel endothelial cells in lymph node samples. Five further genes appeared to show a differential pattern of expression based on fold-changes. However, all of these genes were heterogenously expressed within each group. Among these five genes, fibronectin was absent from the tumor cells of both systemic DLBCL as well as PCNSL by immunohistochemistry. In PCNSL samples, reactive astrocytes of the tumor border were strongly fibronectin-positive (Supplementary Figure S3). Thus, with respect to lymphoma- specific genes and genes known to be important in lymphoma- genesis, our data do not provide evidence for major differences in the expression profiles of tumor cells in PCNSL versus systemic DLBCL.
Figure 2.
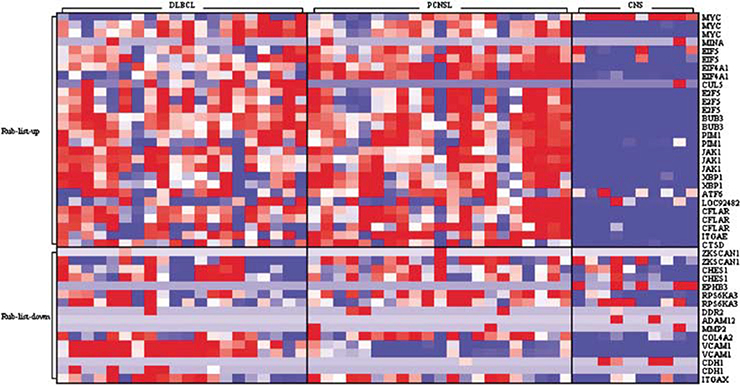
Expression analysis of genes previously reported to be differentially expressed between PCNSL and systemic DLBCL. Rubenstein et al.14 have described 462 ESTs to be differentially expressed between PCNSL and systemic DLBCL with 29 genes to discriminate most significantly. A total of 133 tags of these ESTs were represented on the HG-U95Av2 microarray. The expression profile of these 133 tags was evaluated in our group of PCNSL demonstrating that they did not differ from systemic DLBCL in the vast majority. VCAM-1 and CCL19 were the only genes, which were downregulated in PCNSL as compared to DLBCL. DLBCL, diffuse large B-cell lymphoma; PCNSL, primary central nervous system lymphoma.
PCNSLs are distributed among the spectrum of systemic DLBCL
Wright et al.13 have developed a gene-expression-based predictor to classify systemic DLBCL into ABC and GCB subgroups. Application of this predictor to our series of PCNSL revealed that five and seven of these tumors corresponded to the ABC and GCB subtype, respectively, whereas nine PCNSL neither assigned to the ABC nor to the GCB subgroup (Supplementary Figure S5). Thus, these data show that PCNSLs are distributed among the spectrum of systemic DLBCL.
Discussion
This study provides to the best of our knowledge, the first application of Affymetrix chip technology to the entity of PCNSL. Limitation of such analyses is largely due to the tiny size of the stereotactic biopsy samples obtained for diagnosis, which also precludes purification of the tumor cells.
By gene expression profiling analysis of 21 PCNSL we demonstrate that (i) PCNSL resemble late GC B cells, (ii) PCNSL do not differ markedly from systemic DLBCL with respect to their gene expression pattern and (iii) according to their gene expression profile PCNSLs are distributed among the spectrum of DLBCL.
Comparison of the gene expression profile of PCNSL to nonmalignant GC and non-GC B cells showing a more close relation to memory B cells than to GC B cells fitted into the concept of PCNSL being derived from a late GC B cell (GC exit phenotype). This is in line with the CD20 + CD10– BCL6 + IgM + /IgD + IgG–IRF4/MUM1 + CD138– immuno-logical phenotype of PCNSL and the evidence for ongoing somatic hypermutation.1,3
A major challenge of the present study was to distinguish between the gene expression profile of the tumor cells and the ‘background’ signature of the organ of manifestation, that is, brain versus secondary lymphatic organs, as this may lead to differences not attributable to characteristics of the tumor cells. In fact, the unsupervised analysis of gene expression profiles clearly distinguished between PCNSL on one hand and systemic DLBCL and Burkitt’s lymphoma as major representatives of aggressive mature lymphomas9,15 on the other hand; however, this segregation was due to the site of involvement. This observation necessitated the exclusion of brain associated genes, which was performed in a supervised analysis comparing gene expression data from normal CNS with normal and neoplastic B-cell samples, followed by the exclusion of a cluster of 476 genes with an increased expression in brain as compared to B cells.
An unsupervised analysis comparing PCNSL and systemic DLBCL identified two cluster of genes, which showed either a decreased (cluster I) or an increased expression (cluster II) in PCNSL as compared to systemic DLBCL. Genes in cluster I are not expressed by the tumor cells; instead, non-B cells in lymphatic organs are known as cellular sources, for example, T cells and macrophages. This is further supported by an unsupervised analysis of B-cell specific tags only, which failed to detect cluster I.
With respect to cluster II, a further sequential supervised analysis revealed 19 genes, 18 of which are ribosomal genes, with an increased expression in PCNSL as compared to both systemic DLBCL and normal CNS. Such a difference may be explained by a slightly higher RNA quality of the PCNSL samples as they were snap-frozen within 30 min, whereas systemic DLBCL samples were frozen within 10 h.
Except for SERPINA3, genes in cluster II appeared to be expressed at higher levels in the brain, but escaped the exclusion, because their z-score did not reach our threshold. SERPINA3, which is absent from normal brain as well as from normal B-cell subsets, was not expressed by the tumor cells, neither in PCNSL nor in systemic DLBCL. Instead, macrophages, activated microglia, and reactive astrocytes, all of which are characteristically associated with the malignant B cells in PCNSL (Supplementary Figure S3), were SERPINA3-positive and, thus, were identified as the cellular sources accounting for the strongly increased gene expression.
A CNS-specific impact may also account at least in part for differences in the gene expression pattern between PCNSL and systemic DLBCL as reported by Rubenstein et al.14 These authors observed more than 460 ESTs to be significantly differently expressed between 23 PCNSL and 9 DLBCL and published a list of 29 ESTs to be most differentially expressed between these two lymphoma entities. In these analyses, genes highly expressed in CNS tissue have been excluded in a different way. This renders it likely that the different signatures identified at least in part the site of origin (brain versus lymphatic tissue), but not the genes specifically involved in the pathogenesis of PCNSL. In fact, analysis of the 133 tags of the Rubenstein classifier on the HG-U95Av2 microarray showed only two genes to be differentially expressed between PCNSL and systemic DLBCL in our series. One of these genes, that is, VCAM-1, is constitutively expressed on bone marrow stromal cells and follicular dendritic cells. In the normal brain, VCAM-1 is strictly downregulated (Figure 2, Supplementary Figure S3) and induced on cerebral blood vessel endothelial cells in inflammation-induced T-cell homing. Therefore, the relative downregulation of VCAM-1 in PCNSL as compared to systemic DLBCL most likely reflects an organ-specific regulation of this cell adhesion molecule, which is unrelated to PCNSL development. In addition, in PCNSL, CCL19 was lower than in systemic DLBCL. This is expected, as CCL19 is a chemokine characteristically expressed in secondary lymphoid organs by dendritic cells. In our series of PCNSL, we also could not confirm Rubenstein’s et al.14 recent observation of a differential expression of the XBP-1 gene between PCNSL and systemic DLBCL. In this regard, one should also take into account that a sample-introduced bias (open resection versus stereotactic biopsies) may at least in part contribute to these divergent results.
Furthermore, application of the Wright et al.13 predictor, which classifies systemic DLBCL into ABC and GCB subtype, demonstrated PCNSL to distribute among the spectrum of DLBCL with tumors corresponding roughly equally to the ABC, GCB and type 3 subgroup. Although of high clinical interest, a correlation of these subgroups with prognosis is hampered by the still limited number of PCNSL available for gene expression profiling and awaits further studies. These data are in accordance with recent observations in a series of 23 PCNSL,14 which were equally represented in the two histoge- netic and the unclassifiable subgroups of DLBCL as defined by gene expression profiling.16 Thus, our results further support the notion that PCNSL exhibit characteristics associated with both ABC (IGM expression with absence of IG class switch, high frequency of somatic mutations of IG genes, recurrent 18q21 gains, activation of the nuclear factor-kB (NF-kB) pathway, high expression of BCL2 mRNA and protein1,17–19) and GCB type (expression of BCL6, ongoing somatic hypermutation1,20) DLBCL. Future studies with an increased number of patients will allow a further characterization of these subgroups.
Collectively, the transcriptional signature of PCNSL closely resembles that of systemic DLBCL. With respect to their gene expression profile, PCNSLs are distributed within the continuum of DLBCL including both the ABC and GCB subgroups. This transcriptional signature of PCNSL is in accordance with their immunological phenotype, which together suggest a histoge- netic derivation from a late GC B cell, reflecting a GC exit phenotype.
Supplementary Material
Acknowledgements
The expert technical assistance of Elena Fischer, Irmgard Henke, and Reina Zuhlke-Jenisch is gratefully acknowledged. This study was supported by the Deutsche Krebshilfe/Dr Mildred Scheel Stiftung für Krebsforschung (Grant no. 10–2153-De 1).
References
- 1.Montesinos-Rongen M, Küppers R, Schluter D, Spieker T, Van Roost D, Schaller C et al. Primary central nervous system lymphomas are derived from germinal-center B cells and show a preferential usage of the V4–34 gene segment. Am J Pathol 1999; 155: 2077–2086. [DOI] [PMC free article] [PubMed] [Google Scholar]
- 2.Thompsett AR, Ellison DW, Stevenson FK, Zhu D. V(H) gene sequences from primary central nervous system lymphomas indicate derivation from highly mutated germinal center B cells with ongoing mutational activity. Blood 1999;94: 1738–1746. [PubMed] [Google Scholar]
- 3.Camilleri-Broet S, Criniere E, Broet P, Delwail V, Mokhtari K, Moreau A et al. A uniform activated B-cell-like immunophenotype might explain the poor prognosis of primary central nervous system lymphomas: analysis of 83 cases. Blood 2006;107: 190–196. [DOI] [PubMed] [Google Scholar]
- 4.de Jong D, Rosenwald A, Chhanabhai M, Gaulard P, Klapper W, Lee A et al. Immunohistochemical prognostic markers in diffuse large B-cell lymphoma: validation of tissue microarray as a prerequisite for broad clinical applications—a study from the Lunenburg Lymphoma Biomarker Consortium. J Clin Oncol 2007; 25: 805–812. [DOI] [PubMed] [Google Scholar]
- 5.Deckert M, Paulus W. Malignant lymphomas In: Louis DN, Ohgaki H, Wiestler OD, Cavenee WK (eds). WHO Classification of Tumors Pathology & Genetics Tumours of the Nervous System. IRAC: Lyon, 2007, pp 188–192. [Google Scholar]
- 6.Basso K, Margolin AA, Stolovitzky G, Klein U, Dalla-Favera R, Califano A. Reverse engineering of regulatory networks in human B cells. Nat Genet 2005;37: 382–390. [DOI] [PubMed] [Google Scholar]
- 7.Barrett T, Troup DB, Wilhite SE, Ledoux P, Rudnev D, Evangelista C et al. NCBI GEO: mining tens of millions of expression profiles—database and tools update. Nucleic Acids Res 2007;35 (Database issue): D760–D765. [DOI] [PMC free article] [PubMed] [Google Scholar]
- 8.Vawter MP, Evans S, Choudary P, Tomita H, Meador-Woodruff J, Molnar M et al. Gender-specific gene expression in post-mortem human brain: localization to sex chromosomes. Neuropsycho- pharmacology 2004;29: 373–384. [DOI] [PMC free article] [PubMed] [Google Scholar]
- 9.Basso K, Liso A, Tiacci E, Benedetti R, Pulsoni A, Foa R et al. Gene expression profiling of hairy cell leukemia reveals a phenotype related to memory B cells with altered expression of chemokine and adhesion receptors. J Exp Med 2004;199: 59–68. [DOI] [PMC free article] [PubMed] [Google Scholar]
- 10.Califano A SPLASH: structural pattern localization analysis by sequential histograms. Bioinformatics 2000;16: 341–357. [DOI] [PubMed] [Google Scholar]
- 11.Lepre J, Rice JJ, Tu Y, Stolovitzky G. Genes@Work: an efficient algorithm for pattern discovery and multivariate feature selection in gene expression data. Bioinformatics 2004; 20: 1033–1044. [DOI] [PubMed] [Google Scholar]
- 12.Klein U, Tu Y, Stolovitzky GA, Mattioli M, Cattoretti G, Husson H et al. Gene expression profiling of B cell chronic lymphocytic leukemia reveals a homogeneous phenotype related to memory B cells. J Exp Med 2001;194: 1625–1638. [DOI] [PMC free article] [PubMed] [Google Scholar]
- 13.Wright G, Tan B, Rosenwald A, Hurt EH, Wiestner A, Staudt LM. A gene expression-based method to diagnose clinically distinct subgroups of diffuse large B cell lymphoma. Proc Natl Acad Sci USA 2003;100: 9991–9996. [DOI] [PMC free article] [PubMed] [Google Scholar]
- 14.Rubenstein JL, Fridlyand J, Shen A, Aldape K, Ginzinger D, Batchelor T et al. Gene expression and angiotropism in primary CNS lymphoma. Blood 2006;107: 3716–3723. [DOI] [PMC free article] [PubMed] [Google Scholar]
- 15.Hummel M, Bentink S, Berger H, Klapper W, Wessendorf S, Barth TF et al. A biologic definition of Burkitt’s lymphoma from transcriptional and genomic profiling. N Engl J Med 2006;354: 2419–2430. [DOI] [PubMed] [Google Scholar]
- 16.Rosenwald A, Wright G, Chan WC, Connors JM, Campo E, Fisher RI et al. The use of molecular profiling to predict survival after chemotherapy for diffuse large-B-cell lymphoma. N Engl J Med 2002;346: 1937–1947. [DOI] [PubMed] [Google Scholar]
- 17.Courts C, Montesinos-Rongen M, Martin-Subero JI, Brunn A, Siemer D, Zühlke-Jenisch R et al. Transcriptional profiling of the nuclear factor-kappaB pathway identifies a subgroup of primary lymphoma of the central nervous system with low BCL10 expression. J Neuropathol Exp Neurol 2007;66: 230–237. [DOI] [PubMed] [Google Scholar]
- 18.Montesinos-Rongen M, Schmitz R, Courts C, Stenzel W, Bechtel D, Niedobitek G et al. Absence of immunoglobulin class switch in primary lymphomas of the central nervous system. Am J Pathol 2005;166: 1773–1779. [DOI] [PMC free article] [PubMed] [Google Scholar]
- 19.Montesinos-Rongen M, Zühlke-Jenisch R, Gesk S, Martin-Subero JI, Schaller C, Van Roost D et al. Interphase cytogenetic analysis of lymphoma-associated chromosomal breakpoints in primary diffuse large B-cell lymphomas of the central nervous system. J Neuropathol Exp Neurol 2002; 61 : 926–933. [DOI] [PubMed] [Google Scholar]
- 20.Larocca LM, Capello D, Rinelli A, Nori S, Antinori A, Gloghini A et al. The molecular and phenotypic profile of primary central nervous system lymphoma identifies distinct categories of the disease and is consistent with histogenetic derivation from germinal center-related B cells. Blood 1998;92: 1011–1019. [PubMed] [Google Scholar]
Associated Data
This section collects any data citations, data availability statements, or supplementary materials included in this article.