Abstract
The primary management tactic for lepidopteran pests of cotton in the United States of America (USA) is the use of transgenic cotton that produces Bacillus thuringiensis Berliner (Bt) toxins. The primary target pests of this technology are Helicoverpa zea (Boddie) and Heliothis virescens (F.) in the eastern and central Cotton Belt of the USA. Concerns over the evolution of resistance in H. zea to Bt toxins and scrutiny of the necessity of Bt crops has escalated. We reviewed published and unpublished data from field trials of Bt cotton in the eastern and central Cotton Belt of the USA through 2015 to evaluate the effectiveness of Bt cotton (Bollgard, Bollgard II, WideStrike, WideStrike 3, and TwinLink). Bt cotton reduced insecticide usage, reduced heliothine pest numbers and damage, and provided a yield benefit, but Bollgard II and WideStrike efficacy declined in the Midsouth over the period evaluated. In the Southeastern region, heliothine damage remained constant through 2015, but yield benefits declined from 2010 until 2015. Resistance of H. zea to several Bt toxins is the most plausible explanation for the observed changes in Bt cotton efficacy. The introduction of new Bt toxins such as found in Widestrike 3 and Twinlink may preserve the benefits of Bt crops. However, while both Widestrike 3 and Twinlink had less damage than Widestrike, damage levels of both were similar to Bollgard II.
Introduction
Bt crops
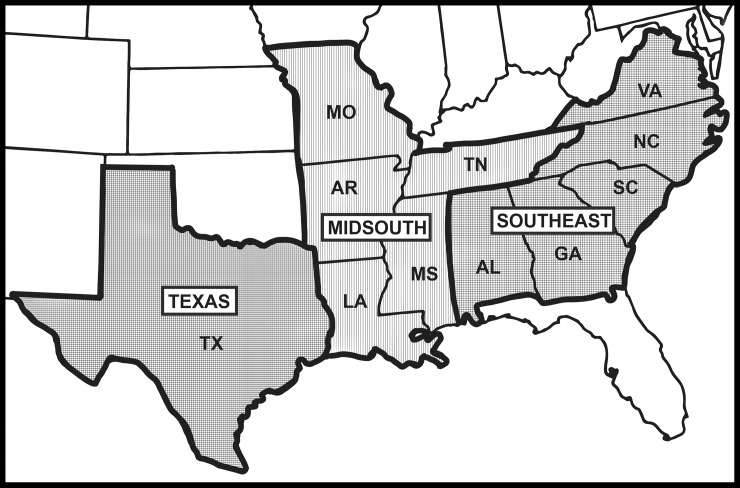
Lepidopteran insect control in transgenic crops is accomplished through the insertion of genes from the bacterium Bacillus thuringiensis Berliner (Bt). These genes encode for proteins with insecticidal activity in the midgut of targeted insect species. Five types of transgenic Bt cotton (Gossypium hirsutum L.) were commercialized between 1996 and 2015 in the United States (Table 1). In 2015, there were approximately 3.1 million hectares of cotton grown in Texas, the Midsouth and the Southeast combined (Fig 1), with transgenic Bt cotton planted on approximately 2.2 million hectares [1].
Table 1. Cotton technologies with transgenes from Bacillus thuringiensis Berliner (Bt) commercialized in the United States, 1996–2015.
| Technology | Year of commercial availability | Bt transgene(s) | Event |
|---|---|---|---|
| Bollgard | 1996 | Cry1Ac | Mon531 |
| Bollgard II | 2003 | Cry1Ac, Cry2Ab | Mon15985 |
| WideStrike | 2005 | Cry1Ac, Cry1F | 3006-210-23 + 281-24-236 |
| TwinLink | 2014 | Cry1Ab, Cry2Ae | T304-40 + GHB119 |
| WideStrike 3 | 2015 | Cry1Ac, Cry1F, Vip3A | 3006-210-23 + 281-24-236 + Cot102 |
Fig 1. Map of the eastern and central Cotton Belt of the United States indicating the regions and states of trial locations used for analyses in this paper.
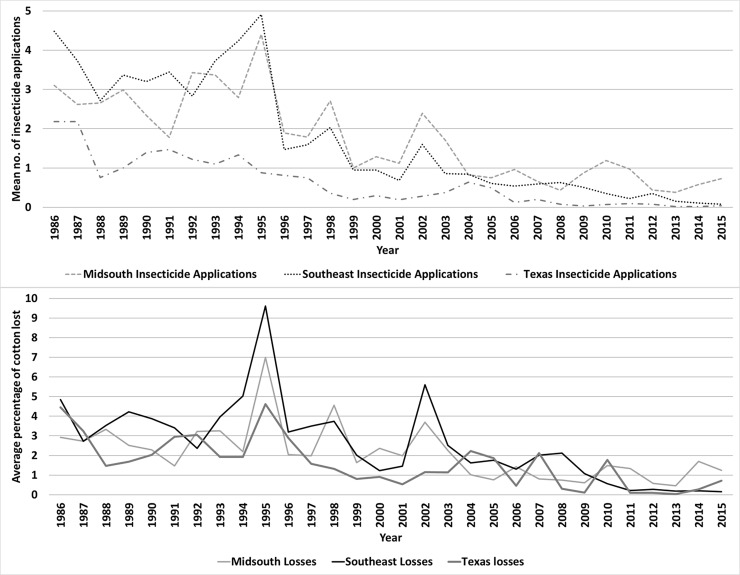
The primary pests targeted for control with Bt cotton in these regions are the heliothine species Helicoverpa zea (Boddie) (bollworm, corn earworm) and Heliothis virescens (F.) (tobacco budworm). These pests damage cotton by feeding primarily on and within the fruiting structures. Newly hatched H. zea and H. virescens larvae feed on plant terminals, then move to small squares, then larger squares, then bolls [2]. Estimates of insecticide usage and damage losses associated with these species following the introduction of Bt cotton (data from 1986–1995 compared to 1996–2015) were reduced by 61% and 47%, 79% and 60%, and 81% and 63%, respectively, in the Midsouth, Southeast, and Texas, respectively. [1] (Fig 2).
Fig 2. Changes in insecticide applications and yield losses in cotton due to heliothine infestations in the eastern Cotton Belt of the United States, 1986–2015.
Compiled from Williams [1].
Many of the same Bt genes have been introduced into corn to control various lepidopteran pests, including H. zea. This technology has been widely accepted by corn growers, grown on 81% of the area planted to corn in the U.S. in 2015 [3]. Bt corn was also commercially introduced in 1996, so exposure to the Bt toxins in both crops has occurred simultaneously.
Helicoverpa zea is a pest of both cotton and corn, and populations of H. zea may spend as many as four generations per year in these crops [4–6]. Populations occurring in areas where Bt corn and cotton are both grown are potentially exposed to the Cry1A, Cry1F, Cry2A, and Vip3A toxins in both crops. Corn is grown on approximately 3.4 million hectares in the eastern and central Cotton Belt, and the Environmental Protection Agency (EPA) mandates a planted refuge of non-Bt corn consisting of 50% or 20% of corn acres in cotton growing regions for single and multi-gene Bt corn varieties, respectively [7]. These refuge requirements are in place to slow resistance of pests to the Bt toxins; however, as few as 40 percent of growers adhere to the refuge requirements [8, 9], potentially resulting in the production of fewer susceptible individuals than desired for resistance management.
Concerns over resistance to Bt technology
Simulation models indicated that H. zea resistance to single-gene Bt crops could occur within 7 to 30 years [5, 10–13], while dual-gene crops would be expected to last longer [13]. The pyramiding of multiple toxins and a refuge strategy were implemented to slow the development of resistance of the major target pests to Bt crops [14–18]. Thus far, field-evolved Bt resistance has not been documented for H. virescens; however, laboratory selection of a Cry1Ac resistant colony has occurred [19]. Field-evolved resistance in populations of H. zea has been documented for Cry1Ab, Cry1Ac, and Cry1A.105+ Cry2Ab toxins in several locations [20–24].
Several factors may be solely or cumulatively responsible for H. zea resistance, including exposure of multiple generations of H. zea per year to Bt toxins in corn and cotton, lack of compliance with EPA mandated refuge requirements, exposure to the same Bt genes for many years, cross resistance to multiple Bt toxins, and the failure to express Bt at a high-dose from the outset [18]. Cry1Ab and Cry1Ac genes were the first Bt toxins commercially available and they are still found in most varieties of Bt corn and cotton after 20 years. The second Bt gene introduced for lepidopteran control in corn during 2001 and cotton during 2003 was Cry1F, and this gene also remains in many commercially available cotton and corn varieties. None of these toxins were ever considered to express a high-dose against H. zea [18, 25, 26]. Further increasing the likelihood of resistance development, various levels of cross-resistance to numerous Cry toxins has been documented in H. zea [11, 27, 28] as well as other Lepidoptera [26, 29, 30]. However, cross resistance to Bt toxins is not found in all studies [31]. Caprio [32] showed cross resistance has a negative impact on all resistance management strategies, but Caprio et al. [33] found that partial cross-resistance was of minor importance compared to refuge size in the evolution of resistance. The implications of continued exposure of H. zea to similar Bt toxins in multiple crops is not fully known, but all these studies suggest that declining efficacy of these toxins against H. zea should be expected.
Need for a meta-analysis
Evaluations of Bt cotton efficacy on lepidopteran pests has typically involved laboratory experiments with meridic diet or plant expressed protein and insect colonies from rearing facilities. Only six refereed articles [34–39] involving replicated field experiments and natural heliothine populations in the USA have been published. These experiments are important because they validate laboratory research in biologically relevant situations, revealing the strengths and weaknesses of Bt cotton in a range of environments and pest densities. The use and benefits of Bt cotton is complex when considering the differences in environment, pest populations, and IPM strategies across the country, and as a result, data from field experiments are highly variable or “noisy” on an individual basis [40]. Compiling large numbers of experiments together in a meta-analysis increases the precision of estimation, allowing researchers to detect small changes in susceptibility or other variables that are not possible with individual experiments [41, 42].
Five of the published field studies evaluated Cry1Ac (Bollgard), three evaluated Cry1Ac + Cry2Ab2 (Bollgard II), and one evaluated Cry1F + Cry1Ac (WideStrike). All experiments occurred between 1998 and 2003. The findings of these papers showed that Bt cotton reduced lepidopteran populations and the damage they cause and that this reduction further improved with the introduction of dual-gene technology. It has been nine years since the last refereed paper was published, and over fourteen years since the experiment was conducted. Since then, two Bt cotton technologies with three Bt genes new to cotton have been made commercially available (Table 1). Reduced efficacy of the older, single-gene technology has not been empirically demonstrated in field trials, nor has the efficacy of the older dual-gene technologies (Bollgard II and WideStrike), and the new dual- (TwinLink) and triple-gene (WideStrike 3) technologies been compared across multiple cotton growing regions. The results of this study will be important in predicting the longevity and benefits of the recently commercialized TwinLink Plus and Bollgard 3 technologies.
Objectives
Our primary objective is to summarize transgenic Bt cotton efficacy and yield data produced from 1996 to 2015 in field experiments that used natural heliothine populations in the USA. Trial locations ranged from Virginia to Texas, as these are the cotton production regions that frequently experience H. zea feeding. We used data from trials making threshold-based insecticide applications to assess the impacts of Bt technology on insecticide usage. Additionally, we used trials where insecticides targeting heliothines were not applied, to determine if changes in efficacy or yield have occurred over time and to compare efficacy and yield of various Bt and non-Bt varieties.
Methods
Compiling the dataset
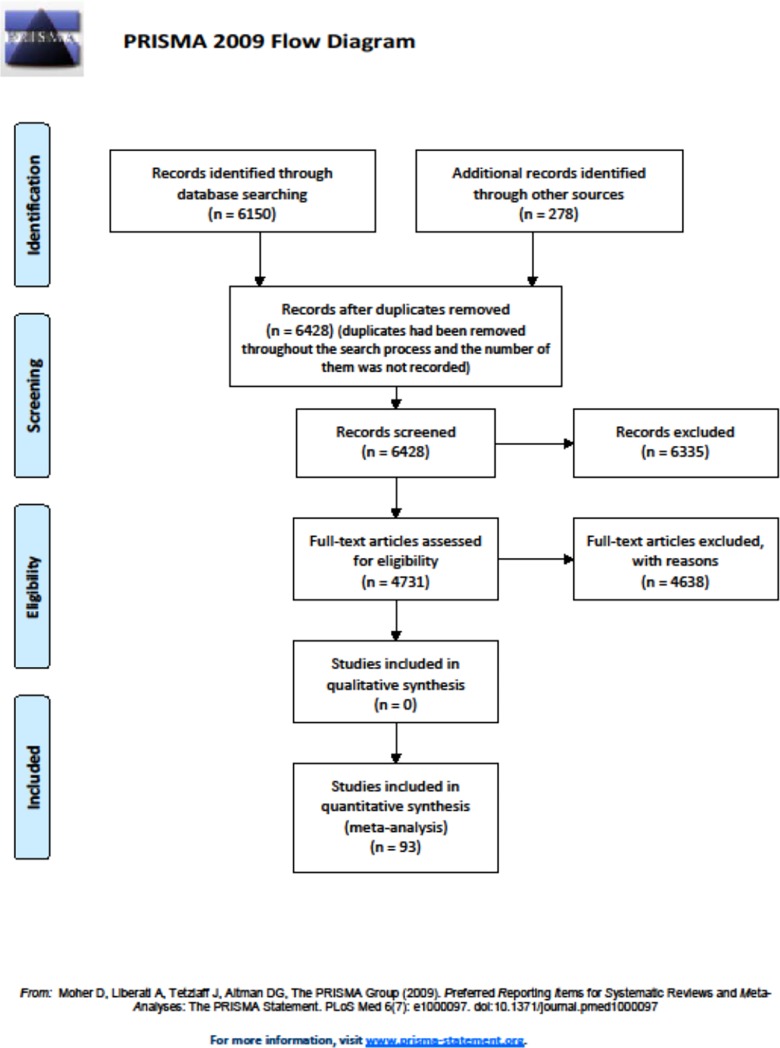
Articles containing information on Bt cotton used in field experiments were identified using a combination of the terms Bacillus thuringiensis, Gossypium hirsutum, and one of the following: Helicoverpa zea or Heliothis virescens. Searches were conducted in Google Scholar, EBSCO through the Mississippi State University Library Discovery Service, Oxford University Press, Science Direct, Scopus, PubMed, BioOne, ISI Web of Knowledge, and the Proceedings of the Beltwide Cotton Conferences. Searches were limited to articles published no earlier than 1996. Article citations were imported into EndNote (v. X5.0.1, Thomson Reuters, www.endnote.com) and titles and abstracts were read to determine if the article contained data relevant to our objectives. Data were used if the trials included a non-Bt and a commercialized Bt variety, were conducted in a field setting, relied upon natural heliothine populations, provided a measure of variance, and if the number of observations could be determined from the information provided. Additional information was requested from authors if information in the article was insufficient or needed further clarification. In addition to these published articles, current university research and Extension Service entomologists working with cotton in the target regions were asked to provide unpublished data that met the same requirements. Researchers supplying unpublished data were asked for clarification of data they provided if information was lacking. Data that were still in doubt regarding their use in this study was ignored. All appropriate data were placed into a database for statistical analysis. While not a requirement, all but three sources of data used in the analysis were from university and private company sponsored research plots. Fig 3 shows the PRISMA Flow Diagram. The data used for meta-analysis can be found in the Mississippi State University Institutional Repository (http://hdl.handle.net/11668/14199). A Prisma checklist was included as supplemental information to the journal (S1 Fig) [43].
Fig 3. The PRISMA flow diagram[43].
Data collected included the state, city and year of the research, the type and frequency of insecticide usage for heliothine pests, the plant part(s) evaluated, yield, type of evaluation (heliothine counts, plant damage, and cotton yield), mean values, number of observations, and a measure of variance. Insecticide application types were separated as blanket sprays (same insecticide, rate, and number of applications were used over both Bt and non-Bt varieties), threshold sprays (Bt and non-Bt varieties were treated independently as pests reached the threshold for each technology), or none (no insecticide was used to manage heliothines). The threshold used was based on larval density or fruit damage as recommended by the extension service where the trial was conducted. The Bt and non-Bt varieties were not necessarily genetically related but were varieties that had similar maturities and growth habits. The specific varieties compared are listed in the repository. The larvae of H. zea and H. virescens are difficult to distinguish in field settings [44, 45], therefore, very little species-specific information was available to allow our study to evaluate the effects of Bt technologies separately for these two species.
Statistical analyses
The sources of reported data and numbers of observations for each technology were calculated in SAS Proc Tabulate (SAS Institute, Cary, NC, USA). Data from trials conducting threshold insecticide applications were used to evaluate the extent of insecticide reduction between Bt technologies (Bollgard, Bollgard II, and WideStrike; data for TwinLink and WideStrike 3 were insufficient for analysis) and non-Bt varieties. Differences in insecticide usage were calculated using the formula:
Number of applications for technology1—Number of applications for technology2 Differences were analyzed as paired t-tests (SAS Institute, Cary, NC, USA). Pairs were made whenever both technologies were tested within the same trial. For the remaining analyses, only data from trials not using foliar insecticide to manage heliothine pests were used.
Data evaluating heliothine counts, plant damage, and yield comparisons of Bt to non-Bt cotton included results from separate studies that varied over a wide range in values. Various metrics of effect size are used in meta-analysis in order to convert these measurements to a common scale. The log response ratio [46, 47] is recommended where the outcome expresses the magnitude of the response to an experimental treatment by comparing to an experimental control group. The log response ratio (RR) and the scaled sampling variance of this metric (VRR) are defined as follows:
We modified the original formulas to use Mean + 1 in place of a mean. In some cases, the mean was zero or close to zero which caused problems when dividing by zero or a very small number.
To estimate overall means for the log response ratio and detect what factors might affect this ratio, analysis of variance was performed using a general linear mixed model (PROC GLIMMIX, SAS Institute, Cary, NC USA). Data were initially analyzed without using any weighting method but this was rejected because the quality of the VRR data available from some studies was much better than from other studies. This was generally not a reflection of sample size, but of the statistics available to estimate VRR. Secondly, the inverse VRR weighting method [48] was tested. This weighting method was also rejected because weights varied by more than 1000 times in some comparisons, giving an excessive amount of weight to a small number of studies.
As a compromise between no weighting and the inverse VRR weighting method, the VRR were sorted from low to high and assigned a weight from 1 to 5 based on their rank. Those trials having the smallest 20% of VRR were assigned a weight of 5. Those trials in the second lowest 20% were given a weight of 4 and so on, so that the 20% of observations with the largest VRR were given a weight of 1. While we are not aware of this weighting system being used previously, it is basically a scaled version of the commonly used inverse VRR weighting system so that no individual trial counts more than five times more than the poorest trial in the analysis.
As mentioned above, there were limited data available to estimate the VRR of some trials. An estimate of variance was needed to calculate VRR and these estimates were difficult to obtain from some studies. Variances were estimated for each Bt: non-Bt and Bt: Bt comparison by determining a standard error of the difference (SE diff) for each comparison. The SE diff for data using the least significant difference (LSD) values to estimate variance was calculated as LSD/t-value. The SE diff for data using standard deviation (SD) to estimate variance was calculated as SE diff = (([technology1 SD2] / [technology1 n]) + ([technology2 SD2] / [technology2 n]))0.5. The SE diff for data using standard error (SE) to estimate variance was calculated as SE diff = ([technology1 SE2] + [technology2 SE2])0.5.
Data from trials pre-dating commercial availability of each technology (Table 1) were excluded from analyses as any changes prior to commercialization would be due to agronomic factors, and not Bt toxin effectiveness. Overall differences in response to the technologies were evaluated (reported as overall intercept in S6 Table). In addition, the main effects evaluated for heliothine counts and damage were plant part, region, and year, and the main effects evaluated for yield were region and year. The interaction of year and plant part was evaluated for heliothine counts and plant damage, and the interaction of year and region was evaluated for heliothine counts, damage and yield. The three-way interaction of year, plant part, and region and the two-way interaction of plant part and region were not analyzed because of a lack of data. Analyses for all main effects were done independently (i.e. the impact of plant part was not tested in the same analysis as region) since the data that met the requirement for each analysis differed. For analyses, regions and plant parts not having at least five observations were excluded from analyses involving their respective effects. Year was analyzed as a continuous variable with linear and quadratic terms. The value of year was set as year of study—1995. To analyze year as a factor, there needed to be at least 3 observations for each of 5 years (but not necessarily consecutive years). This requirement meant that year could not be analyzed for WideStrike 3 and TwinLink as they had not yet been commercialized for 5 years by 2015. Years occurring at either end of the tested time scale with less than 3 observations were deleted. To test the interaction of region or plant part with year required a region or plant part to have at least five years of data with at least three observations per year. As a result, many of the year interactions included only two regions or plant parts due to insufficient data for one or more regions or plant parts. Least square means for technology comparisons were separated using Fisher’s Protected Least Significant Difference test (LSD) (α = 0.05). Significant regressions over time were simplified by removing the non-significant terms from the final equation. Data were tested for normality of distribution and examined for outliers more than three standard deviations from the predicted value. Nine comparisons were identified as outliers for one or more models. All outliers were for Bollgard to non-Bt or Bollgard 2 to non-Bt comparisons. All outliers occurred prior to 2009 and the Bt technology was always more effective than predicted by the model. Five of these outliers were from a single trial in Texas in 2004 when insect damage was high in the non-Bt plots, but no damage was observed in the Bollgard and Bollgard II plots. These outliers were deleted from the data set so that the analysis would not be skewed by these rare circumstances. The number of data points omitted was never more than 5% of the total number of data points analyzed for any comparison. Multiple regression was used initially for analysis, but due to a paucity of data in numerous areas, was not used because results of several factors were frequently driven by one or two trials.
Results
Literature review
Over 6,000 articles were examined for inclusion in this study. The articles (refereed or otherwise) used are listed in S1 Table. There were 910 comparisons of Bt: non-Bt cotton and 523 comparisons of Bt technologies to one another (S2 and S3 Tables). Additionally, 1,293 Bt: non-Bt comparisons and 915 comparisons of Bt technologies were collected from unpublished sources (S1–S3 Tables). Overall, 63%, 32% and 5% of the data were from the Midsouth, Southeast and Texas, respectively. No data for TwinLink or WideStrike 3 were available from Texas. The number of comparisons of Bt: non-Bt and Bt: Bt for heliothine counts, damage and cotton yield are given in S4 and S5 Tables.
Threshold-based insecticide usage
Data from comparisons with insecticide targeting heliothines on a threshold basis were used to determine the extent of the reduction of insecticide usage resulting from using Bt cotton. Data from Bollgard, Bollgard II, and WideStrike were available. The use of these technologies reduced insecticide usage by 1.3 to 2.6 applications (Table 2) relative to non-Bt cotton. Bollgard II reduced insecticide usage by approximately 1.1 applications when compared to Bollgard and 0.8 applications when compared to WideStrike (Table 2).
Table 2. Paired t-test comparisons of insecticide applications based on larval thresholds for heliothine pests in trials in the eastern and central Cotton Belt of the United States for Bt and non-Bt cotton.
| Mean ± SE of the number of insecticide applications | Mean ± SE of the number of insecticide applications reduced | |||||||
|---|---|---|---|---|---|---|---|---|
| t-test results | ||||||||
| Technology 1 | Technology 2 | Study Years | Technology 1 | Technology 2 | df | t | p | |
| Non-Bt | Bollgard | 96–09 | 3.5 ± 0.2 | 2.1 ± 0.2 | 1.3 ± 0.1 | 61 | 9.7 | <0.01 |
| Non-Bt | Bollgard II | 04–10 | 3.8 ± 0.5 | 1.3± 0.4 | 2.6 ± 0.4 | 17 | 7.3 | <0.01 |
| Non-Bt | WideStrike | 06–11 | 3.5 ± 0.5 | 1.5 ± 0.4 | 2.0 ± 0.3 | 21 | 6.3 | <0.01 |
| Bollgard | Bollgard II | 04–09 | 1.7 ± 0.7 | 0.6 ± 0.2 | 1.1 ± 0.4 | 8 | 2.5 | 0.04 |
| WideStrike | Bollgard II | 06–10 | 2.5 ± 0.5 | 1.6 ± 0.6 | 0.8 ± 0.3 | 12 | 3.2 | <0.01 |
Efficacy comparisons
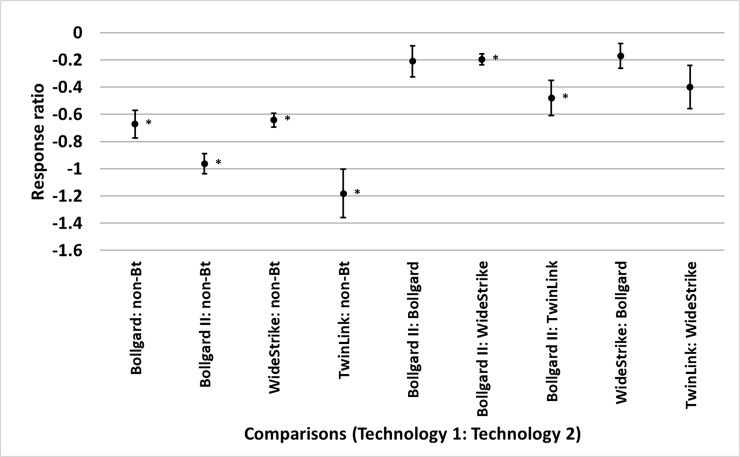
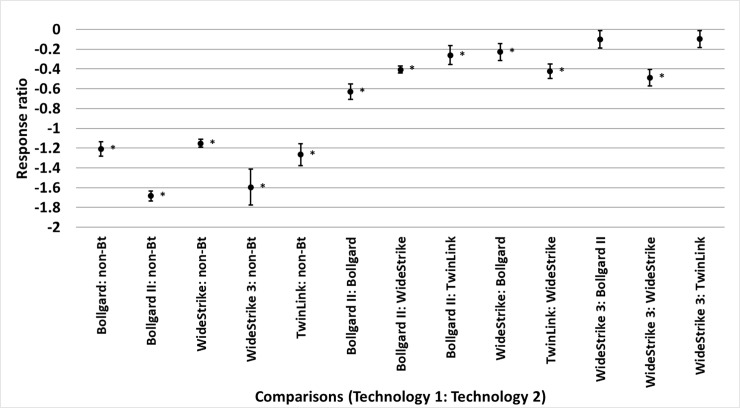
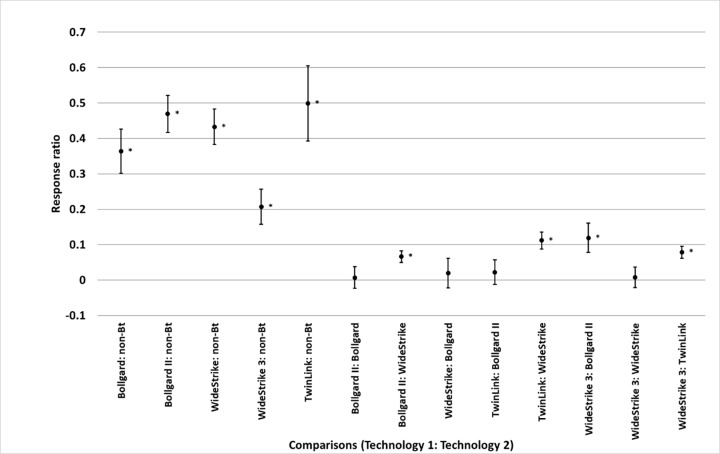
Comparisons of Bt cotton to non-Bt and other Bt cotton types were conducted to determine the extent of reduction of heliothine counts and damage, how efficacy of Bt technologies compared to each other, and how yield was affected (S6 Table). Bollgard, Bollgard II, WideStrike, and TwinLink reduced heliothine infestations relative to non-Bt by 49% (p<0.0001), 61.8% (p<0.0001), 47.4% (p<0.0001), and 69.3% (p<0.0001), respectively. Bollgard II reduced heliothine infestations 17.9% more than WideStrike (p<0.0001) and 38.2% more than TwinLink (p = 0.004) (Fig 4). Bollgard, Bollgard II, WideStrike, WideStrike 3, and TwinLink reduced damage relative to non-Bt by 70%, 81%, 68%, 80%, and 72%, respectively (p<0.0001 for all technologies). Bollgard II reduced damage 47% more than Bollgard (p<0.0001), 33% more than WideStrike (p<0.0001), and 23% more than TwinLink (p = 0.010); TwinLink reduced damage 35% more than WideStrike (p<0.0001); WideStrike reduced damage 21% more than Bollgard (p = 0.015); and WideStrike 3 reduced damage 39% more than WideStrike (p<0.0001) (Fig 5). Bollgard, Bollgard 2, WideStrike, WideStrike 3, and TwinLink all improved yield relative to non-Bt by 44% (p<0.0001), 60% (p<0.0001), 54% (p<0.0001), 23% (p = 0.004), and 65% (p = 0.0002), respectively. Bollgard II and TwinLink had a higher yield than WideStrike of 7% (p = 0.0002) and 12% (p = 0.0003), respectively, and WideStrike 3 had a 13% higher yield than Bollgard II (p = 0.034) and 8% higher yield than TwinLink (p = 0.005) (Fig 6).
Fig 4. Least square mean ± SE of the response ratio of heliothine counts among comparisons of transgenic Bacillus thuringiensis (Bt) and non-Bt cotton in trials from the eastern and central Cotton Belt of the United States.
Response ratio = ln ([Technology 1 meanx + 1] / [Technology 2 meanx + 1]). Comparisons marked by * indicate the technologies differed (t-test, p<0.05).
Fig 5. Least square mean ± SE of the response ratio of damage among comparisons of transgenic Bacillus thuringiensis (Bt) and non-Bt cotton in trials from the eastern and central Cotton Belt of the United States.
Response ratio = ln ([Technology 1 meanx + 1] / [Technology 2 meanx + 1]). Comparisons marked by * indicate the technologies differed (t-test, p<0.05).
Fig 6. Least square mean ± SE of the response ratio of yield among comparisons of transgenic Bacillus thuringiensis (Bt) and non-Bt cotton in trials from the eastern and central Cotton Belt of the United States.
Response ratio = ln ([Technology 1 meanx +1] / [Technology 2 meanx + 1]). Comparisons marked by * indicate the technologies differed (t-test, p<0.05).
Bt to non-Bt comparison: Effects of year, region, and plant part on heliothine counts and damage
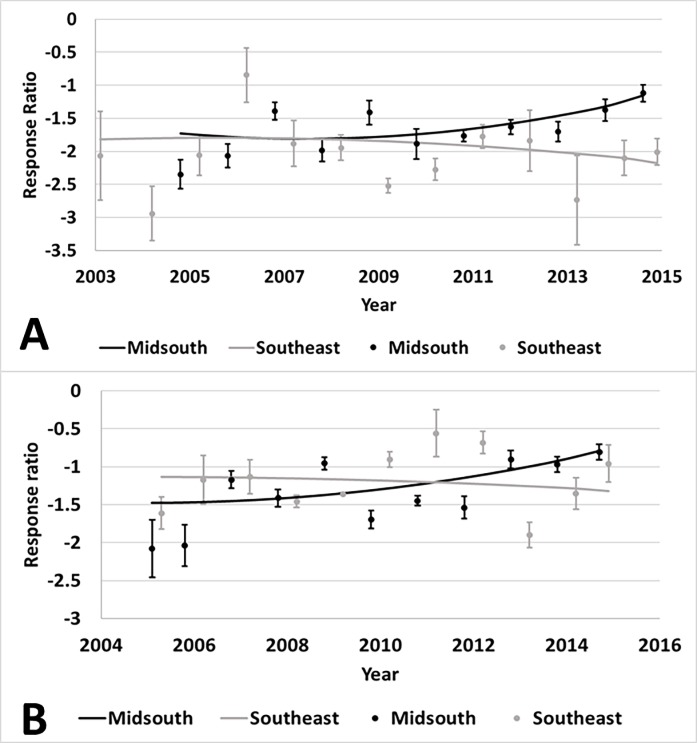
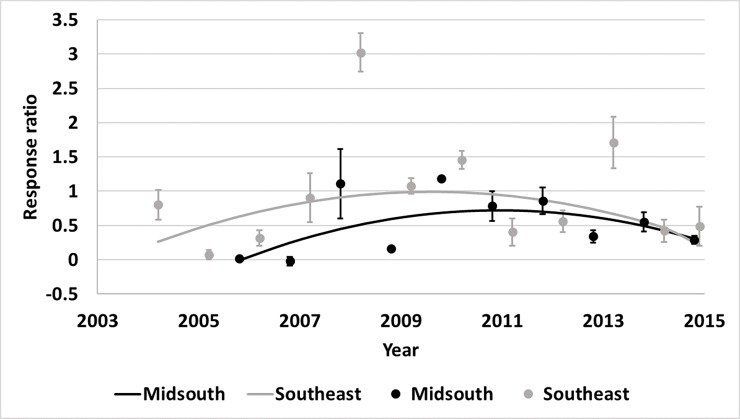
The main effects of year, region, and plant part and interactions of year with plant part and year with region were evaluated to determine if changes in Bt efficacy have occurred over time or if efficacy is different for plant parts or regions (S6 Table). There was an interaction of year and region for Bollgard II (p<0.01) and WideStrike (p<0.01) heliothine counts. The Midsouth had an increase in heliothine numbers collected from both Bollgard II and WideStrike relative to non-Bt as time progressed (Fig 7). Heliothine counts in the Southeast increased over time in Bollgard II and WideStrike relative to non-Bt; however, after 2010 counts began decreasing (Fig 7).
Fig 7.
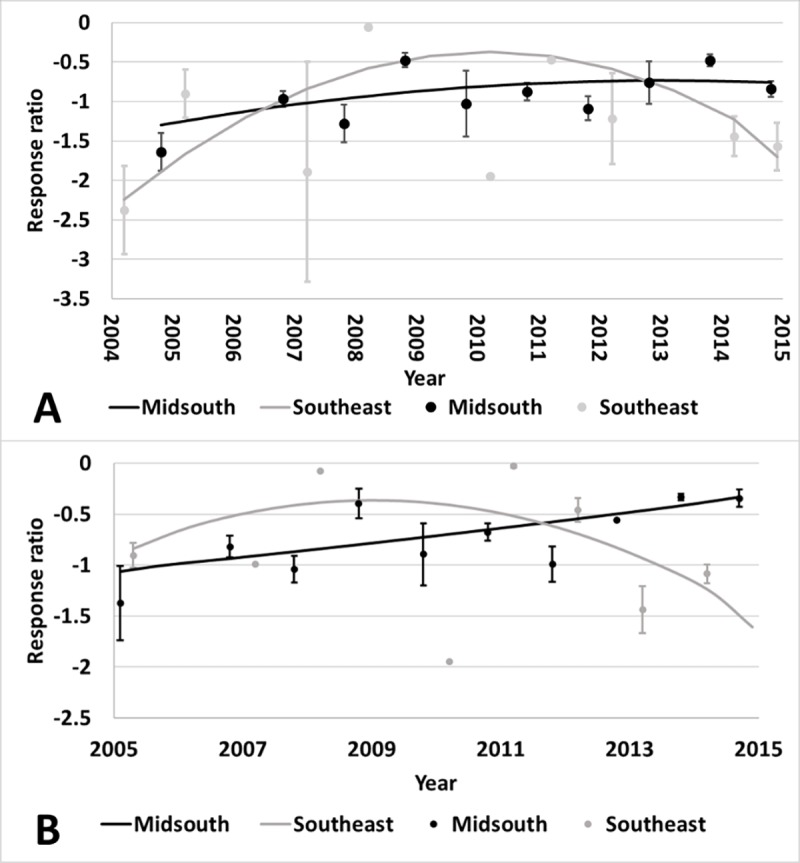
Change over time of heliothine counts in Bollgard II (A) and WideStrike (B) cotton by region of the eastern and central Cotton Belt of the United States. Bollgard II Midsouth equation: 0.0429x - 1.5111, Southeast equation: 1.569x - 0.05243x2–12.1179; WideStrike Midsouth equation: 0.0750x - 1.8438, Southeast equation: 0.9008x - 0.03258x2–6.5835. Response ratio (A) = ln ([Bollgard II meanx + 1] / [non-Bt meanx + 1]); Response ratio (B) = ln ([WideStrike meanx + 1] / [non-Bt meanx + 1]).
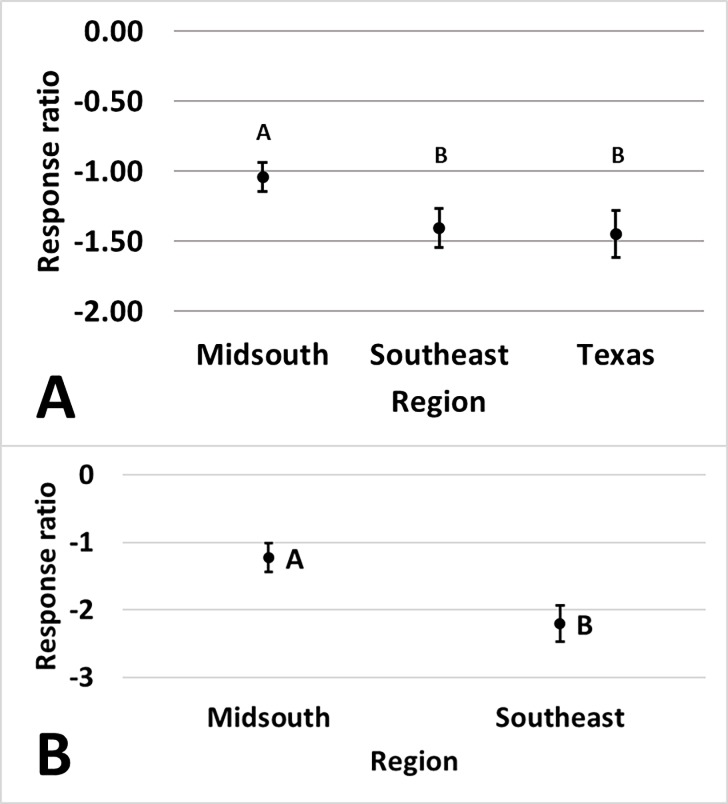
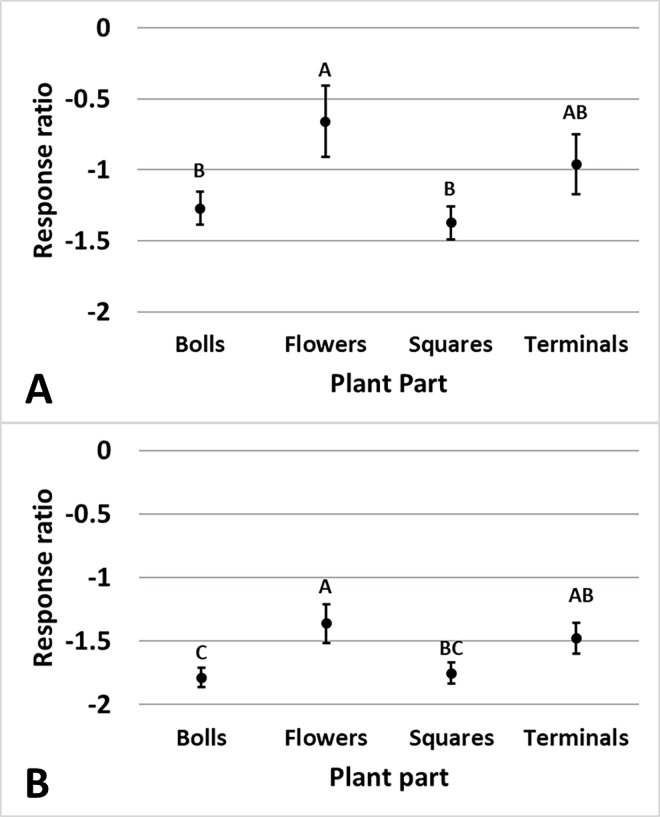
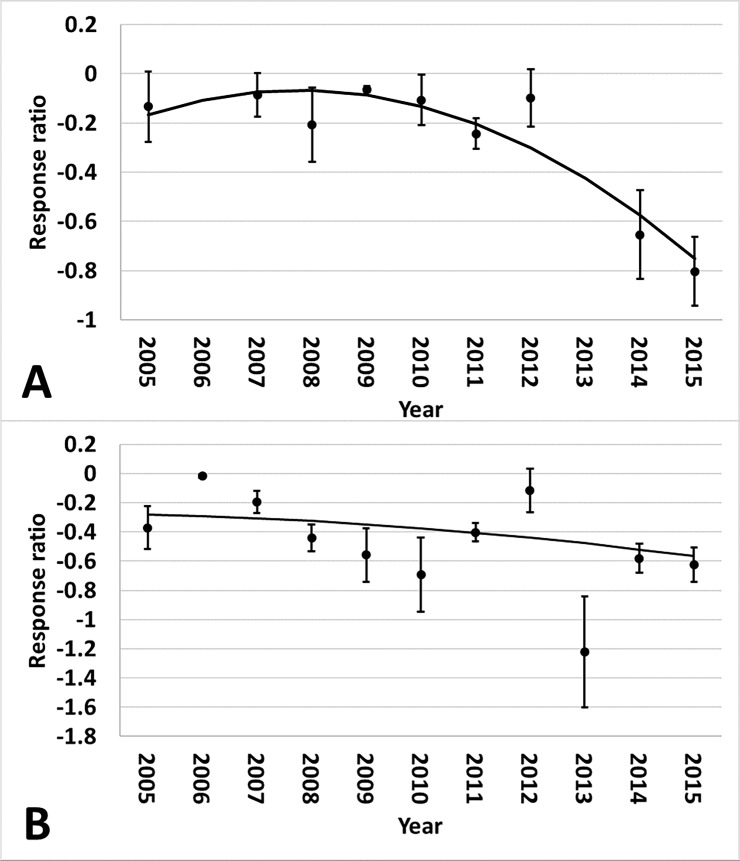
There was an interaction of year and region for Bollgard II (p<0.01) and WideStrike (p<0.01) damage. As time progressed, damage increased for both technologies in the Midsouth compared to non-Bt, but there was not a change in damage for either technology in the Southeast (Fig 8). Region influenced Bollgard (p = 0.040) and WideStrike 3 (p = 0.007) damage. Damage in Bollgard relative to non-Bt was reduced by 65% in the Midsouth compared to 74% and 77% in the Southeast and Texas, respectively (Fig 9). Damage in WideStrike 3 relative to non-Bt was reduced by 89% in the Southeast compared to 71% in the Midsouth. Plant part influenced the amount of damage reduction provided by Bollgard (p = 0.045) and Bollgard II (p = 0.022) technologies relative to non-Bt. Damage in Bollgard was reduced less on flowers (48%) than on bolls (72%) and squares (75%) (Fig 9). Damage in Bollgard II was reduced less on flowers (74%) than on bolls (83%) and squares (83%) and damage on terminals (77%) was reduced less than damage on bolls (83%) (Fig 10).
Fig 8.
Change over time of damage in Bollgard II (A) and WideStrike (B) cotton by region of the eastern and central Cotton Belt of the United States. Bollgard II Midsouth equation: 0.0759x - 2.7923; Southeast equation: -1.9273; WideStrike Midsouth equation: 0.0776x – 2.4088; Southeast equation: -1.214. Response ratio (A) = ln ([Bollgard II meanx + 1] / [non-Bt meanx + 1]); Response ratio (B) = (ln([WideStrike meanx + 1] / [non-Bt meanx + 1]).
Fig 9.
Least square mean ± SE of the response ratio of region of Bollgard (A) and WideStrike 3 (B) damage data from trials in the eastern and central Cotton Belt of the United States. Regions not sharing the same uppercase letter are different (Least square means α = 0.05). Response ratio (A) = ln ([Bollgard meanx + 1] / [non-Bt meanx + 1]); Response ratio (B) = ln ([WideStrike 3 meanx + 1] / [non-Bt meanx + 1]).
Fig 10.
Least square mean ± SE of the response ratio of plant part of Bollgard (A) and Bollgard II (B) damage data from trials in the eastern and central Cotton Belt of the United States. Plant parts not sharing the same uppercase letter are different (Least square means α = 0.05). Response ratio (A) = ln ([Bollgard meanx + 1] / [non-Bt meanx + 1]); Response ratio (B) = ln ([Bollgard II meanx + 1] / [non-Bt meanx + 1]).
Bt to non-Bt comparisons: Effects of year and region on yield
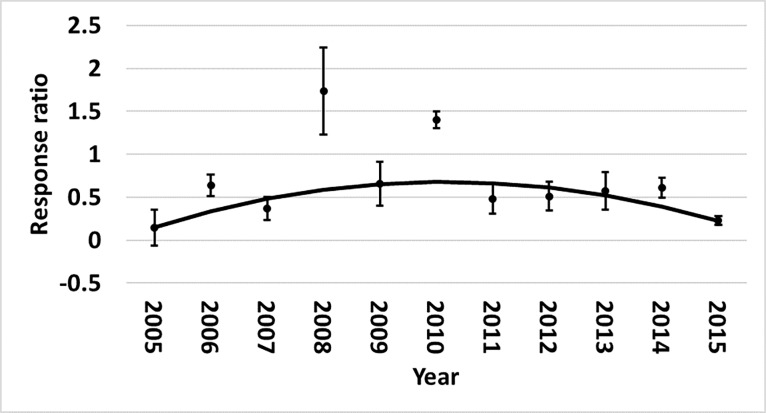
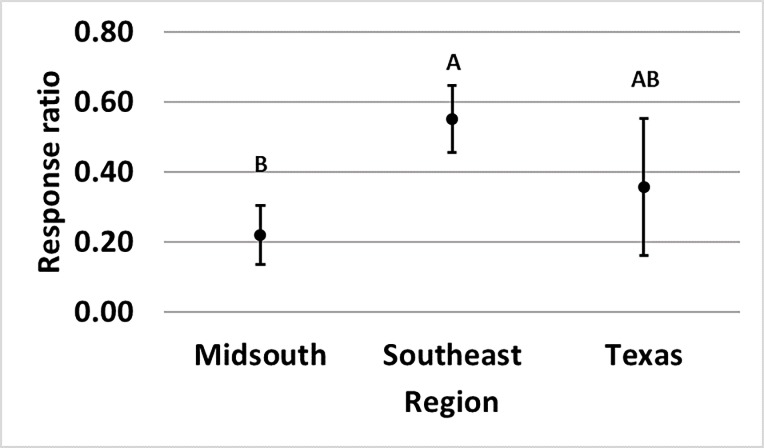
The main effects and interaction of year and region were evaluated to determine if changes in yield of Bt technologies occurred over time or if yield was affected by region (S6 Table). There was an interaction of year and region for Bollgard II (Fig 11). The yield benefit over non-Bt cotton initially increased in both regions, but then began to decline beginning around 2010. This is consistent with the increased heliothine counts and damage observed in the Midsouth. WideStrike yields followed a similar trend (Fig 12). Region influenced Bollgard yield relative to non-Bt cotton (p = 0.0415). Yield increase of Bollgard was greater in the Southeast (73%) than in the Midsouth (25%) (Fig 13).
Fig 11. Change over time of yield in Bollgard II cotton by region in trials from the eastern and central Cotton Belt of the United States.
Midsouth equation: 0.8941x - 0.02767x2–6.4911; Southeast equation: 0.7171x - 0.02489x2–4.1691. Response ratio = ln ([Bollgard II meanx + 1] / [non-Bt meanx + 1]).
Fig 12. Change over time of yield in WideStrike cotton in trials from the eastern and central Cotton Belt of the United States.
Equation: 0.593x - 0.01954x2–3.8209. Response ratio = ln ([WideStrike meanx + 1 ] / [non-Bt meanx + 1]).
Fig 13. Least square mean ± SE of the response ratio of region of Bollgard cotton yield in trials from the eastern and central Cotton Belt of the United States.
Regions not sharing the same uppercase letter are different (Least square means α = 0.05). Response ratio = ln ([Bollgard meanx + 1] / [non-Bt meanx + 1]).
Effects of plant part and region on Bt technologies
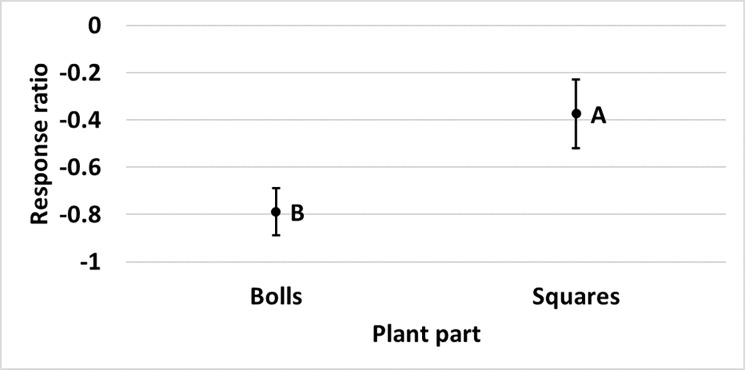
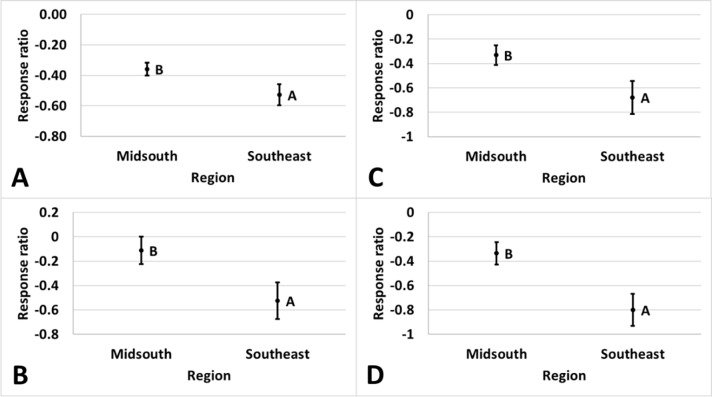
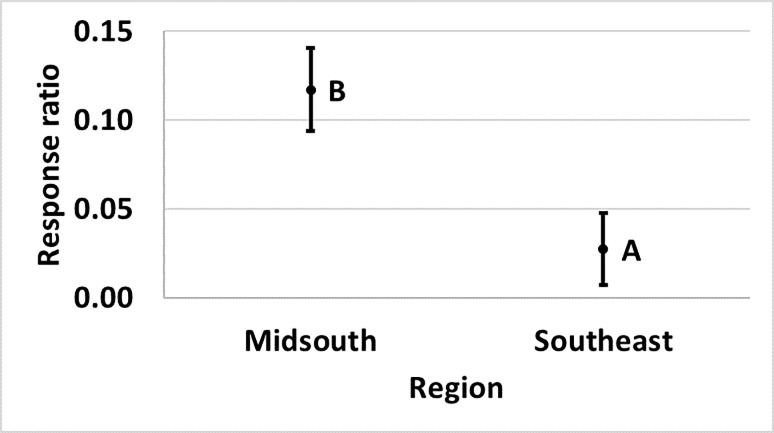
The main effects of year, plant part, and region were evaluated to compare heliothine counts, damage and yield between Bt technologies (S6 Table). Year influenced heliothine counts (p<0.01) and damage (p = 0.03) in the Bollgard II: WideStrike comparison. Over time, the difference between Bollgard II and WideStrike increased for both heliothine counts and damage (Fig 14) as efficacy declined more rapidly in Widestrike than in Bollgard II. Plant part influenced the damage difference observed between Bollgard II and Bollgard. Damage reduction by Bollgard II compared to Bollgard was 54% on bolls and 31% on squares (Fig 15). Relative performance of comparisons between different Bt technologies varied by region for damage. Damage was reduced by 41% in the Southeast and 30% in the Midsouth in Bollgard II compared to WideStrike (p = 0.039), by 41% in the Southeast and 11% in the Midsouth in Bollgard II compared to TwinLink (p = 0.036), by 49% in the Southeast and 28% in the Midsouth in TwinLink compared to WideStrike (p = 0.034), and 55% in the Southeast and 28% in the Midsouth in Widestrike 3 compared to WideStrike (p = 0.006) (Fig 16). Region influenced the Bollgard II: WideStrike comparison of yield with Bollgard II having a greater yield benefit (13%) in the Midsouth than in the Southeast (3%) relative to WideStrike (p = 0.006) (Fig 17).
Fig 14.
Change over time of heliothine counts (A) and damage (B) of the comparison of Bollgard 2: WideStrike cotton in trials from the eastern and central Cotton Belt of the United States. Heliothine counts equation: 0.3345x - 0.01305x2–2.2011, Damage equation: -0.0303x - 0.0581. Response ratio (A and B) = ln ([Bollgard II meanx + 1] / [WideStrike meanx + 1]).
Fig 15. Least square mean ± SE of the response ratio of plant part of the comparison of Bollgard II: Bollgard damage in trials from the eastern and central Cotton Belt of the United States.
Plant parts not sharing the same uppercase letter are different (Least square means α = 0.05). Response ratio = ln ([Bollgard II meanx + 1] / [Bollgard meanx + 1]).
Fig 16.
Least square mean ± SE of the response ratio of damage by region of (A) Bollgard II: WideStrike, (B) Bollgard II: WideStrike 3, (C) TwinLink: WideStrike, and (D) WideStrike 3: WideStrike comparisons in trials from the eastern and central Cotton Belt of the United States. Regions not sharing the same uppercase letter are different (Least square means α = 0.05). Response ratio (A) = ln ([Bollgard II meanx + 1] / [WideStrike meanx + 1]); Response ratio (B) = ln ([Bollgard II meanx + 1] / [WideStrike 3 meanx + 1]); Response ratio (C) = ln ([TwinLink meanx + 1] / [WideStrike meanx + 1]); Response ratio (D) = ln ([WideStrike 3 meanx + 1] / [WideStrike meanx + 1]).
Fig 17. Least square mean ± SE of the response ratio of damage by region of the Bollgard II: WideStrike comparison in trials from the eastern and central Cotton Belt of the United States.
Regions not sharing the same uppercase letter are different (Least square means α = 0.05). Response ratio = ln ([Bollgard II meanx + 1] / [WideStrike meanx + 1]).
Discussion
Literature review
This paper reviewed published literature from 20 years of commercialized use of Bt cotton technologies; however, only six refereed articles fit the criteria for use in this paper and these data all occurred within the first 7 years of Bt cotton commercialization in the USA. The remainder of the data were from non-refereed sources or were unpublished data from university entomologists. The review revealed that although a large body of field-based Bt research exists, most of the information has not been subjected to peer-review. The primary reason for this is that many Bt field trials are stand-alone experiments and would not be appropriate for peer-review publications but fit well into report style publications such as the Proceedings of the Beltwide Cotton Conferences, Arthropod Management Tests, or Extension Service bulletins. However, the scrutiny of genetically modified crops, including Bt technologies, is increasing, and having more refereed, field-validated data will become increasingly important.
Texas accounted for only 5 percent of the data in this analysis; however, approximately 50 percent of the United States cotton acreage is in Texas [1]. Heliothine severity in Texas is lower than in the Midsouth and Southeast [1] and Bt technologies have provided exceptional suppression of heliothines. Therefore, less research on Bt cotton efficacy has been conducted in this region.
Bias
Analyses to evaluate bias were not conducted as part of this study. Two main sources of bias were considered; however, these two sources, publication bias and selective reporting due to industry sponsorship, could not be effectively evaluated because the vast majority of the data used were from non-refereed sources and were conducted by entomologists in industry or receiving industry funds in their public university positions. This was unavoidable due to the nature of this type of research being conducted almost exclusively by entomologists who receive funding through industry to conduct applied research trials with commercial products to develop grower recommendations. Based on our knowledge, only three papers [36, 49, 50] may have been conducted without any possibility of industry influence or bias. These papers contributed 8 of 246 (3%), 5 of 585 (0.9%), and 3 of 580 (0.5%) data points for Bollgard, Bollgard II and Widestrike, respectively. This study had the advantage of having a large body of data from many sources across a wide breadth of locations and years, so the impact of any individual’s bias is minimal.
Impacts of Bt technology on insecticide usage, heliothine counts, cotton damage, and yield
Cotton production practices in the USA have been impacted by Bt technology (Fig 2). The number of foliar insecticide applications in all Bt cotton technologies relative to non-Bt varieties were lowered, reducing environmental impacts from insecticides. Foliar insecticides are still often necessary in Bt cotton production and may become more important if resistance to Bt toxins becomes frequent and widespread. Newer Bt cotton technologies (TwinLink and WideStrike 3) were as good as or better than earlier Bt technologies for control of lepidopteran pests, but their impact on insecticide use could not be evaluated in this study. In the absence of foliar insecticide applications, differences between Bt and non-Bt cotton for heliothine counts, damage and cotton yield were documented for all technologies. Heliothine densities and damage were reduced, and yields of all technologies except WideStrike 3 increased. The combination of decreased insecticide use, decreased heliothine damage, and increased yields has been a substantial benefit of Bt technology for growers and the environment.
Efficacy comparisons between Bt technologies and non-Bt varieties
Regional differences were found for Bt efficacy as measured by heliothine counts, damage, and yield for all technologies except TwinLink. Generally, the impact of technologies was greater in the Southeast than in the Midsouth. Bollgard and Bollgard II were the only technologies that had differences in relative damage between plant parts, with both providing more protection of bolls and squares than flowers, which is consistent with previous research [51, 52].
Efficacy comparisons between Bt technologies
Bollgard II, WideStrike 3, and TwinLink all provided better control of heliothines than WideStrike regarding damage, and WideStrike provided better control than the single-gene product, Bollgard. Among the multi-gene technologies, the lower efficacy of WideStrike was likely due to its reliance on Cry1Ac, which was the first Bt gene inserted into commercial cotton varieties and has had resistance documented in H. zea [21, 22, 24], and the lack of efficacy of Cry1F against H. zea [25]. There was not a difference between WideStrike 3 and either Bollgard II or TwinLink, which was unexpected due to the addition of the Vip3A gene [53]. Only one year of data was available for WideStrike 3 comparisons and more research is needed before drawing conclusions on the impact of this new toxin. Unlike Bt to non-Bt comparisons where the non-Bt variety was normally a close genetic relative of the Bt variety, genetic similarity is not expected between Bt technologies developed by different companies. Therefore, some of the differences in yield between Bt technologies may have been due to differences in yield potential of the germplasm rather than the impact of the Bt toxins. Differences between damage on plant parts were observed only between Bollgard and Bollgard II and were consistent with comparisons of these technologies to non-Bt varieties. Regional differences between technologies were numerous and followed the same trend as comparisons between Bt and non-Bt where differences in technologies were greater in the Southeast than in the Midsouth. Taken together, these data reveal that multi-gene technology was superior to single-gene technology, thus demonstrating the need for additional pyramiding of novel Bt genes. Also, while performance varied depending on location and the aspect of efficacy being measured, relative performance of the technologies to each other and to non-Bt varieties was reasonably consistent.
Changes in efficacy and yield over time
Evaluations of heliothine counts and damage over time revealed no changes in Bollgard efficacy from 1996 to 2008; however, a loss of efficacy occurred for both Bollgard II and WideStrike from introduction until 2015 in the Midsouth region (Figs 11 and 12). These technologies rely on three of the oldest commercialized Bt toxins (Cry1Ac, Cry2Ab and Cry1F) and resistance to Cry1Ac and Cry2Ab toxins has been documented [20, 22, 24, 54, 55]. Another contributing factor to the apparent loss of efficacy could be a shift to a higher proportion of H. zea in the heliothine complex. Heliothis virescens is more susceptible to Cry1Ac than H. zea [24], and therefore has a lower survival rate in Bt cotton. With the widespread adoption to Bt crops, population suppression of H. virescens may have occurred, resulting in H. zea comprising a higher proportion of the heliothine complex in non-Bt cotton [56, 57], resulting in the apparent loss of efficacy in Bt cotton even without a change in susceptibility toward either pest. The decline in efficacy reported here supports anecdotal observations of many entomologists in the Midsouth, and highlights the need for additional technologies for H. zea control, and the need for continued development of new insecticides and management tactics for lepidopteran pest management in cotton. The reason efficacy in the Southeast had not deteriorated is unknown, but could be related to different landscape diversity reducing selection pressure, a different source population that has experienced less selection, or H. virescens comprising a larger proportion of the heliothine complex in the Southeast. Given the mobility of H. zea [58–60], resistance developed in one part of the USA can spread rapidly throughout the country, so regional differences are unlikely to persist with this insect.
Evaluations of yield revealed complex changes over time. In both the Midsouth and Southeast regions, yield differences between Bt technologies (Bollgard II and WideStrike) and non-Bt varieties initially increased after commercialization, suggesting improved genetics of the varieties containing Bt technologies. After about 2010, these yield differences started to decrease, which is consistent with the increasing damage trends for these technologies in the Midsouth. While damage prevention and yield benefits appear to have decreased, Bt technologies still provided some protection from lepidopteran pests through 2015 which resulted in some yield benefits.
Summary
Reductions in insecticide usage occurred with Bt cotton, but foliar insecticides were still needed to manage heliothine pests in many cases. Bt cotton reduced losses to heliothines and improved yields relative to non-Bt varieties, but economic benefits of these changes were not evaluated. Declining yield benefits of Bt technologies from around 2010 to 2015 were observed in the Midsouth and Southeast for Bollgard II and WideStrike technologies. Possible reasons for this are a decline in efficacy or a decline in insect pressure. Pheromone trap catches of heliothines would suggest that there is high annual variability in population size, but there was not a consistent trend from 2010–2015 (unpublished data, FRM). A decline in efficacy of Bt cotton was observed in the Midsouth, but not in the Southeast. This decline in efficacy could be due to insects becoming resistant to one or more Bt toxins or other changes being made in cotton genetics that alter susceptibility to heliothines. Since non-transgenic heliothine resistance is not a known goal for cotton breeders, it is most likely that changes in efficacy were due to insects developing resistance to the commercialized Bt toxins. This study was not able to distinguish counts and damage between H. virescens and H. zea. Since the authors are not aware of any H. virescens survival on any Bt cotton, it is assumed that changes in efficacy are due to changes in H. zea susceptibility. Given the mobile nature of H. zea, the resistance that was most pronounced in the Midsouth by 2015 may spread throughout the range of H. zea. As resistance becomes more common, the need to introduce new Bt technologies and improve other means of managing heliothine pests in cotton will increase. Furthermore, since Bt corn and Bt cotton use many of the same Bt toxins and H. zea develops on both crops, resistance management strategies should take both crops into consideration.
Supporting information
(PDF)
1Arthropod Management Tests; 2Proceedings of the Beltwide Cotton Conferences; 3Extension publication; 4Thesis or dissertation; 5No data reported from T/D; 6 No data reported for other technologies.
(PDF)
1Arthropod Management Tests; 2Proceedings of the Beltwide Cotton Conference; 3Extension publication; 4Thesis or dissertation; 5No data reported from T/D; 6 No data reported for other comparisons.
(PDF)
1Data reported as a combination of bolls, flowers, and/or squares; 2Data reported as a combination of reproductive structures and terminals; 3No data reported for other technologies.
(PDF)
1Data reported as a combination of bolls, flowers, and/or squares; 2Data reported as a combination of reproductive structures and terminals; 3No data reported for other comparisons.
(PDF)
n/e = not estimated.
(PDF)
(PDF)
Acknowledgments
The authors would like to thank Joe MacGown for providing Fig 1 and two anonymous reviewers for helping to improve this manuscript.
Data Availability
All data from the dataset used for analysis and a list of citations used to create the data are available from Mississippi State University Institutional Repository (Title: Bt Cotton Meta-analysis data, URL: http://ir.library.msstate.edu/handle/11668/14199).
Funding Statement
This project was partially funded through United States Department of Agriculture Specific Cooperative Agreement USDA-SCA 58-6402-3-038 received by FM. This agreement provided support in the form of salary for one author (DF). NL was the USDA representative overseeing the agreement who participated as a co-author from idea development through paper review. Additional support came from Mississippi State University Hatch Project MIS-311280 for the support of FM.
References
- 1.Williams MR. Cotton insect losses [Internet]. Mississippi State University; 1986–2015. [cited 2016 April 20]. Available from: http://www.entomology.msstate.edu/resources/cottoncrop.asp. [Google Scholar]
- 2.Leigh TF, Roach SH, Watson TF. Biology and ecology of important insect and mite pests of cotton In: King EG, Phillips JR, Coleman RJ, editors. Cotton Insect and Mites: Characterization and Management. Memphis, TN: The Cotton Foundation; 1996. p. 17–85. [Google Scholar]
- 3.Wechsler SJ. Recent trends in GE adoption 2017. Available from: https://www.ers.usda.gov/data-products/adoption-of-genetically-engineered-crops-in-the-us/recent-trends-in-ge-adoption.aspx.
- 4.Parker Jr. CD. Temporal distribution of heliothines in corn-cotton cropping systems of the Mississippi Delta and relationships to yield and population growth [Dissertation]: Mississippi State University; 2000.
- 5.Caprio MA, Luttrell RG, MacIntosh S, Rice ME, Siegfried B, Witkowski JF, et al. An evaluation of insect resistance management in Bt field corn: a science-based framework for risk assessment and risk management. Washington, D.C.: International Life Sciences Institute/Health and Environmental Sciences Institute; 1999. [Google Scholar]
- 6.Stadelbacher EA, Graham HM, Harris VE, Lopez JD, Phillips JR, Roach SH. Heliothis populations and wild host plants in the Southern U.S. In: King EG, Johnson SJ, Bradley JR, editors. Theory and Tactics of Heliothis Population Management; 1986. p. 54–74. [Google Scholar]
- 7.EPA. Insect Resistance Management for Bt Plant-incorporated Protectants [Internet]. United States Environmental Protection Agency; 2017. [cited 2018 February 16]. Available from: https://www.epa.gov/regulation-biotechnology-under-tsca-and-fifra/insect-resistance-management-bt-plant-incorporated. [Google Scholar]
- 8.Jaffe G. Complacency on the farm. Washington, D.C.: Center For Science In The Public Interest; 2009. [Google Scholar]
- 9.Reisig DD. Factors associated with willingness to plant non-Bt maize refuge and suggestions for increasing refuge compliance. J Integr Pest Manag. 2017; 8: 1–10. 10.1093/jipm/pmx002 [DOI] [Google Scholar]
- 10.Gould F, Tabashnik. BT-cotton resistance management In: Mellon M, Rissler J, editors. Now or Never: Serious Plans to Save a Natural Pest Control. Cambridge, MA: Union of Concerned Scientists; 1998. p. 67–105. [Google Scholar]
- 11.Storer NP, Peck SL, Gould F, Van Duyn JW, Kennedy GG. Sensitivity analysis of a spatially-explicit stochastic simulation model of the evolution of resistance in Helicoverpa zea (Lepidoptera: Noctuidae) to Bt transgenic corn and cotton. J Econ Entomol. 2003; 96: 173–87. 10.1603/0022-0493-96.1.173 . [DOI] [PubMed] [Google Scholar]
- 12.Storer NP, Peck SL, Gould F, Van Duyn JW, Kennedy GG. Spatial processes in the evolution of resistance in Helicoverpa zea (Lepidoptera: Noctuidae) to Bt transgenic corn and cotton in a mixed agroecosystem: a biology-rich stochastic simulation model. J Econ Entomol. 2003; 96: 156–72. 10.1603/0022-0493-96.1.156 . [DOI] [PubMed] [Google Scholar]
- 13.Edwards KT, Caprio MA, Allen KC, Musser FR. Risk assessment for Helicoverpa zea (Lepidoptera: Noctuidae) resistance on dual-gene versus single-gene corn. J Econ Entomol. 2013; 106: 382–92. 10.1603/EC12203 . [DOI] [PubMed] [Google Scholar]
- 14.Roush RT. Two-toxin strategies for management of insecticidal transgenic crops: can pyramiding succeed where pesticide mixtures have not? Philosophical Transactions of the Royal Society B: Biological Sciences. 1998; 353: 1777–86. 10.1098/rstb.1998.0330 PMID: PMC1692399; PubMed Central PMCID: PMC1692399. [DOI] [Google Scholar]
- 15.Shelton AM, Tang JD, Roush RT, Metz TD, Earle ED. Field tests on managing resistance to Bt-engineered plants. Nat Biotechnol. 2000; 18: 339–42. 10.1038/73804 [DOI] [PubMed] [Google Scholar]
- 16.Gould F. Bt-resistance management-theory meets data. Nat Biotechnol. 2003; 21: 1450–1. 10.1038/nbt1203-1450 . [DOI] [PubMed] [Google Scholar]
- 17.Ives AR, Glaum PR, Ziebarth NL, Andow DA. The evolution of resistance to two-toxin pyramid transgenic crops. Ecological Applications. 2011; 21: 503–15. 10.1890/09-1869.1 [DOI] [PubMed] [Google Scholar]
- 18.Huang F, Andow DA, Buschman LL. Success of the high-dose/refuge resistance management strategy after 15 years of Bt crop use in North America. Entomol Exp Appl. 2011; 140: 1–16. 10.1111/j.1570-7458.2011.01138.x [DOI] [Google Scholar]
- 19.Gould F, Anderson A, Reynolds A, Bumgarner L, Moar W. Selection and genetic analysis of a Heliothis virescens (Lepidoptera: Noctuidae) strain with high levels of resistance to Bacillus thuringiensis toxins. J Econ Entomol. 1995; 88: 1545–59. 10.1093/jee/88.6.1545 [DOI] [Google Scholar]
- 20.Dively GP, Venugopal PD, Finkenbinder C. Field-evolved resistance in corn earworm to Cry proteins expressed by transgenic sweet corn. PLoS ONE [Internet]. 2016; 11(12). Available from: 10.1371/journal.pone.0169115. [DOI] [PMC free article] [PubMed] [Google Scholar]
- 21.Tabashnik BE, Carrière Y. Field-evolved resistance to Bt cotton: bollworm in the U.S. and pink bollworm in India. Southwest Entomol. 2010; 35: 417–24. . Publication Type: Journal Article. Language: English. Language of Summary: Spanish. Number of References: 36 ref. Subject Subsets: Biocontrol. [Google Scholar]
- 22.Luttrell RG, Ali I, Allen KC, Young SY, Szalanski A, Williams K, et al. Resistance to Bt in Arkansas populations of cotton bollworm In: Richter DA, editor. Proceedings of the 2004 Beltwide Cotton Conference; San Antonio, TX2004. p. 1373–83.
- 23.Luttrell RG, Ali MI. Exploring selection for Bt resistance in heliothines: results of laboratory and field studies. Proceedings of the 2007 Beltwide Cotton Conference; New Orleans, Louisiana2007. p. 1073–86.
- 24.Ali MI, Luttrell RG, Young SY. Susceptibilities of Helicoverpa zea and Heliothis virescens (Lepidoptera: Noctuidae) populations to Cry1Ac insecticidal protein. J Econ Entomol. 2006; 99: 164–75. 10.1603/0022-0493(2006)099[0164:sohzah]2.0.co;2 . [DOI] [PubMed] [Google Scholar]
- 25.Crespo ALB, Alves AP, Wang Y, Hong B, Flexner JL, Catchot A, et al. Survival of corn earworm (Lepidoptera: Noctuidae) on Bt maize and cross-pollinated refuge ears from seed blends. J Econ Entomol. 2015; 109: 288–98. 10.1093/jee/tov272 [DOI] [PubMed] [Google Scholar]
- 26.Brévault T, Heuberger S, Zhang M, Ellers-Kirk C, Ni X, Masson L, et al. Potential shortfall of pyramided transgenic cotton for insect resistance management. Proceedings of the National Academy of Sciences. 2013; 110: 5806–11. 10.1073/pnas.1216719110 . [DOI] [PMC free article] [PubMed] [Google Scholar]
- 27.Jackson RE, Gould F, Bradley JR, Van Duyn JW. Genetic variation for resistance to Bacillus thuringiensis toxins in Helicoverpa zea (Lepiodptera: Noctuidae) in eastern North Carolina. J Econ Entomol. 2006; 99: 1790–7. . [DOI] [PubMed] [Google Scholar]
- 28.Welch KL, Unnithan GC, Degain BA, Wei J, Zhang J, Li X, et al. Cross-resistance to toxins used in pyramided Bt crops and resistance to Bt sprays in Helicoverpa zea. J Invert Pathol. 2015; 132: 149–56. 10.1016/j.jip.2015.10.003 . [DOI] [PubMed] [Google Scholar]
- 29.Tabashnik BE, Liu Y-B, Finson N, Masson L, Heckel DG. One gene in diamondback moth confers resistance to four Bacillus thuringiensis toxins. Proceedings of the National Academy of Sciences. 1997; 94: 1640–4. [DOI] [PMC free article] [PubMed] [Google Scholar]
- 30.Gould F, Martinez-Ramirez A, Anderson A, Ferre J, Silva FJ, Moar WJ. Broad-spectrum resistance to Bacillus thuringiensis toxins in Heliothis virescens. Proceedings of the National Academy of Sciences. 1992; 89: 7986–90. [DOI] [PMC free article] [PubMed] [Google Scholar]
- 31.Anilkumar KJ, Rodrigo-Simon A, Ferre J, Pusztai-Carey M, Sivasupramaniam S, Moar WJ. Production and characterization of Bacillus thuringiensis Cry1Ac-resistant cotton bollworm Helicoverpa zea (Boddie). Applied and Environmental Microbiology. 2008; 74: 462–9. 10.1128/AEM.01612-07 [DOI] [PMC free article] [PubMed] [Google Scholar]
- 32.Caprio MA. Evaluating resistance management strategies for multiple toxins in the presence of external refuges. J Econ Entomol. 1998; 91: 1021–31. 10.1093/jee/91.5.1021 [DOI] [Google Scholar]
- 33.Caprio MA, Suckling DM. Simulating the impact of cross resistance between Bt toxins in transformed clover and apples in New Zealand. J Econ Entomol. 2000; 93: 173–9. 10.1603/0022-0493-93.2.173 [DOI] [PubMed] [Google Scholar]
- 34.Brickle DS, Turnipseed SG, Sullivan MJ. Efficacy of insecticides of different chemistries against Helicoverpa zea (Lepidoptera: Noctuidae) in transgenic Bacillus thuringiensis and conventional cotton. J Econ Entomol. 2001; 94: 86–92. 10.1603/0022-0493-94.1.86 . [DOI] [PubMed] [Google Scholar]
- 35.Head G, Moar W, Eubanks M, Freeman B, Ruberson J, Hagerty A, et al. A multiyear, large-scale comparison of arthropod populations on commercially managed Bt and non-Bt cotton fields. Environ Entomol. 2005; 34: 1257–66. [Google Scholar]
- 36.Adamczyk JJ, Adams LC, Hardee DD. Field efficacy and seasonal expression profiles for terminal leaves of single and double Bacillus thuringiensis toxin cotton genotypes. J Econ Entomol. 2001; 94: 1589–93. 10.1603/0022-0493-94.6.1589 . [DOI] [PubMed] [Google Scholar]
- 37.Chitkowski RL, Turnipseed SG, Sullivan MJ, Bridges WC. Field and laboratory evaluations of transgenic cottons expressing one or two Bacillus thuringiensis var. kurstaki Berliner proteins for management of noctuid (Lepidoptera) pests. J Econ Entomol. 2003; 96: 755–62. 10.1603/0022-0493-96.3.755 . [DOI] [PubMed] [Google Scholar]
- 38.Hagerty AM, Kilpatrick AL, Turnipseed SG, Sullivan MJ, Bridges WC. Predaceous arthropods and lepidopteran pests on conventional, Bollgard, and Bollgard II cotton under untreated and disrupted conditions. Environ Entomol. 2005; 34: 105–14. [Google Scholar]
- 39.Siebert MW, Nolting S, Leonard BR, Braxton LB, All JN, Duyn JWv, et al. Efficacy of transgenic cotton expressing Cry1Ac and Cry1F insecticidal protein against heliothines (Lepidoptera: Noctuidae). J Econ Entomol. 2008; 101: 1950–9. [DOI] [PubMed] [Google Scholar]
- 40.Rosenheim JA, Gratton C. Ecoinformatics (big data) for agricultural entomology: pitfalls, progress, and promise. Annu Rev Entomol. 2017; 62: 399–417. 10.1146/annurev-ento-031616-035444 [DOI] [PubMed] [Google Scholar]
- 41.Stewart G. Meta-analysis in applied ecology. Biology Letters. 2010; 6: 78–81. 10.1098/rsbl.2009.0546 . [DOI] [PMC free article] [PubMed] [Google Scholar]
- 42.Tonhasca A, Byrne DN. The effects of crop diversification on herbivorous insects: a meta-analysis approach. Ecol Entomol. 1994; 19: 239–44. 10.1111/j.1365-2311.1994.tb00415.x [DOI] [Google Scholar]
- 43.Moher D, Liberati A, Tetzlaff J, Altman DG, The PG. Preferred Reporting Items for Systematic Reviews and Meta-Analyses: The PRISMA Statement. PLOS Medicine. 2009; 6: e1000097 10.1371/journal.pmed.1000097 [DOI] [PMC free article] [PubMed] [Google Scholar]
- 44.Neunzig HH. The eggs and early-instar larvae of Heliothis zea and Heliothis virescens (Lepidoptera: Noctuidae). Ann Entomol Soc Am. 1964; 57: 98–102. 10.1093/aesa/57.1.98 [DOI] [Google Scholar]
- 45.Seward R, Stewart S. Identification of bollworms and tobacco budworms in cotton [Internet]. University of Tennessee; 2017. [cited 2017 January 17]. Available from: http://www.utcrops.com/cotton/cotton_insects/pubs/boll_vs_bud.pdf. [Google Scholar]
- 46.Gurevitch J, Curtis PS, Jones MH. Meta-analysis in ecology. Advances in Ecological Research. 2001; 32: 199–247. [Google Scholar]
- 47.Rosenberg MS, Rothstein HR, Gurevitch J. Effect sizes: conventional choices and calculations In: Koricheva J, Gurevitch J, Mengersen K, editors. Handbook of Meta-analysis in Ecology and Evolution. Princeton and Oxford: Princeton University Press; 2013. p. 61–71. [Google Scholar]
- 48.Gurevitch J, Hedges LV. Statistical issues in ecological meta-analyses. Ecology. 1999; 80: 1142–9. 10.1890/0012-9658(1999)080[1142:SIIEMA]2.0.CO;2 [DOI] [Google Scholar]
- 49.Adamczyk JJ, Jr., Bew K, Adams LC, Hardee DD, editors. Evaluation of Bollgard II (cv. DP50BII) in the Mississippi Delta: field efficacy against various Lepidoptera while profiling season-long expression of Cry1Ac and Cry2Ab. Proceedings, Beltwide Cotton Conferences; 2001; Anaheim, CA: National Cotton Council.
- 50.Adamczyk JJ, Jr., Gore J, Pellow J, editors. Evaluation of Dow Agrosciences' Cry1Ac/Cry1F trait for improved lepidopteran control. Proceedings, Beltwide Cotton Conferences; 2003; Nashville, TN: National Cotton Council.
- 51.Adamczyk JJ, Hardee DD, Adams LC, Sumerford DV. Correlating differences in larval survival and development of bollworm (Lepidoptera: Noctuidae) and fall armyworm (Lepidoptera: Noctuidae) to differential expression of Cry1A(c) δ-endotoxin in various plant parts among commercial cultivars of transgenic Bacillus thuringiensis cotton. J Econ Entomol. 2001; 94: 284–90. 10.1603/0022-0493-94.1.284 . [DOI] [PubMed] [Google Scholar]
- 52.Benedict JH, Sachs ES, Altman DW, Deaton WR, Kohel RJ, Ring DR, et al. Field Performance of cottons expressing transgenic CryIA insecticidal proteins for resistance to Heliothis virescens and Helicoverpa zea (Lepidoptera: Noctuidae). J Econ Entomol. 1996; 89: 230–8. 10.1093/jee/89.1.230 [DOI] [Google Scholar]
- 53.Burkness EC, Dively G, Patton T, Morey AC, Hutchison WD. Novel Vip3A Bacillus thuringiensis (Bt) maize approaches high-dose efficacy against Helicoverpa zea (Lepidoptera: Noctuidae) under field conditions: Implications for resistance management. GM Crops. 2010; 1: 337–43. 10.4161/gmcr.1.5.14765 . [DOI] [PubMed] [Google Scholar]
- 54.Ali MI, Luttrell RG. Susceptibility of bollworm and tobacco budworm (Lepidoptera: Noctuidae) to Cry2Ab2 insecticidal protein. J Econ Entomol. 2007; 100: 921–31. 10.1093/jee/100.3.921 . [DOI] [PubMed] [Google Scholar]
- 55.Tabashnik BE, Van Rensburg JBJ, Carrière Y. Field-evolved insect resistance to Bt crops: definition, theory, and data. J Econ Entomol. 2009; 102: 2011–25. 10.1603/029.102.0601 . [DOI] [PubMed] [Google Scholar]
- 56.Adamczyk JJ Jr., Hubbard D. Changes in populations of Heliothis virescens (F.) (Lepidoptera: Noctuidae) and Helicoverpa zea (Boddie) (Lepidoptera: Noctuidae) in the Mississippi delta from 1986 to 2005 as indicated by adult male pheromone traps J Cotton Sci. 2006; 10: 155–60. [Google Scholar]
- 57.Micinski S, Blouin DC, Waltman WF, Cookson C. Abundance of Helicoverpa zea and Heliothis virescens in pheromone traps during the past twenty years in Northwestern Louisiana. Southwest Entomologist. 2008; 33: 139–49. [Google Scholar]
- 58.Sandstrom MA, Changnon D, Flood BR. Improving our understanding of Helicoverpa zea migration in the Midwest: assessment of source populations. Plant Health Progress [Internet]. 2007. [Google Scholar]
- 59.Goodenough JL, Witz JA, Lopez JD, Hartstack AW. Patterns of occurrence of Heliothis spp. (Lepidoptera: Noctuidae), 1983–1985. J Econ Entomol. 1988; 81: 1624–30. 10.1093/jee/81.6.1624 [DOI] [Google Scholar]
- 60.Westbrook JK, Wolf WW, Lingren PD, Raulston JR, Lopez JJD, Matis JH, et al. Early-season migratory flights of corn earworm (Lepidoptera: Noctuidae). Environ Entomol. 1997; 26: 12–20. 10.1093/ee/26.1.12 [DOI] [Google Scholar]
Associated Data
This section collects any data citations, data availability statements, or supplementary materials included in this article.
Supplementary Materials
(PDF)
1Arthropod Management Tests; 2Proceedings of the Beltwide Cotton Conferences; 3Extension publication; 4Thesis or dissertation; 5No data reported from T/D; 6 No data reported for other technologies.
(PDF)
1Arthropod Management Tests; 2Proceedings of the Beltwide Cotton Conference; 3Extension publication; 4Thesis or dissertation; 5No data reported from T/D; 6 No data reported for other comparisons.
(PDF)
1Data reported as a combination of bolls, flowers, and/or squares; 2Data reported as a combination of reproductive structures and terminals; 3No data reported for other technologies.
(PDF)
1Data reported as a combination of bolls, flowers, and/or squares; 2Data reported as a combination of reproductive structures and terminals; 3No data reported for other comparisons.
(PDF)
n/e = not estimated.
(PDF)
(PDF)
Data Availability Statement
All data from the dataset used for analysis and a list of citations used to create the data are available from Mississippi State University Institutional Repository (Title: Bt Cotton Meta-analysis data, URL: http://ir.library.msstate.edu/handle/11668/14199).


